Creating Graphs
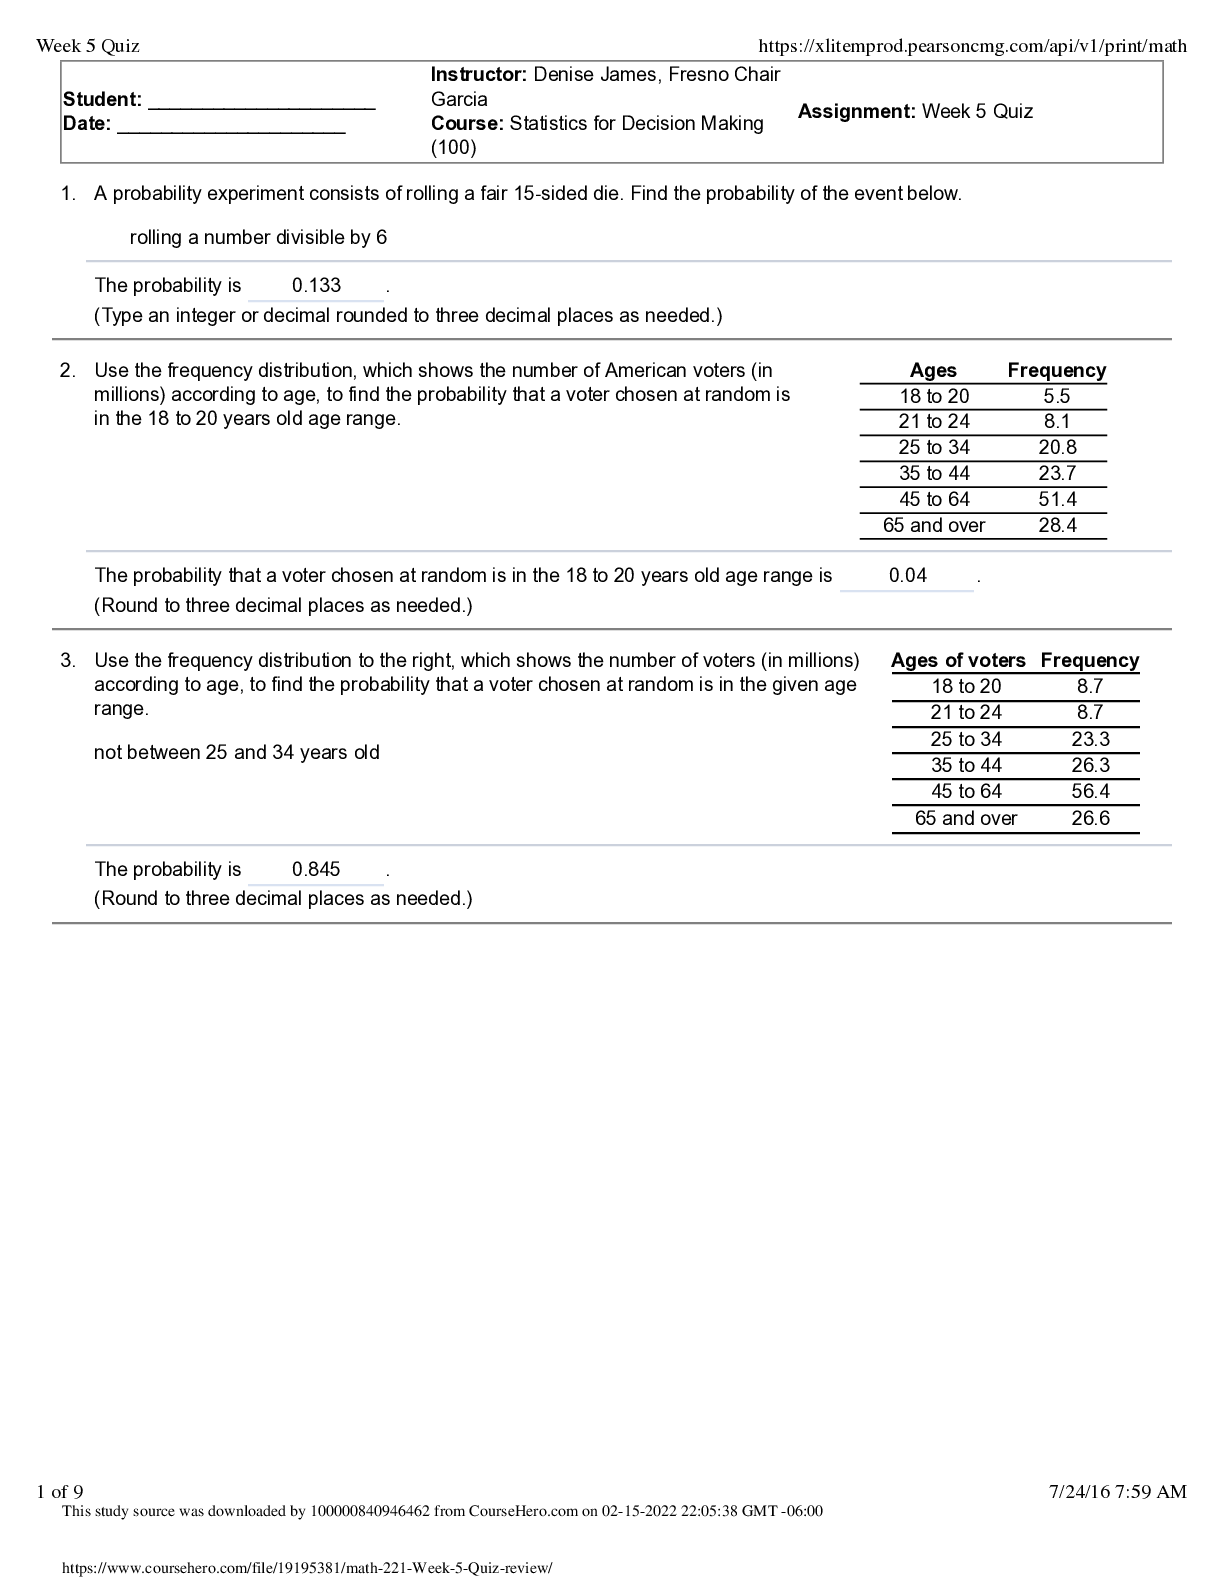
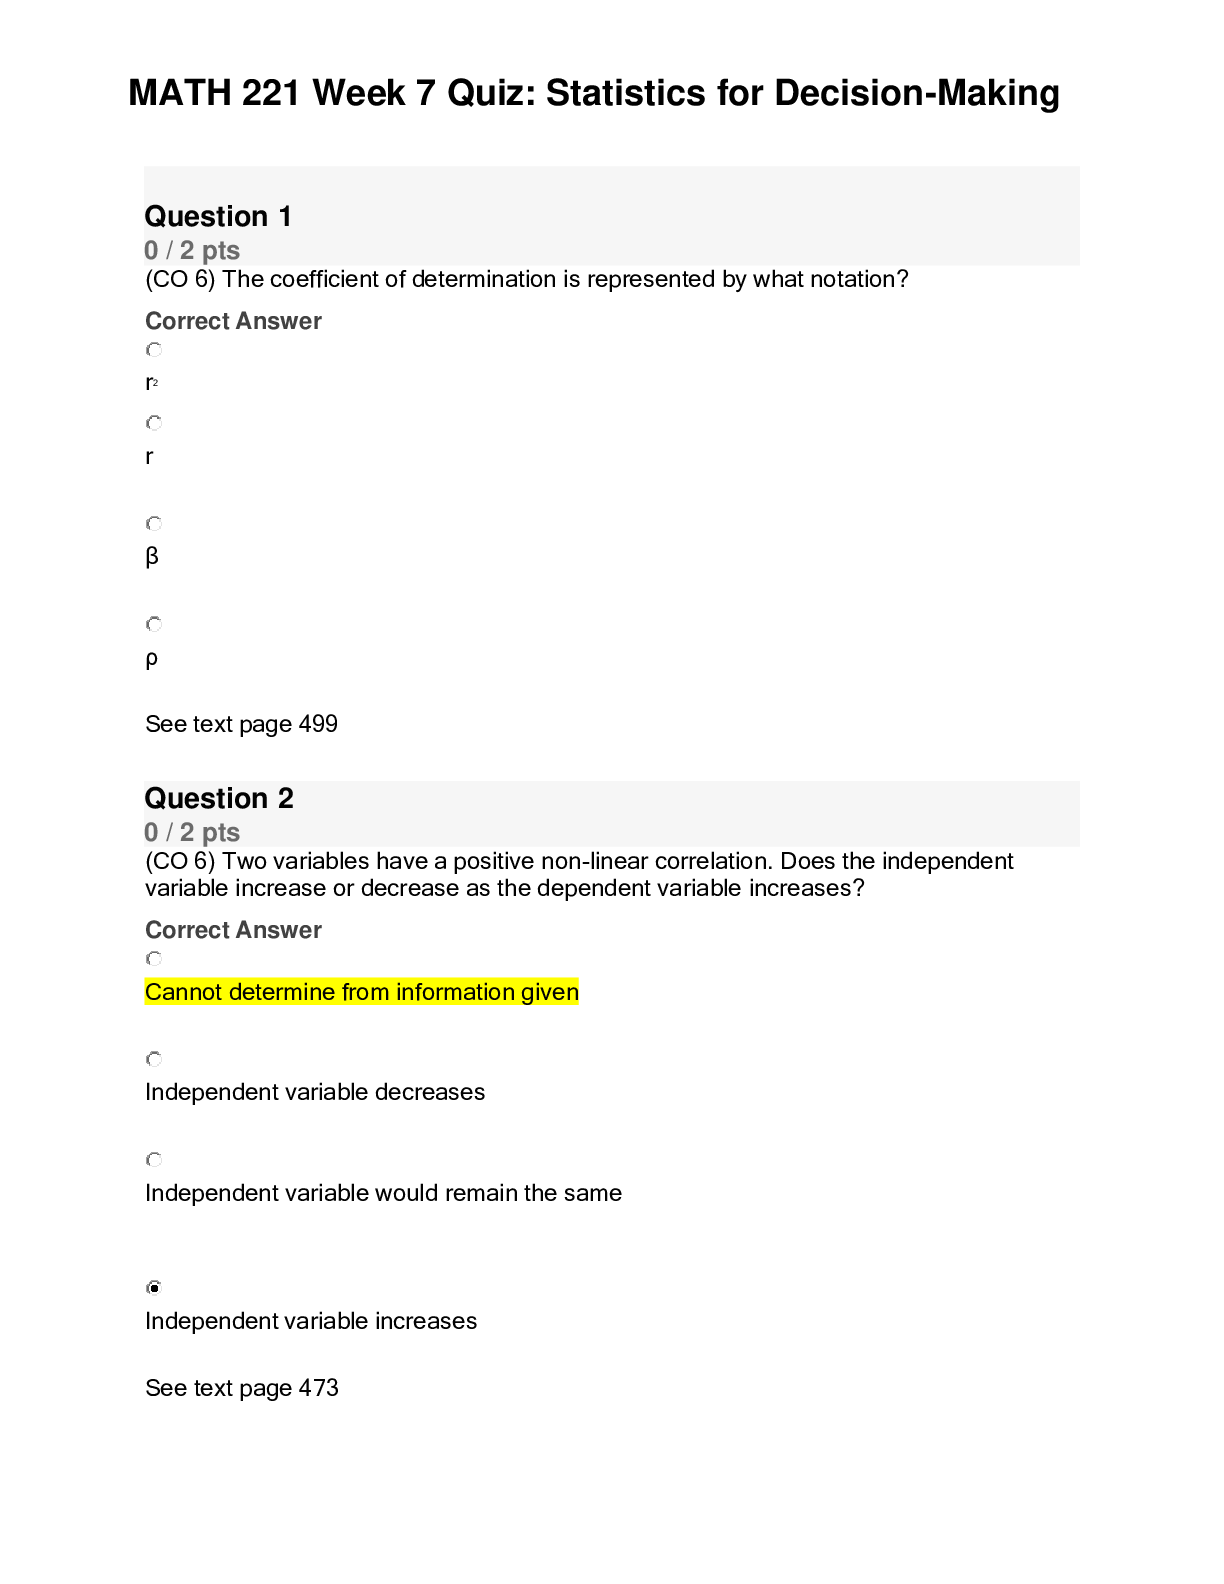
1. Create a pie chart for the variable Car Color: Select the column with the Car variable, including the title of Car Color. Click on Insert, and then Recommended Charts. It should show a clustered c
...
Creating Graphs
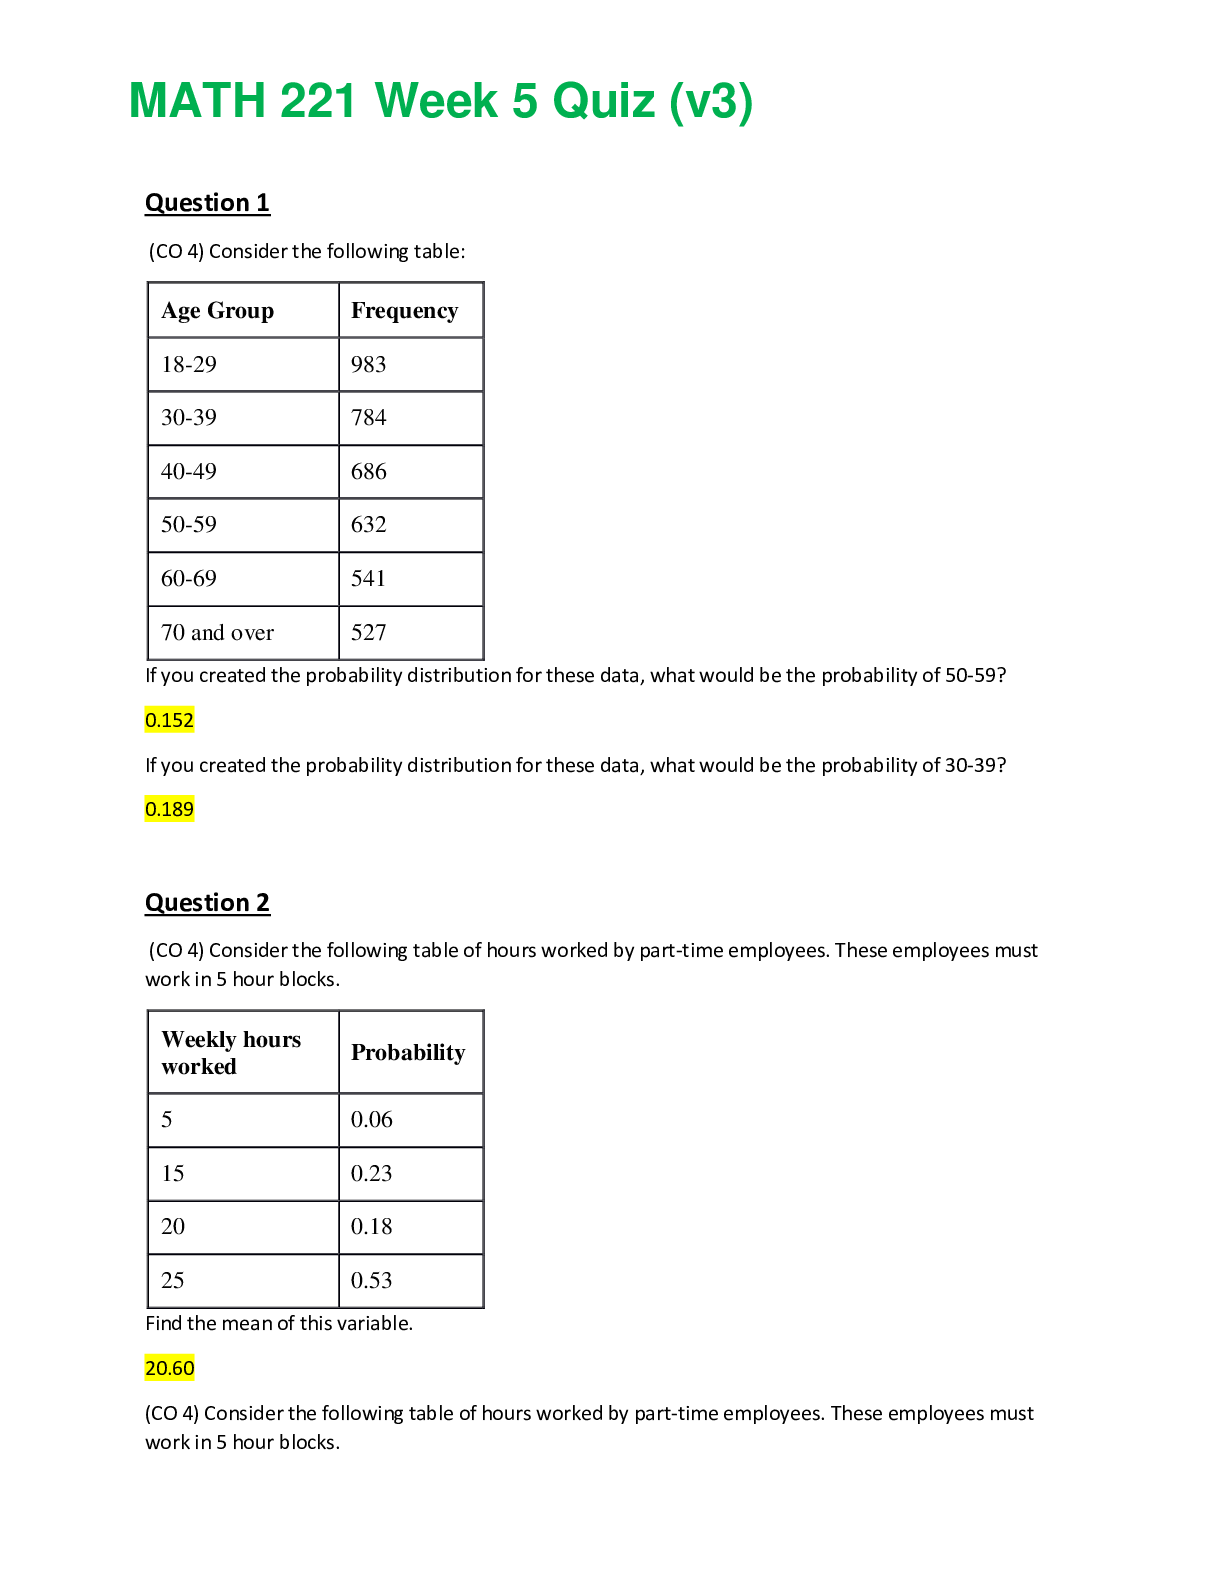
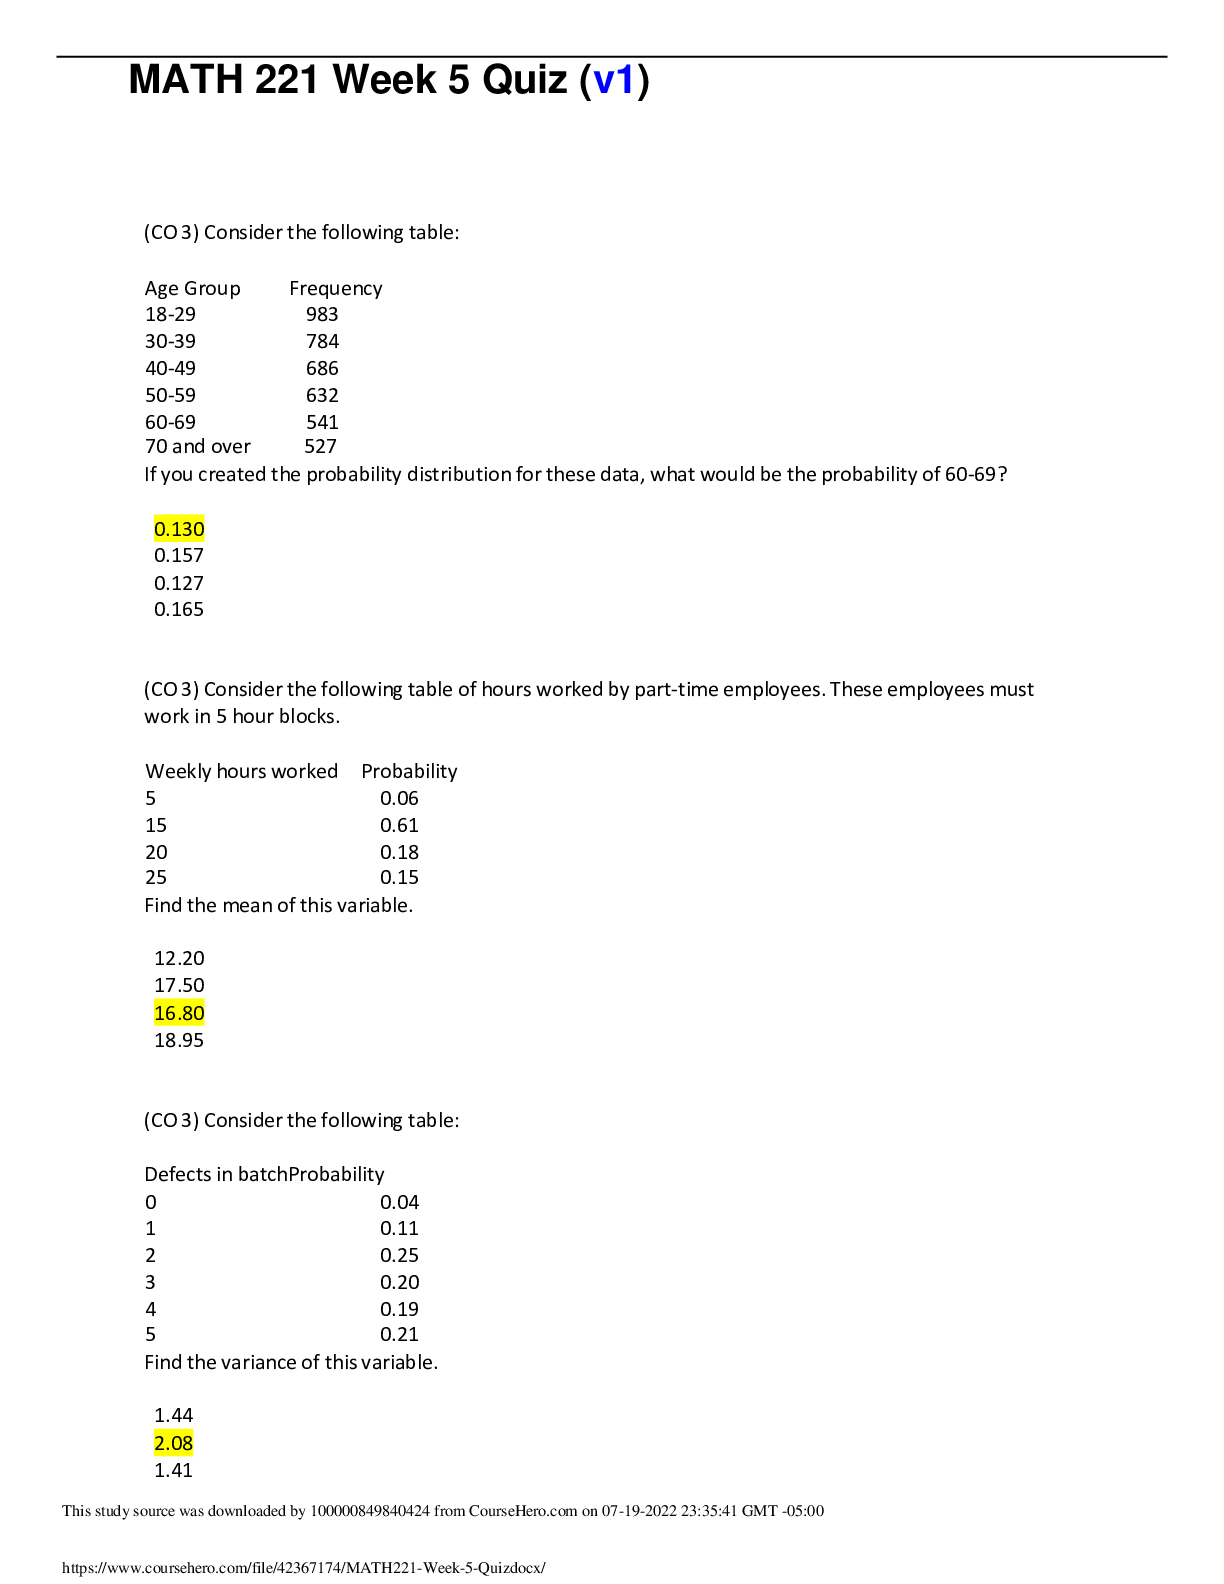
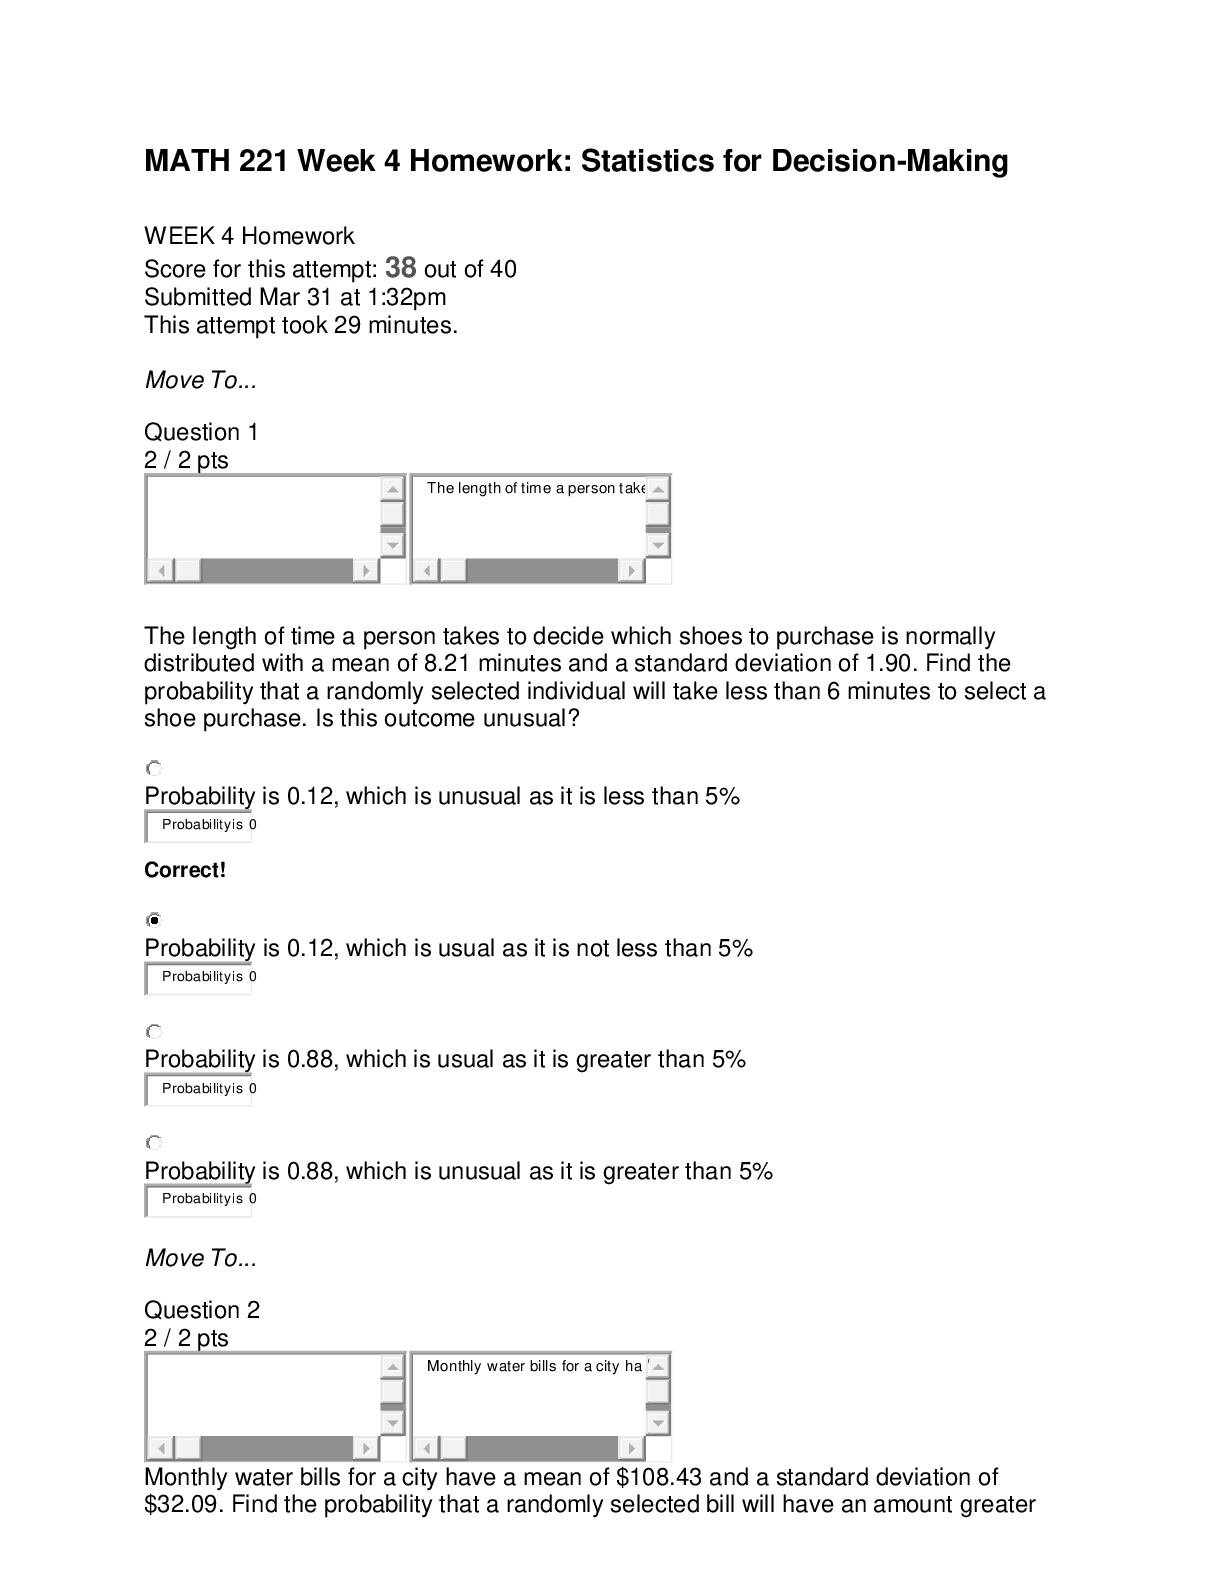
1. Create a pie chart for the variable Car Color: Select the column with the Car variable, including the title of Car Color. Click on Insert, and then Recommended Charts. It should show a clustered column and click OK. Once the chart is shown, right click on the chart (main area) and select Change Chart Type. Select Pie and OK. Click on the pie slices, right click Add Data Labels, and select Add Data Callouts. Add an appropriate title. Copy and paste the chart here. (4 points)
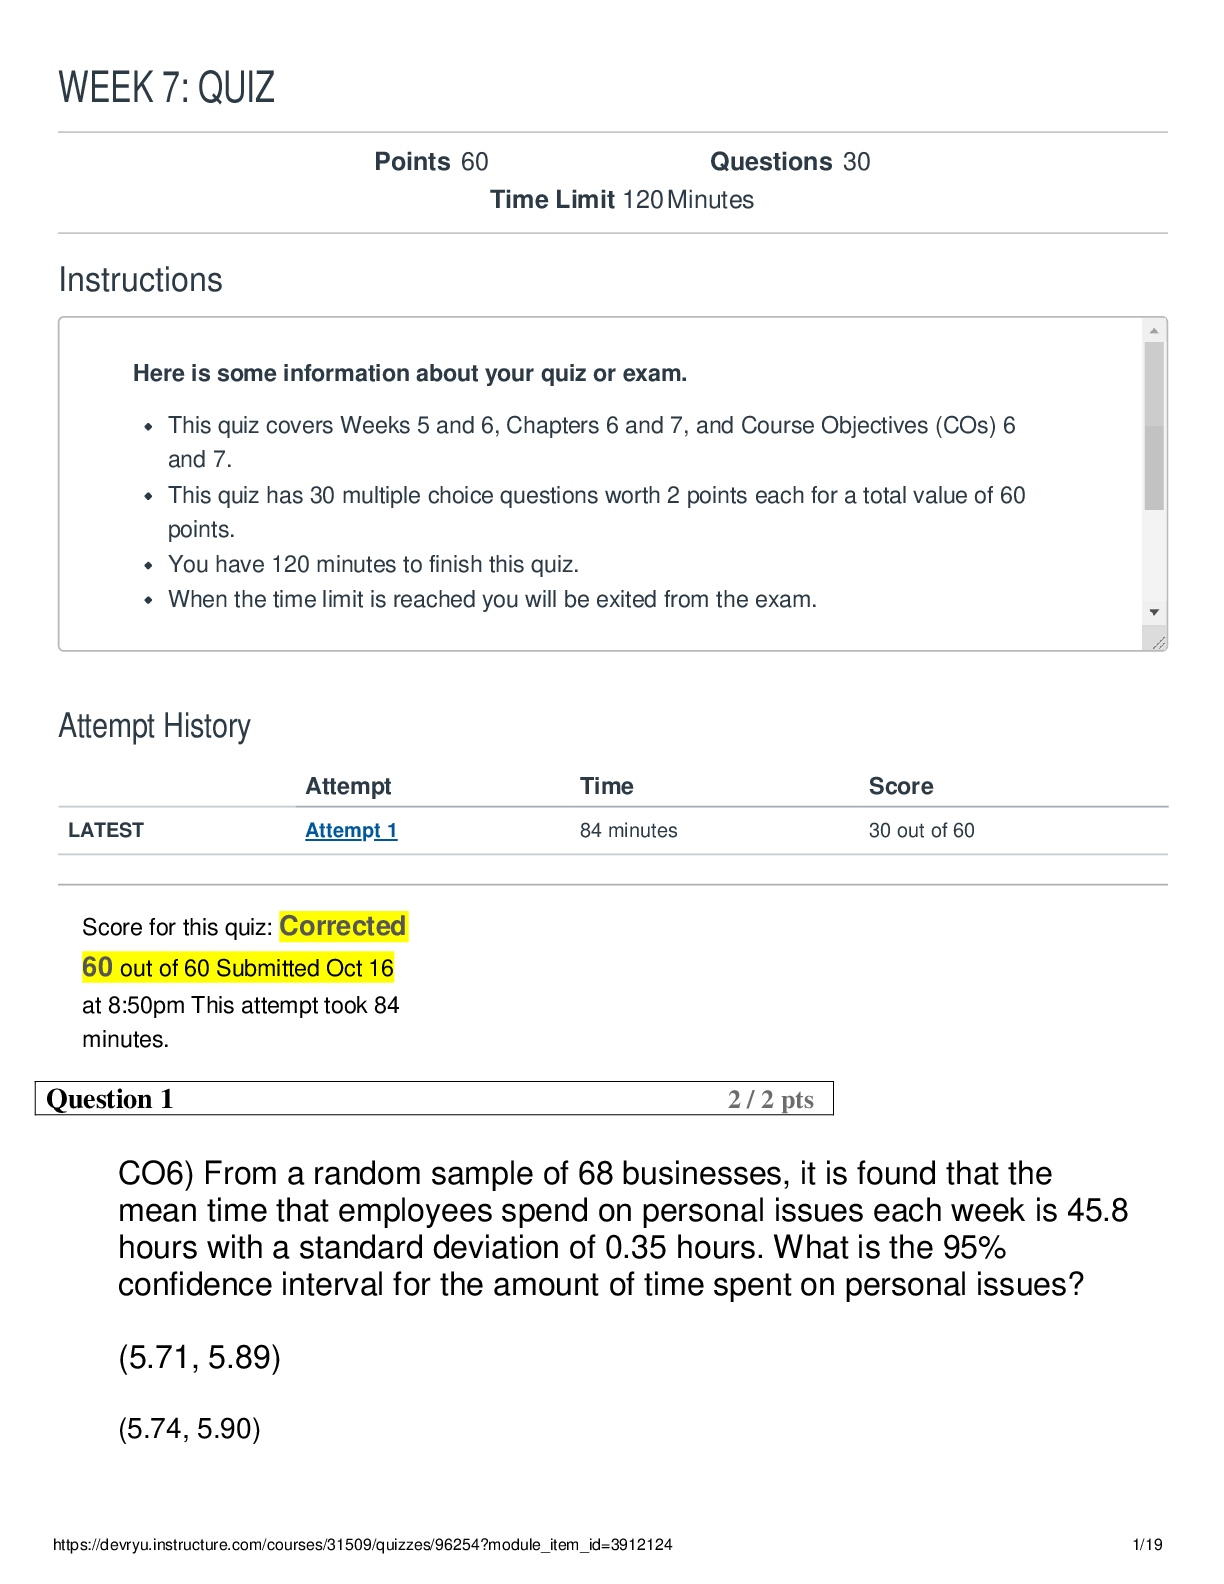
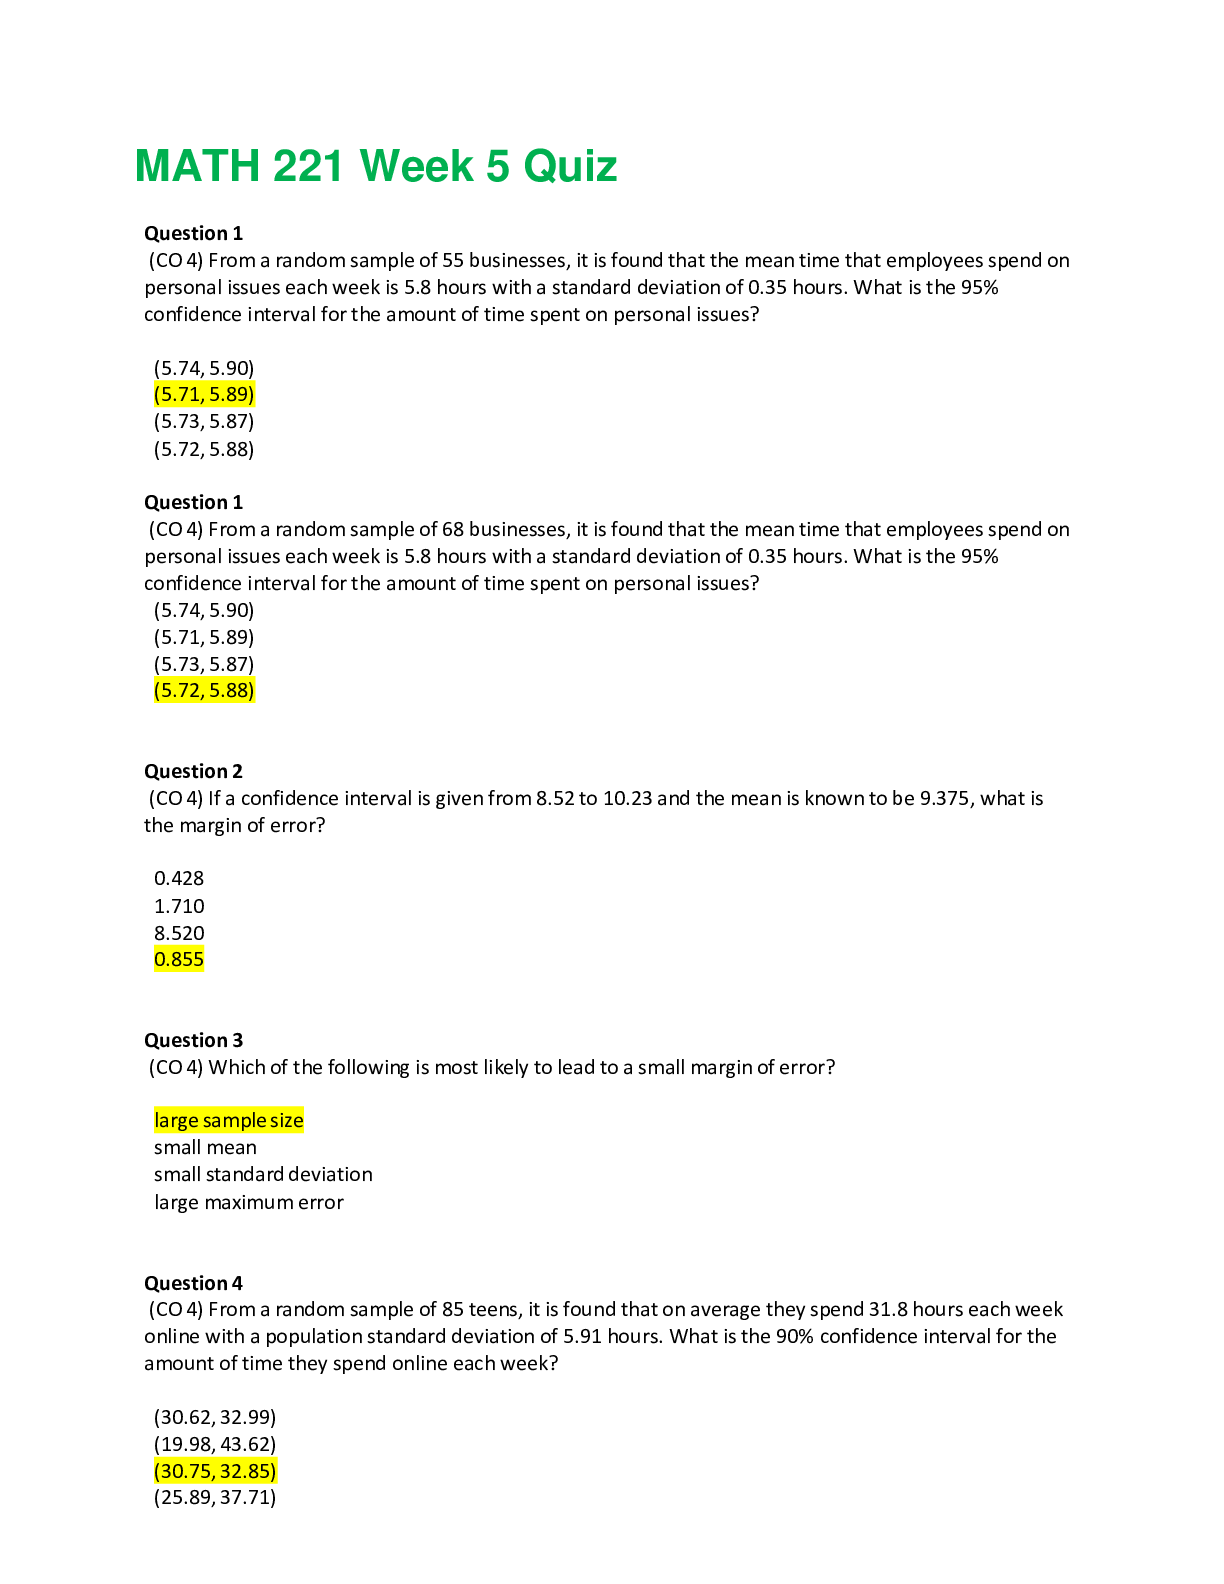
2. Create a histogram for the variable Height. You need to create a frequency distribution for the data by hand. Use 5 classes, find the class width, and then create the classes. Once you have the classes, count how many data points fall within each class. It may be helpful to sort the data based on the Height variable first. Create a new worksheet in Excel by clicking on the + along the bottom of the screen and type in the categories and the frequency for each category. Then select the frequency table, click on Insert, then Recommended Charts and choose the column chart shown and click OK. Right click on one of the bars and select Format Data Series. In the pop up box, change the Gap Width to 0. Add an appropriate title and axis label. Copy and paste the graph here. (4 points)
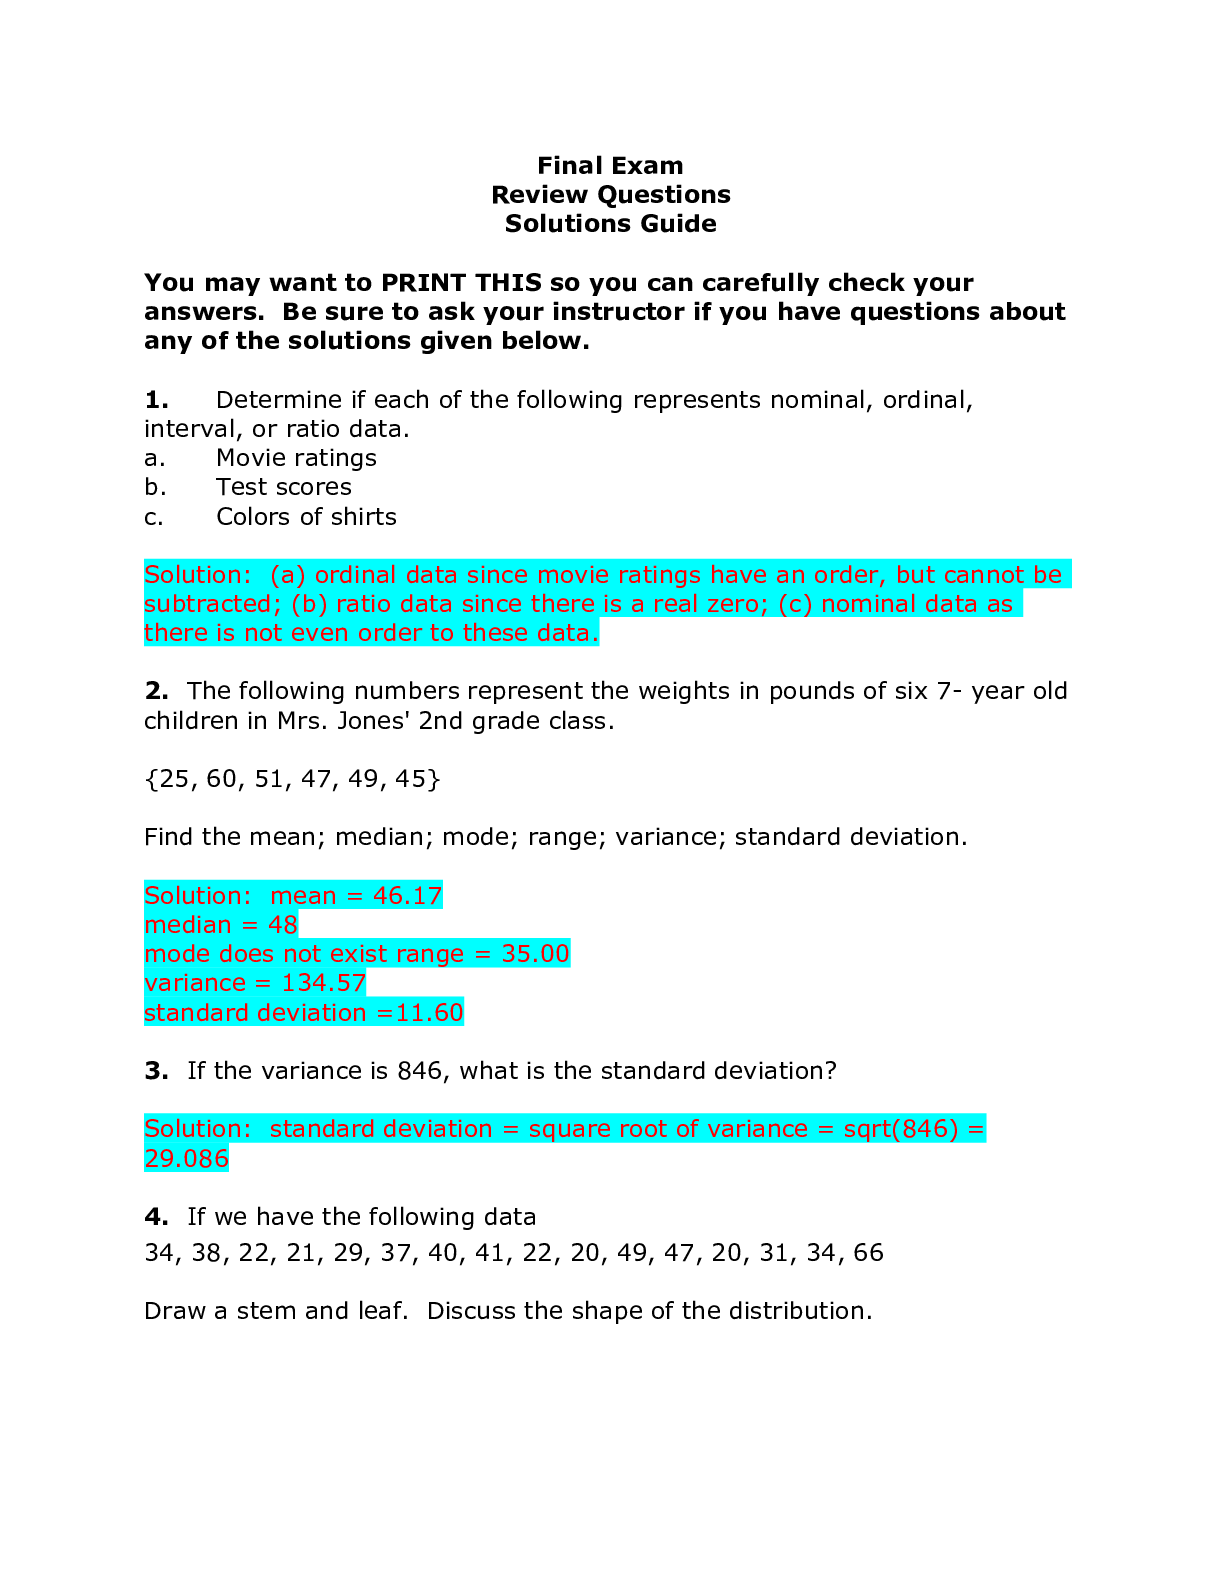
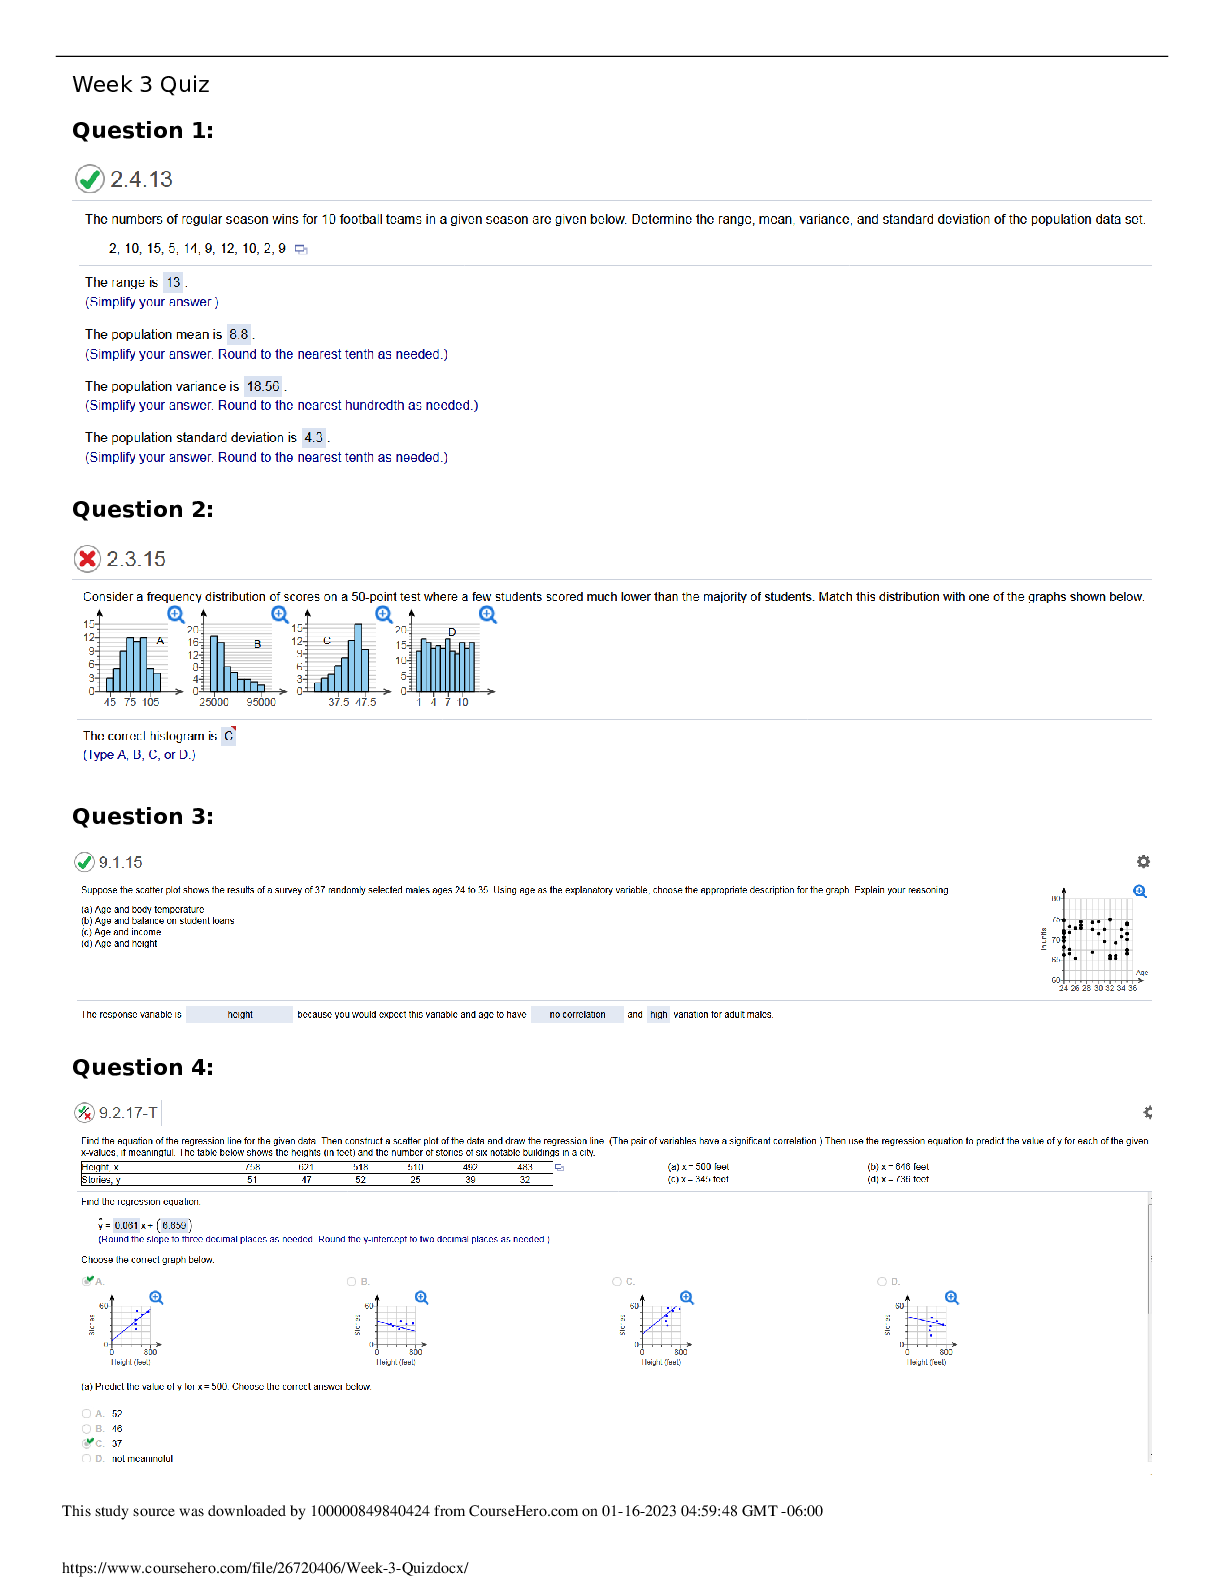
3. Type up a stem-and-leaf plot chart in the box below for the variable Money, with a space between the stems and the group of leaves in each line. Use the tens value as the stem and the ones value for the leaves. It may be helpful to sort the data based on the Money variable first.
An example of a stem-and-leaf plot would look like this:
0 4 5 6 9 3
1 5 6 3 6
2 9 2
The stem-and-leaf plot shown above would be for data 4, 5, 6, 9, 3, 15, 16, 13, 16, 29, and 22. (4 points)
Calculating Descriptive Statistics
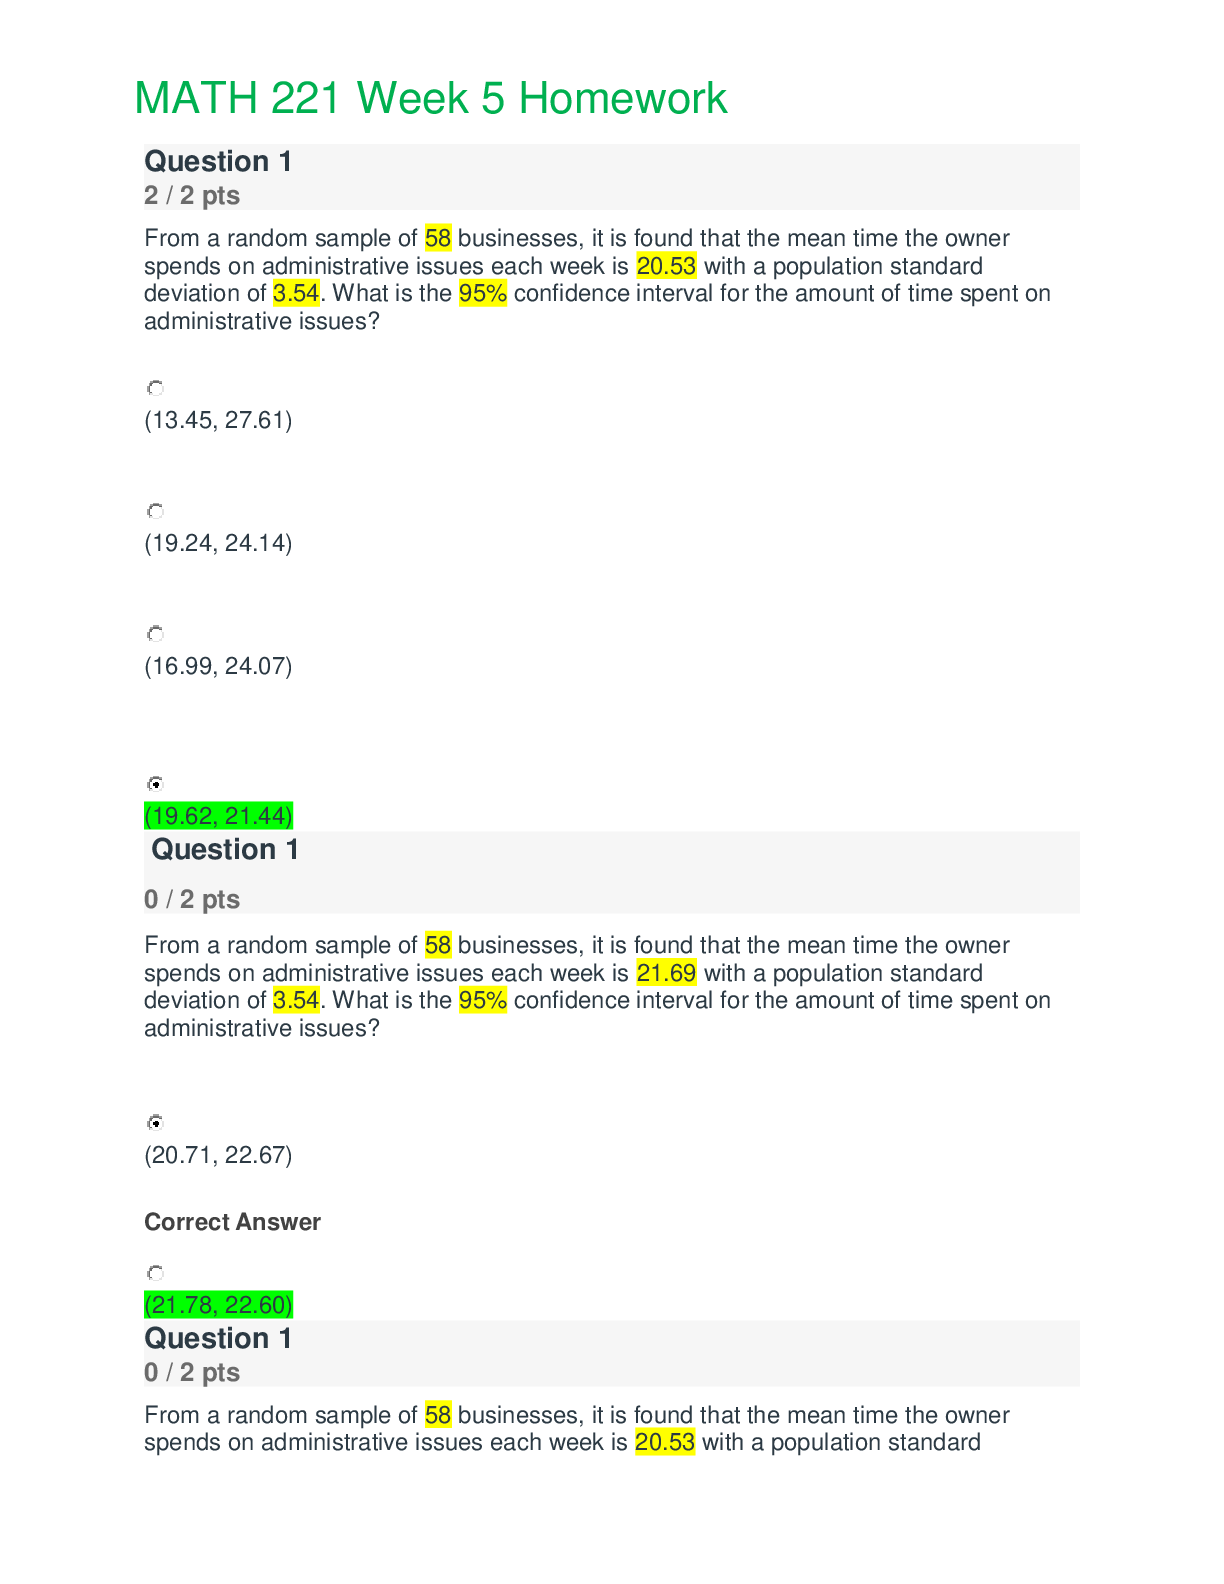
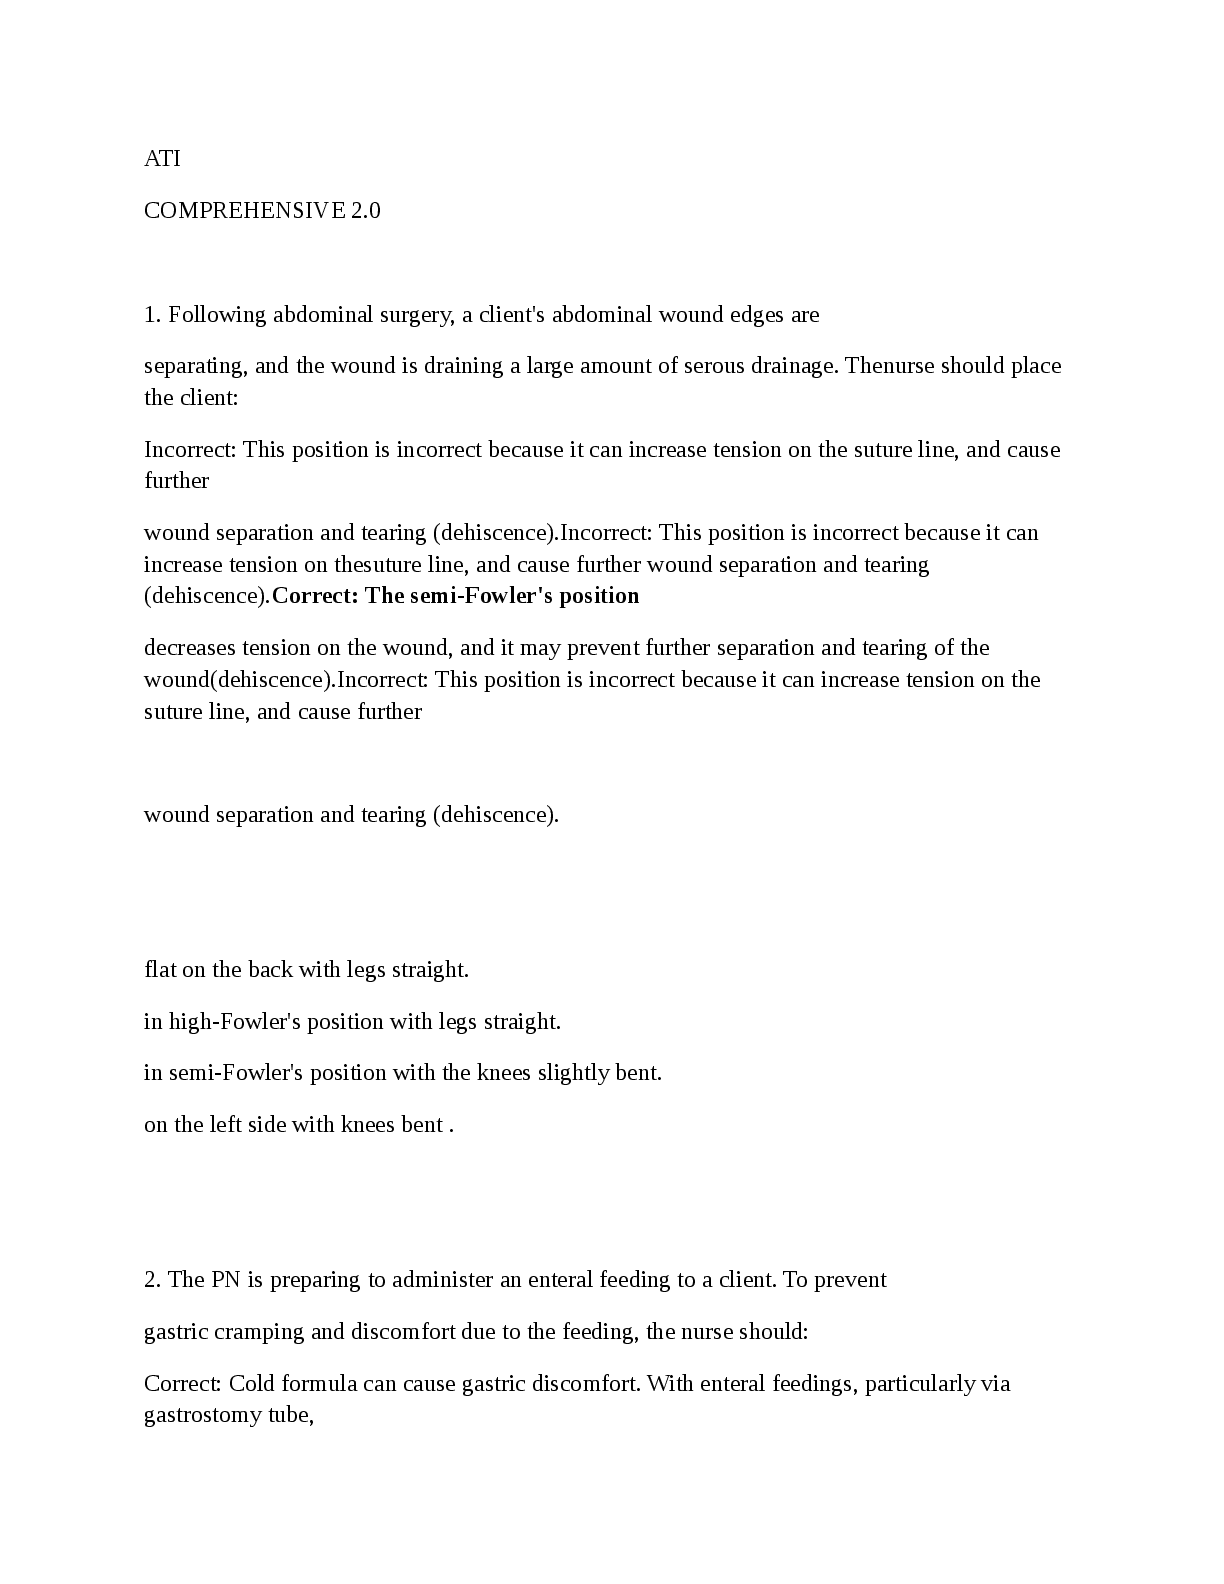
4. Calculate descriptive statistics for the variable Height by Gender. Click on Insert and then Pivot Table. Click in the top box and select all the data (including labels) from Height through Gender. Also click on “new worksheet” and then OK. On the right of the new sheet, click on Height and Gender, making sure that Gender is in the Rows box and Height is in the Values box. Click on the down arrow next to Height in the Values box and select Value Field Settings. In the pop up box, click Average then OK. Type in the averages below. Then click on the down arrow next to Height in the Values box again and select Value Field Settings. In the pop up box, click on StdDev then OK. Type the standard deviations below. (3 points)
Short Answer Writing Assignment
All answers should be complete sentences.
5. What is the most common color of car for students who participated in this survey? Explain how you arrived at your answer. (5 points)
The most common color of the car for students who participated in this survey is red. 11/35 students has a red car based off the numbers entered in excel.
6. What is seen in the histogram created for the heights of students in this class (include the shape)? Explain your answer. (5 points)
This histogram shape is skewed right. It shows that the most students are under the height of 71 inches. It is more bimodal with those two peaks. It could represent the different distributions of height between males and females.
7. What is seen in the stem and leaf plot for the money variable (include the shape)? Explain your answer. (5 points) 4 point
8. Compare the mean for the heights of males and the mean for the heights of females in these data. Compare the values and explain what can be concluded based on the numbers. (5 points)
9. Compare the standard deviation for the heights of males and the standard deviation for the heights of females in the class. Compare the values and explain what can be concluded based on the numbers. (5 points)
10. Using the empirical rule, 95% of female heights should be between what two values? Either show work or explain how your answer was calculated. (5 points)
11. Using the empirical rule, 68% of male heights should be between what two values? Either show work or explain how your answer was calculated. (5 points)
Code Sheet
Do NOT answer these questions.
The Code Sheet just lists the variables name and the question used by the researchers on the survey instrument that produced the data that are included in the data file. This is just information. The first question for the lab is after the code sheet.
Variable Name Question
Drive Question 1 – How long does it take you to drive to the school on average (to the nearest minute)?
State Question 2 – What state/country were you born?
Temp Question 3 – What is the temperature outside right now?
Rank Question 4 – Rank all of the courses you are currently taking. The class you look most forward to taking will be ranked one, next two, and so on. What is the rank assigned to this class?
Height Question 5 – What is your height to the nearest inch?
Shoe Question 6 – What is your shoe size?
Sleep Question 7 – How many hours did you sleep last night?
Gender Question 8 – What is your gender?
Race Question 9 – What is your race?
Car Question 10 – What color of car do you drive?
TV Question 11 – How long (on average) do you spend a day watching TV?
Money Question 12 – How much money do you have with you right now?
Coin Question 13 – Flip a coin 10 times. How many times did you get tails?
Die1 Question 14 – Roll a six-sided die 10 times and record the results.
Die2
Die3
Die4
Die5
Die6
Die7
Die8
Die9
Die10
[Show More]
.png)