OCEAN 100 NAME: Cierra Watkins, Karim Arafah, Rowan
Mathews ,
LAB 7 INVESTIGATION: TIDES: ROUND AND ROUND WE GO SECTION:
COMPARATIVE TIDAL PATTERN ALONG THE NORTH ATLANTIC AND NORTHEAST PAC
...
OCEAN 100 NAME: Cierra Watkins, Karim Arafah, Rowan
Mathews ,
LAB 7 INVESTIGATION: TIDES: ROUND AND ROUND WE GO SECTION:
COMPARATIVE TIDAL PATTERN ALONG THE NORTH ATLANTIC AND NORTHEAST PACIFIC
Comparing tide calendars or charts from different regions will quickly confirm that tides vary in their magnitude and
timing from place to place. This observation makes intuitive sense as these phenomena are driven by gravitational attractions
among the Earth, Moon, and Sun while the Earth spins on its axis (Figure 2). These generating forces have been combined with the
effects of Coriolis deflection, ocean depths, and continent locations to produce the dynamic model of the tides. This dynamic
model has been refined to such a degree that tidal patterns can now be predicted decades into the future with a high degree of
precision and accuracy.
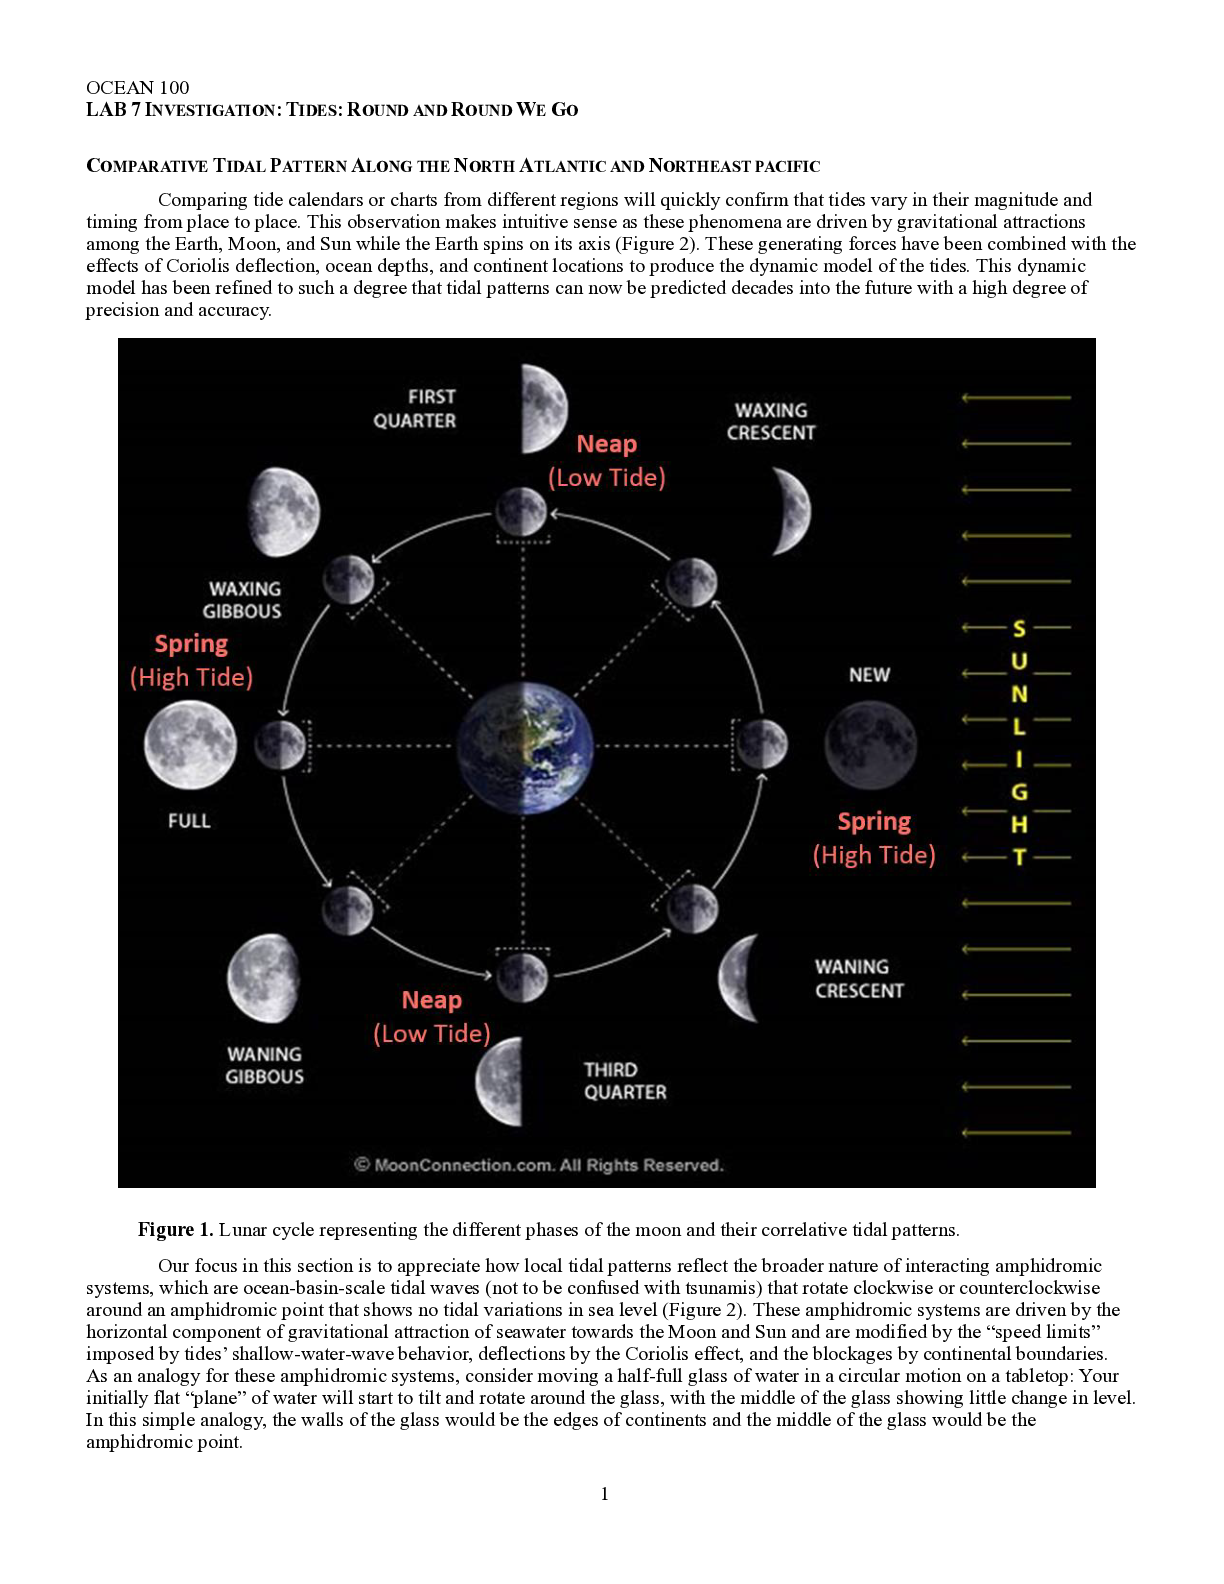
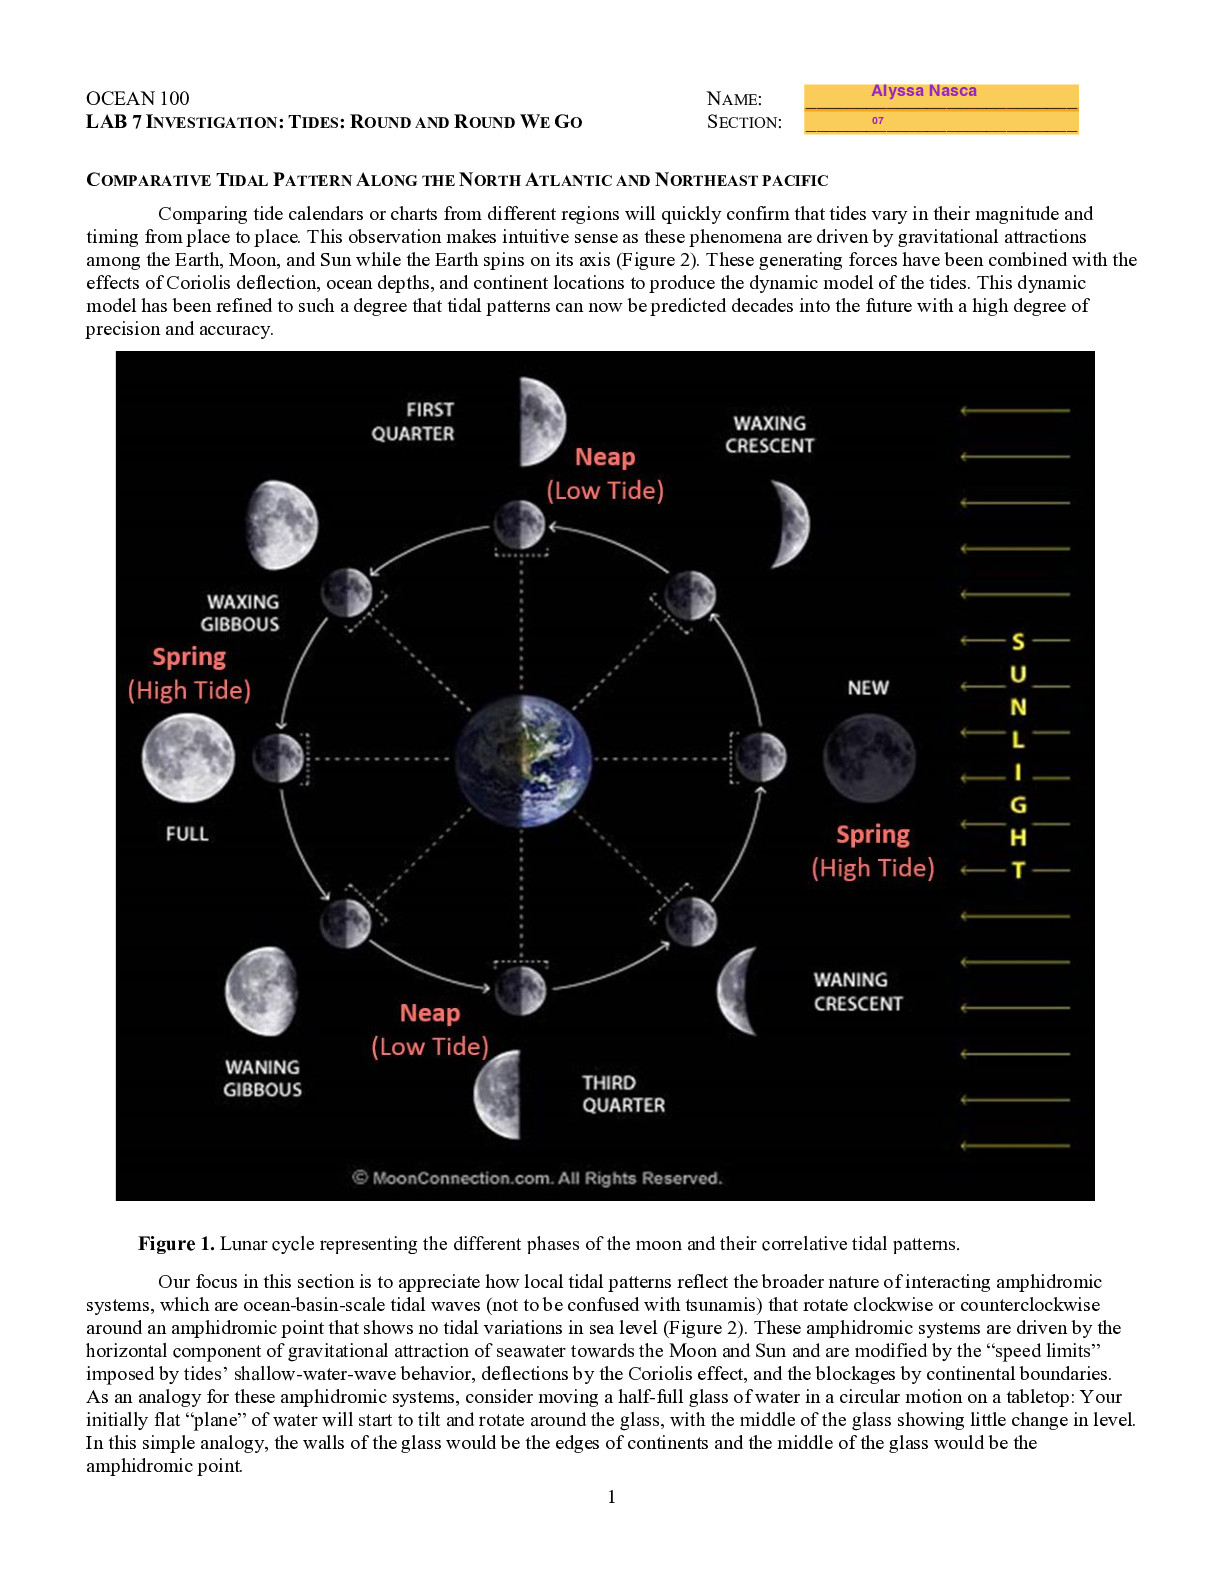
Figure 1. Lunar cycle representing the different phases of the moon and their correlative tidal patterns.
Our focus in this section is to appreciate how local tidal patterns reflect the broader nature of interacting amphidromic
systems, which are ocean-basin-scale tidal waves (not to be confused with tsunamis) that rotate clockwise or counterclockwise
around an amphidromic point that shows no tidal variations in sea level (Figure 2). These amphidromic systems are driven by the
horizontal component of gravitational attraction of seawater towards the Moon and Sun and are modified by the “speed limits”
imposed by tides’ shallow-water-wave behavior, deflections by the Coriolis effect, and the blockages by continental boundaries.
As an analogy for these amphidromic systems, consider moving a half-full glass of water in a circular motion on a tabletop: Your
initially flat “plane” of water will start to tilt and rotate around the glass, with the middle of the glass showing little change in level.
In this simple analogy, the walls of the glass would be the edges of continents and the middle of the glass would be theamphidromic point.Figure 2. Conceptual model for tidal variations within an amphidromic system.
Over fifteen major amphidromic systems exist in the global ocean and are shown in Figure 4. The amphidromic point for
each system is marked by the convergence of twelve co-tidal lines, with each co-tidal line being where the crest of the given tidal
wave would be found at approximately one-hour intervals over a tidal cycle – note that this crest is rarely a straight line over the
ocean surface! Recalling our water glass analogy, if high tide (i.e., crest of the rotating tidal wave) is passing through one of the
co-tidal lines, then low tide (i.e., trough of the rotating tidal wave) will be passing the opposite co-tidal line. The figure also shows
by color-coding the typical open-ocean tidal ranges (i.e., height from high to low tide or, in wave-speak, from crest to trough) that
result from these amphidromic systems. Note that coastal tidal ranges are often greatly amplified compared to these open-ocean
tidal ranges.
The constructive and destructive interference of tidal waves from difference amphidromic systems will produce local tidal
regimes classified as diurnal (i.e., one high and one low per day), semidiurnal (i.e., two nearly-equal highs and two nearly-equal
lows per day), or mixed semidiurnal (i.e., two unequal highs and two unequal lows per day). The global distribution of these three
tidal regimes is shown in Figure 5. Note that the exact dividing point between semidiurnal and mixed semidiurnal regimes is
somewhat arbitrary and that a given location may vary between clearly se
[Show More]