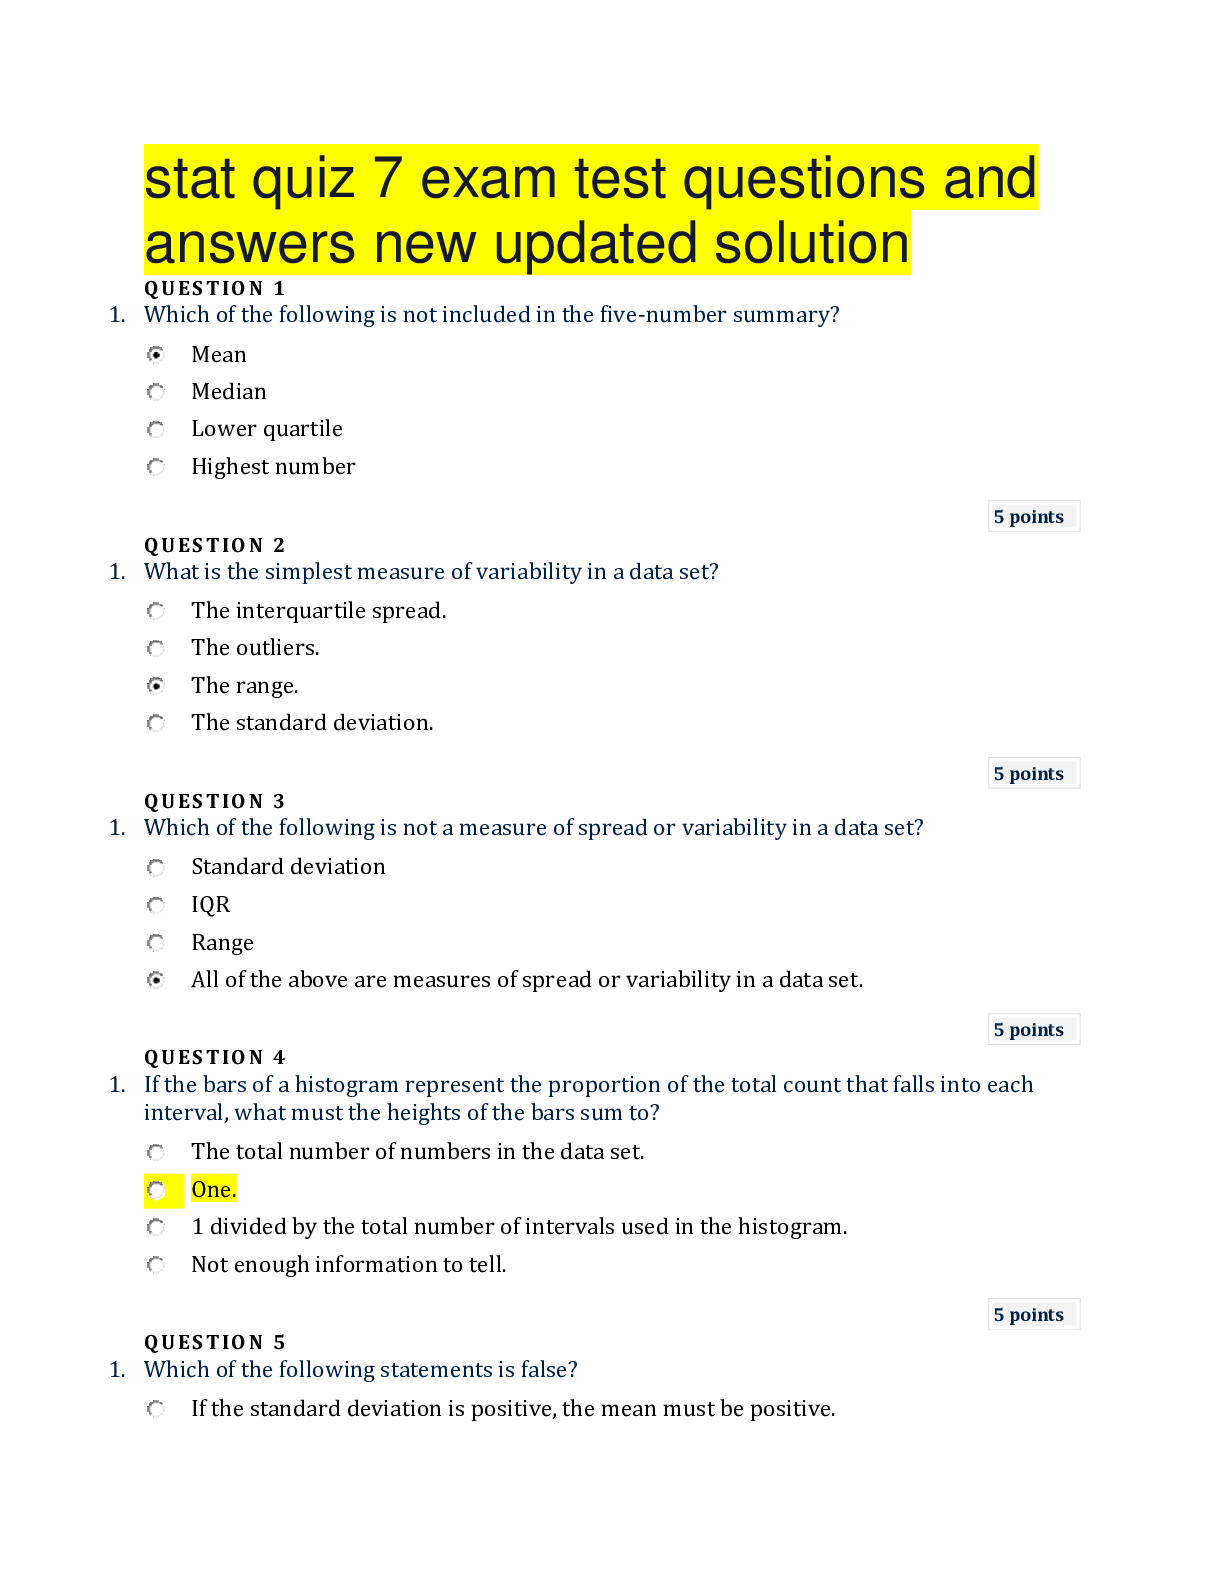
stat quiz 7 exam test questions and answers new updated solution
$ 12.5

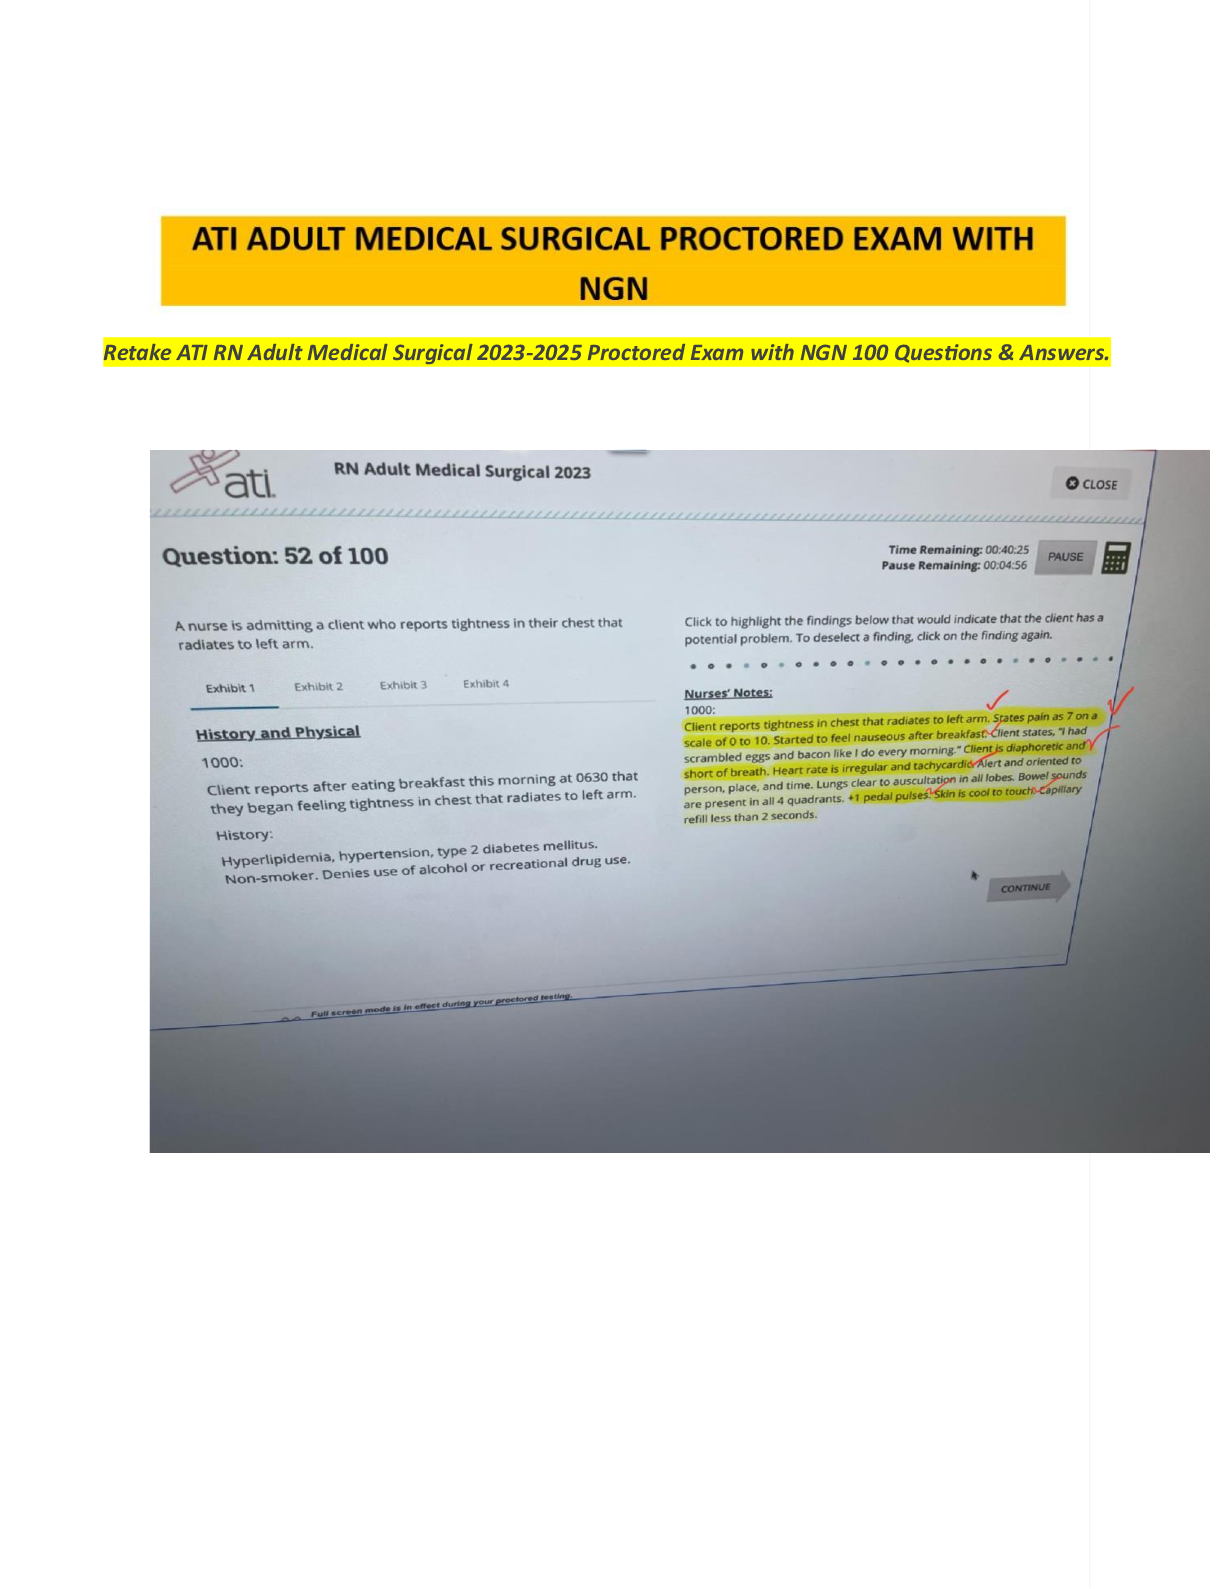
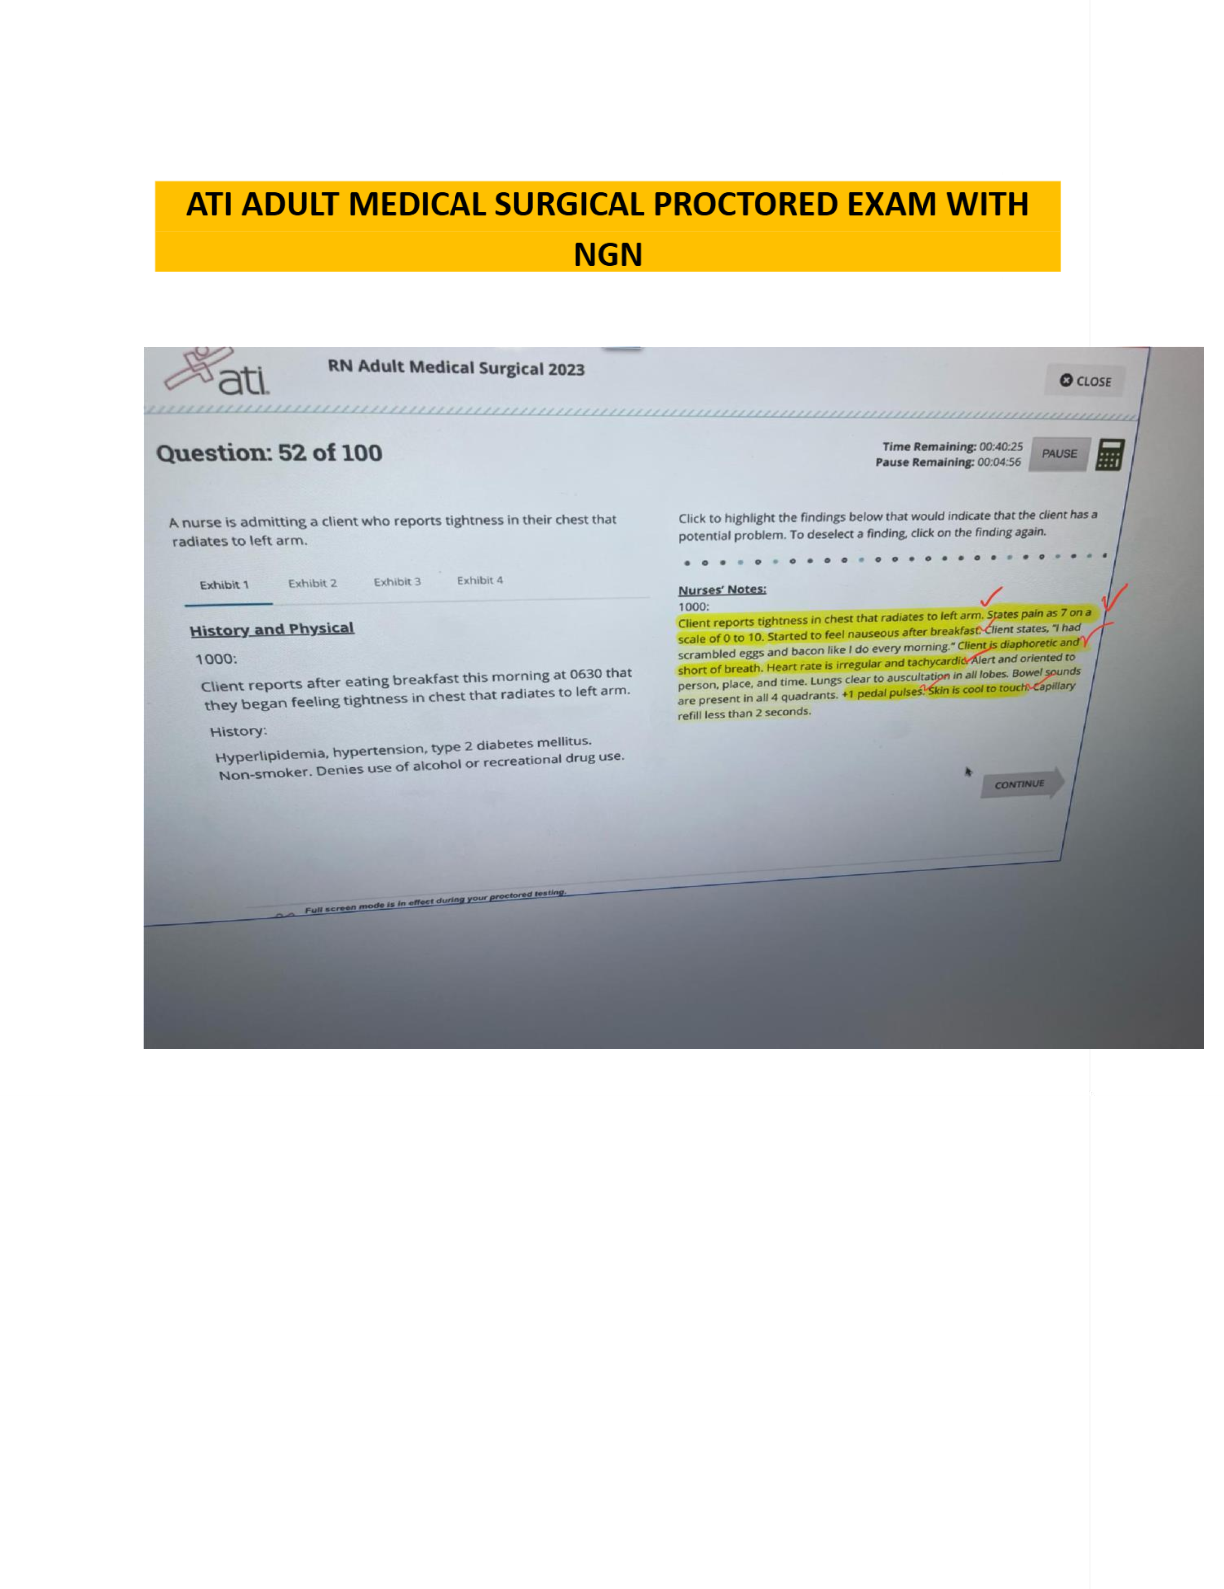
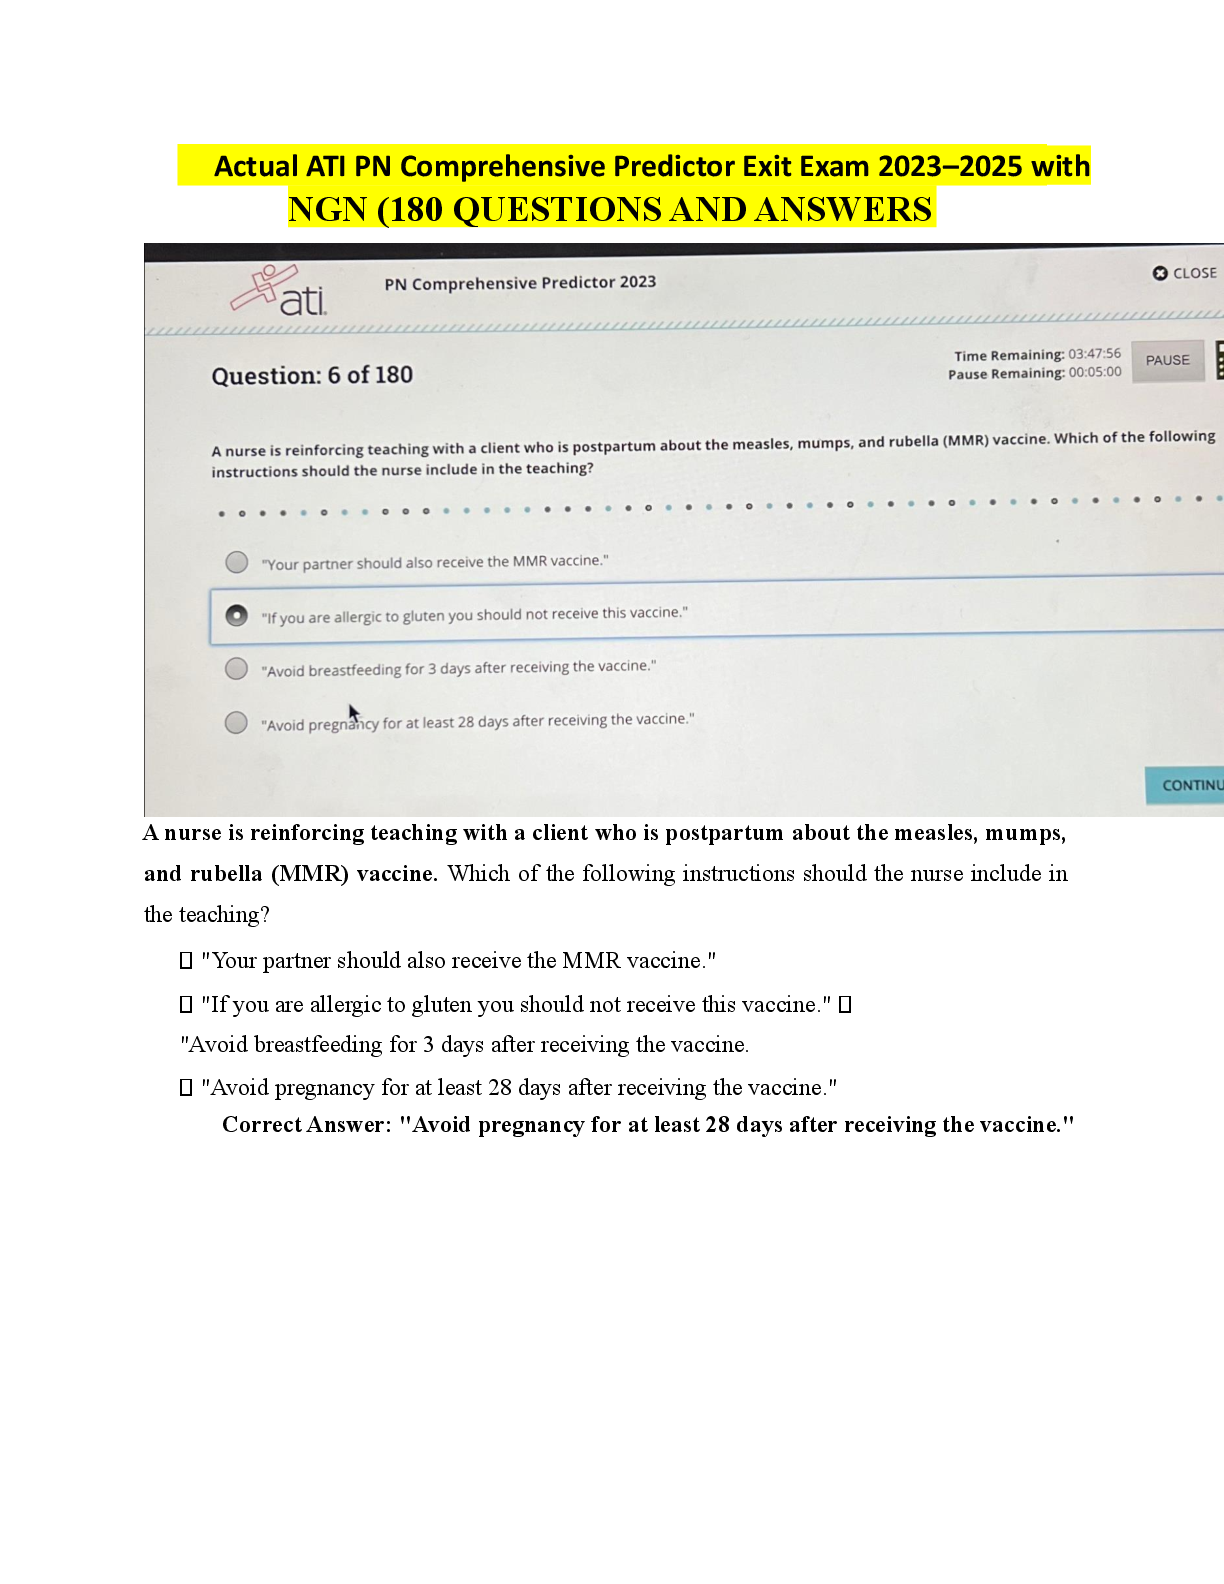
ATI Comprehensive Predictor
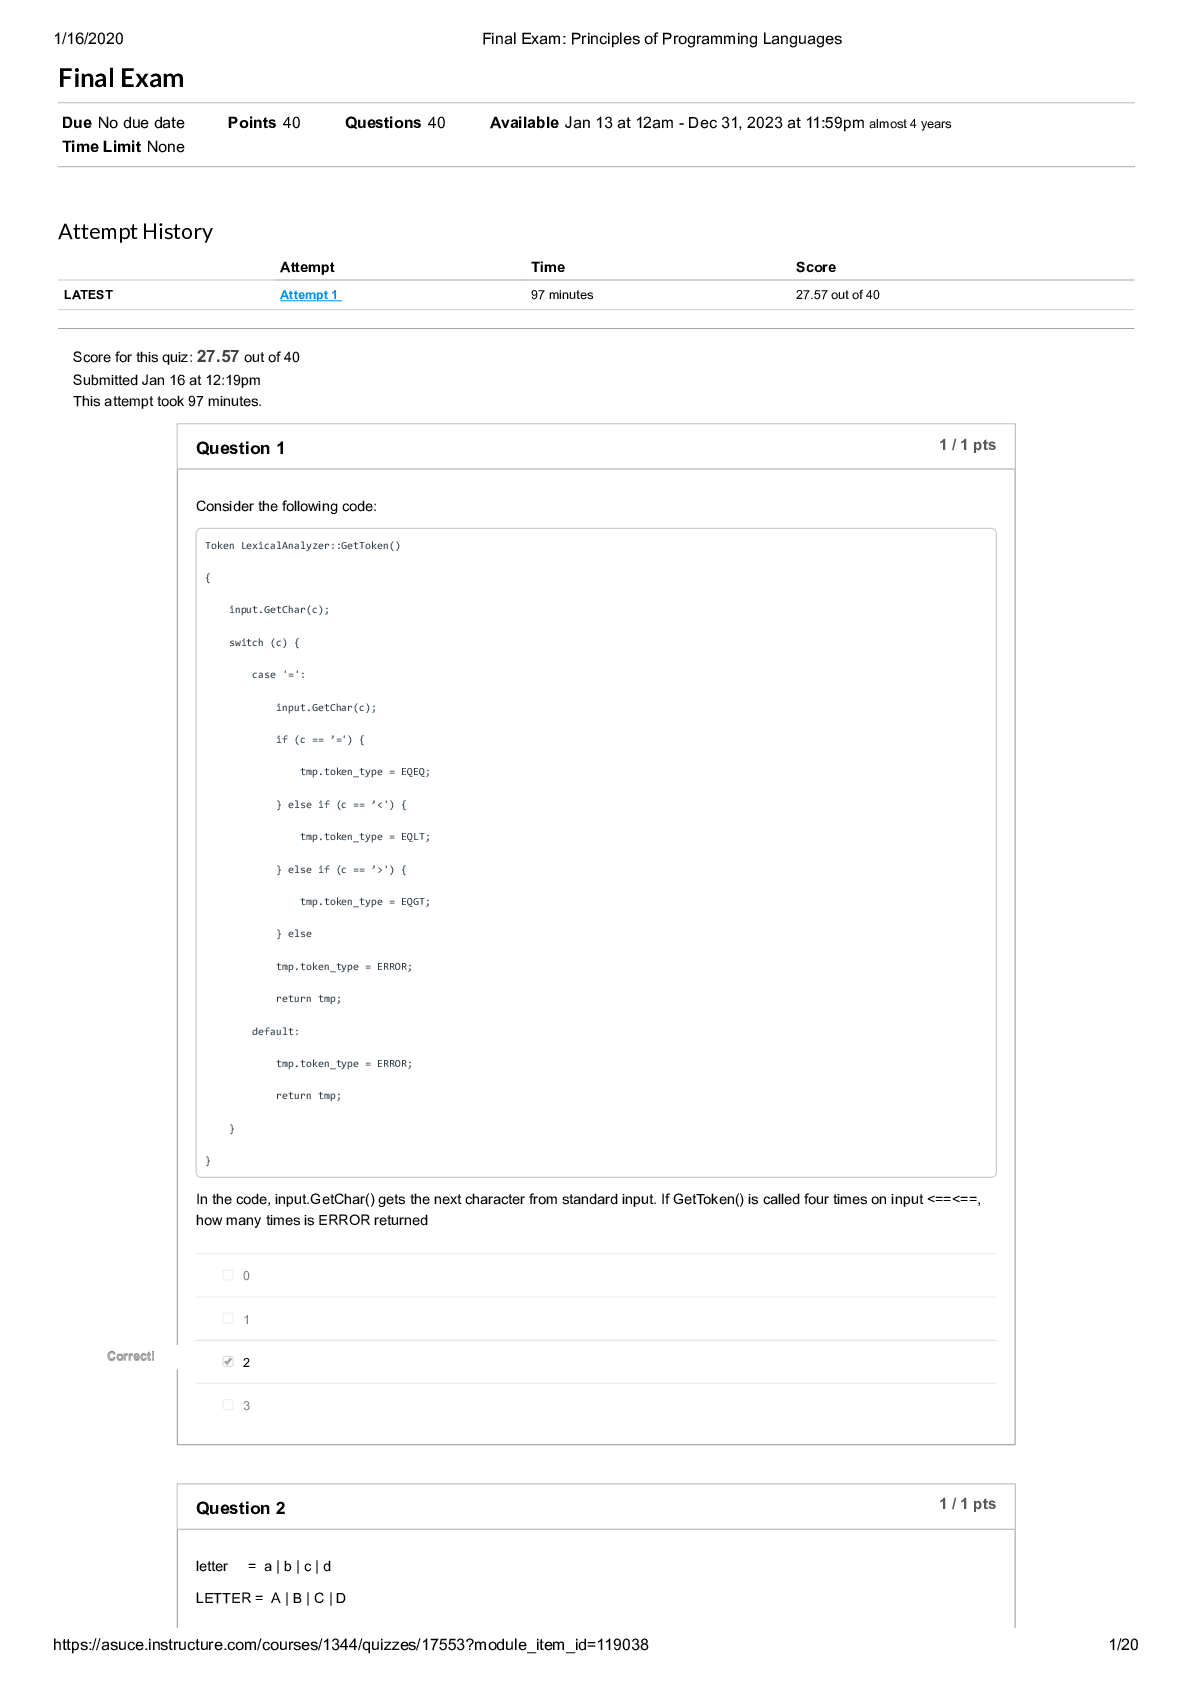
Information Technology > EXAM > University of California, Los Angeles - COMPUTER 6501XMidterm Quiz 2 _ ISYE6501x Courseware _ edX (All)
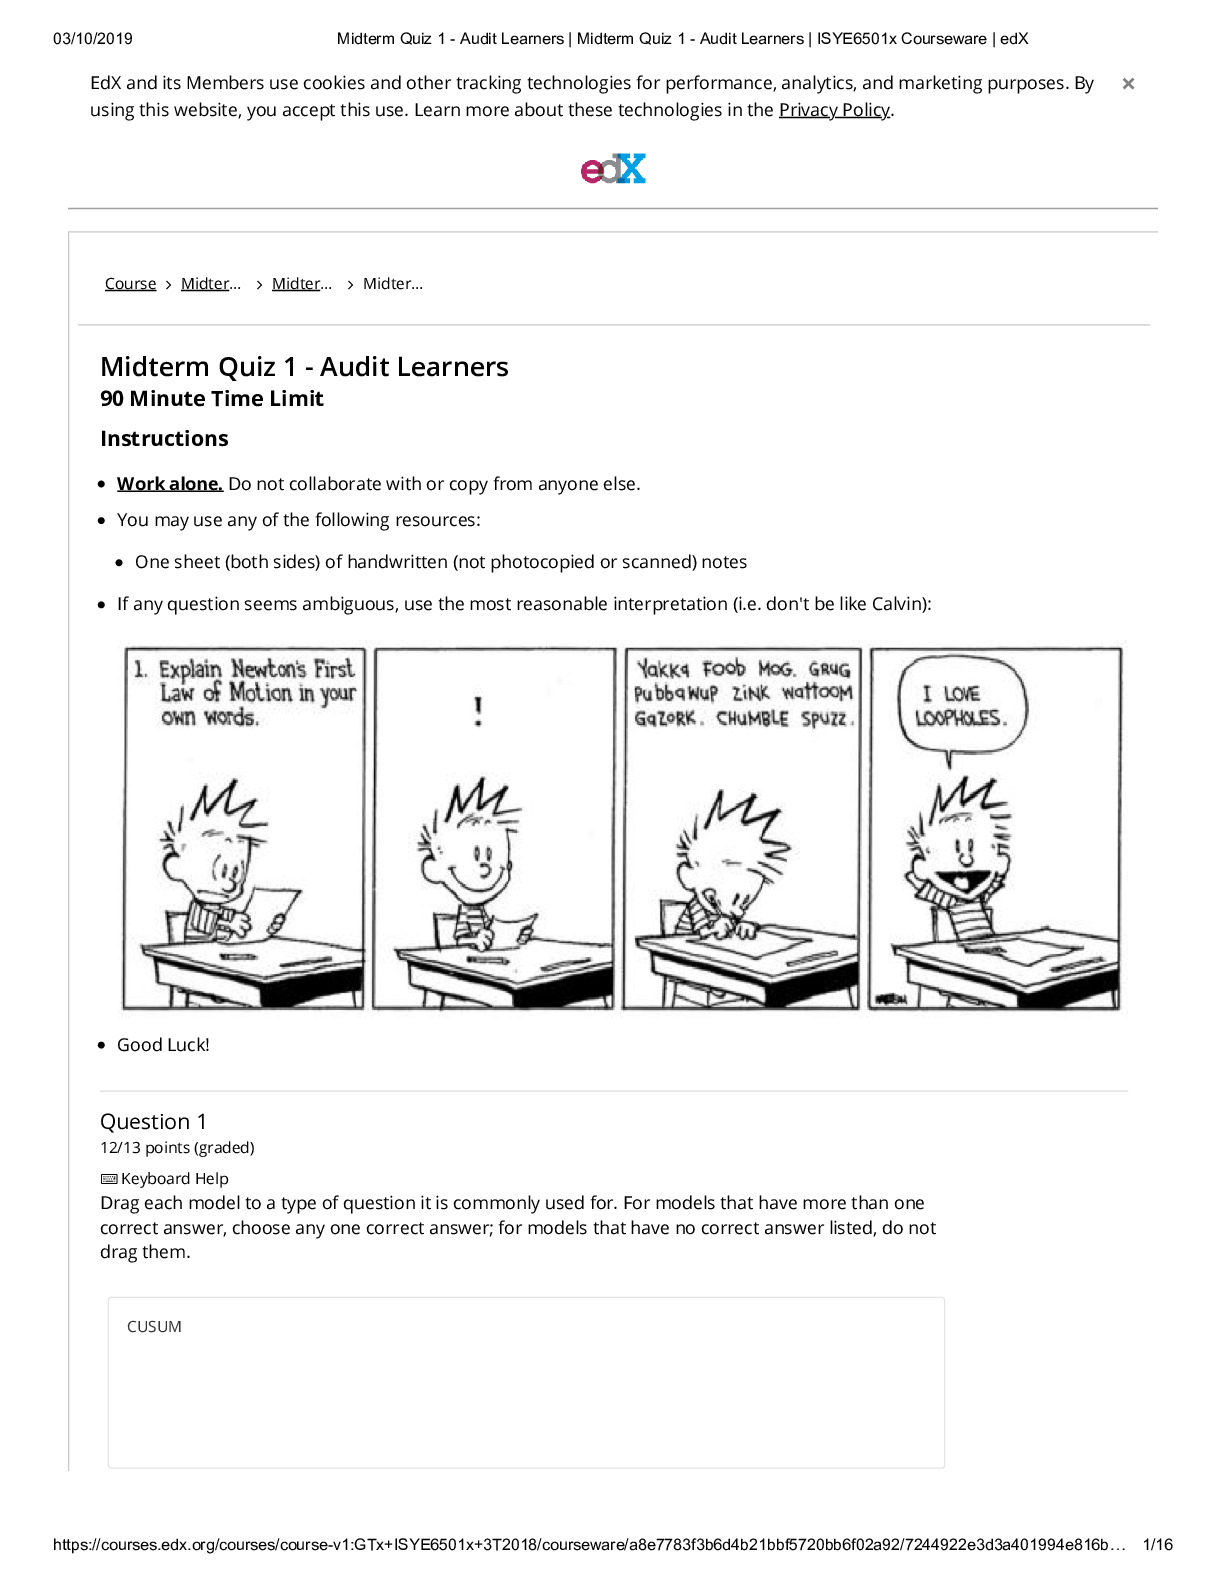
EdX and its Members use cookies and other tracking technologies for performance, analytics, and marketing purposes. By using this website, you accept this use. Learn more about these technologies in ... the Privacy Policy. × Course Midter… Midter… Midter… Midterm Quiz 2 - GT Students and Veried MM Learners Midterm Quiz 2 due Nov 8, 2020 23:00 PST Completed 90 Minute Time Limit Instructions Work alone. Do not collaborate with or copy from anyone else. Work the problems in any order you wish, but submit each answer before ending the exam. You may use any of the following resources: One sheet (both sides) of handwritten (not photocopied or scanned) notes If any question seems ambiguous, use the most reasonable interpretation (i.e. don't be like Calvin): 11/22/2020 Midterm Quiz 2 - GT Students and Verified MM Learners | Midterm Quiz 2 | ISYE6501x Courseware | edX https://courses.edx.org/courses/course-v1:GTx+ISYE6501x+2T2020a/courseware/f712bb2a96ff46b0bc8d775293bfc91d/1b57ff6ea64c40cf8f4eb69d2… 2/27 Good Luck! This is the beginning of Midterm Quiz 2. Please make sure that you submit all your answers before the time runs out. Once you submit an answer to a question, you cannot change it. There is no overall Submit button. After submitting all answers, please click the "End my Exam" button, above, before exiting from ProctorTrack to complete your exam. Information for Question 1 There are ve questions labeled "Question 1." Answer all ve questions. For each of the following ve questions, select the probability distribution that could best be used to model the described scenario. Each distribution might be used, zero, one, or more than one time in the ve questions. These scenarios are meant to be simple and straightforward; if you're an expert in the eld the question asks about, please do not rely on your expertise to ll in all the extra complexity (you'll end up making the questions below more dicult than I intended). Question 1 0.0/1.4 points (graded) Time from the start of a World Cup soccer match until a goal is scored 11/22/2020 Midterm Quiz 2 - GT Students and Verified MM Learners | Midterm Quiz 2 | ISYE6501x Courseware | edX https://courses.edx.org/courses/course-v1:GTx+ISYE6501x+2T2020a/courseware/f712bb2a96ff46b0bc8d775293bfc91d/1b57ff6ea64c40cf8f4eb69d2… 3/27 Answers are displayed within the problem Answers are displayed within the problem Answers are displayed within the problem Poisson Answer: Weibull You have used 1 of 1 attempt Question 1 1.4/1.4 points (graded) Number of phone calls made by a telemarketer until one is answered Geometric Answer: Geometric You have used 1 of 1 attempt Question 1 1.4/1.4 points (graded) Time between people entering the ID-check queue at an airport Exponential Answer: Exponential You have used 1 of 1 attempt Question 1 1.4/1.4 points (graded) Time between hits on a real estate web site Submit Submit Submit 11/22/2020 Midterm Quiz 2 - GT Students and Verified MM Learners | Midterm Quiz 2 | ISYE6501x Courseware | edX https://courses.edx.org/courses/course-v1:GTx+ISYE6501x+2T2020a/courseware/f712bb2a96ff46b0bc8d775293bfc91d/1b57ff6ea64c40cf8f4eb69d2… 4/27 Exponential You have used 1 of 1 attempt Question 1 1.4/1.4 points (graded) Time from the beginning of Fall until the rst snowake is seen Weibull You have used 1 of 1 attempt Questions 2a, 2b 5.0/10.0 points (graded) Five classication models were built for predicting whether a neighborhood will soon see a large rise in home prices, based on public elementary school ratings and other factors. The training data set was missing the school rating variable for every new school (3% of the data points). Because ratings are unavailable for newly-opened schools, it is believed that locations that have recently experienced high population growth are more likely to have missing school rating data. Model 1 used imputation, lling in the missing data with the average school rating from the rest of the data. Model 2 used imputation, building a regression model to ll in the missing school rating data based on other variables. Model 3 used imputation, rst building a classication model to estimate (based on other variables) whether a new school is likely to have been built as a result of recent population growth (or whether it has been built for another purpose, e.g. to replace a very old school), and then using that classication to select one of two regression models to ll in an estimate of the school rating; there are two dierent regression models (based on other variables), one for neighborhoods with new schools built due to population growth, and one for neighborhoods with new schools built for other reasons [Show More]
Last updated: 3 years ago
Preview 1 out of 27 pages

Buy this document to get the full access instantly
Instant Download Access after purchase
Buy NowInstant download
We Accept:

Can't find what you want? Try our AI powered Search
Connected school, study & course
About the document
Uploaded On
Apr 03, 2021
Number of pages
27
Written in
All
This document has been written for:
Uploaded
Apr 03, 2021
Downloads
0
Views
121
Scholarfriends.com Online Platform by Browsegrades Inc. 651N South Broad St, Middletown DE. United States.
We're available through e-mail, Twitter, Facebook, and live chat.
FAQ
Questions? Leave a message!
Copyright © Scholarfriends · High quality services·


.png)