Geography > EXAM REVIEW > 5.2 Earthquake Gizmo (All)
5.2 Earthquake Gizmo
Document Content and Description Below
Last updated: 3 years ago
Preview 1 out of 8 pages
Instant download

Buy this Document to get the Full Access Instantly
Provided by Students Who Aced it
We Verify Document Content to Gurantee Accuracy
Reviews( 0 )
Document information
Connected school, study & course
About the document
Uploaded On
Apr 12, 2021
Number of pages
8
Written in
All

Additional information
This document has been written for:
Uploaded
Apr 12, 2021
Downloads
0
Views
123
Document Keyword Tags
Recommended For You
Get more on EXAM REVIEW »
Exercises for Weather & Climate, 9e Greg Carbone (Solution Man...

Human Geography Places and Regions in Global Context, 5th Cana...
AQA GCSE GEOGRAPHY 8035/2 Paper 2 Challenges In The Human Envi...
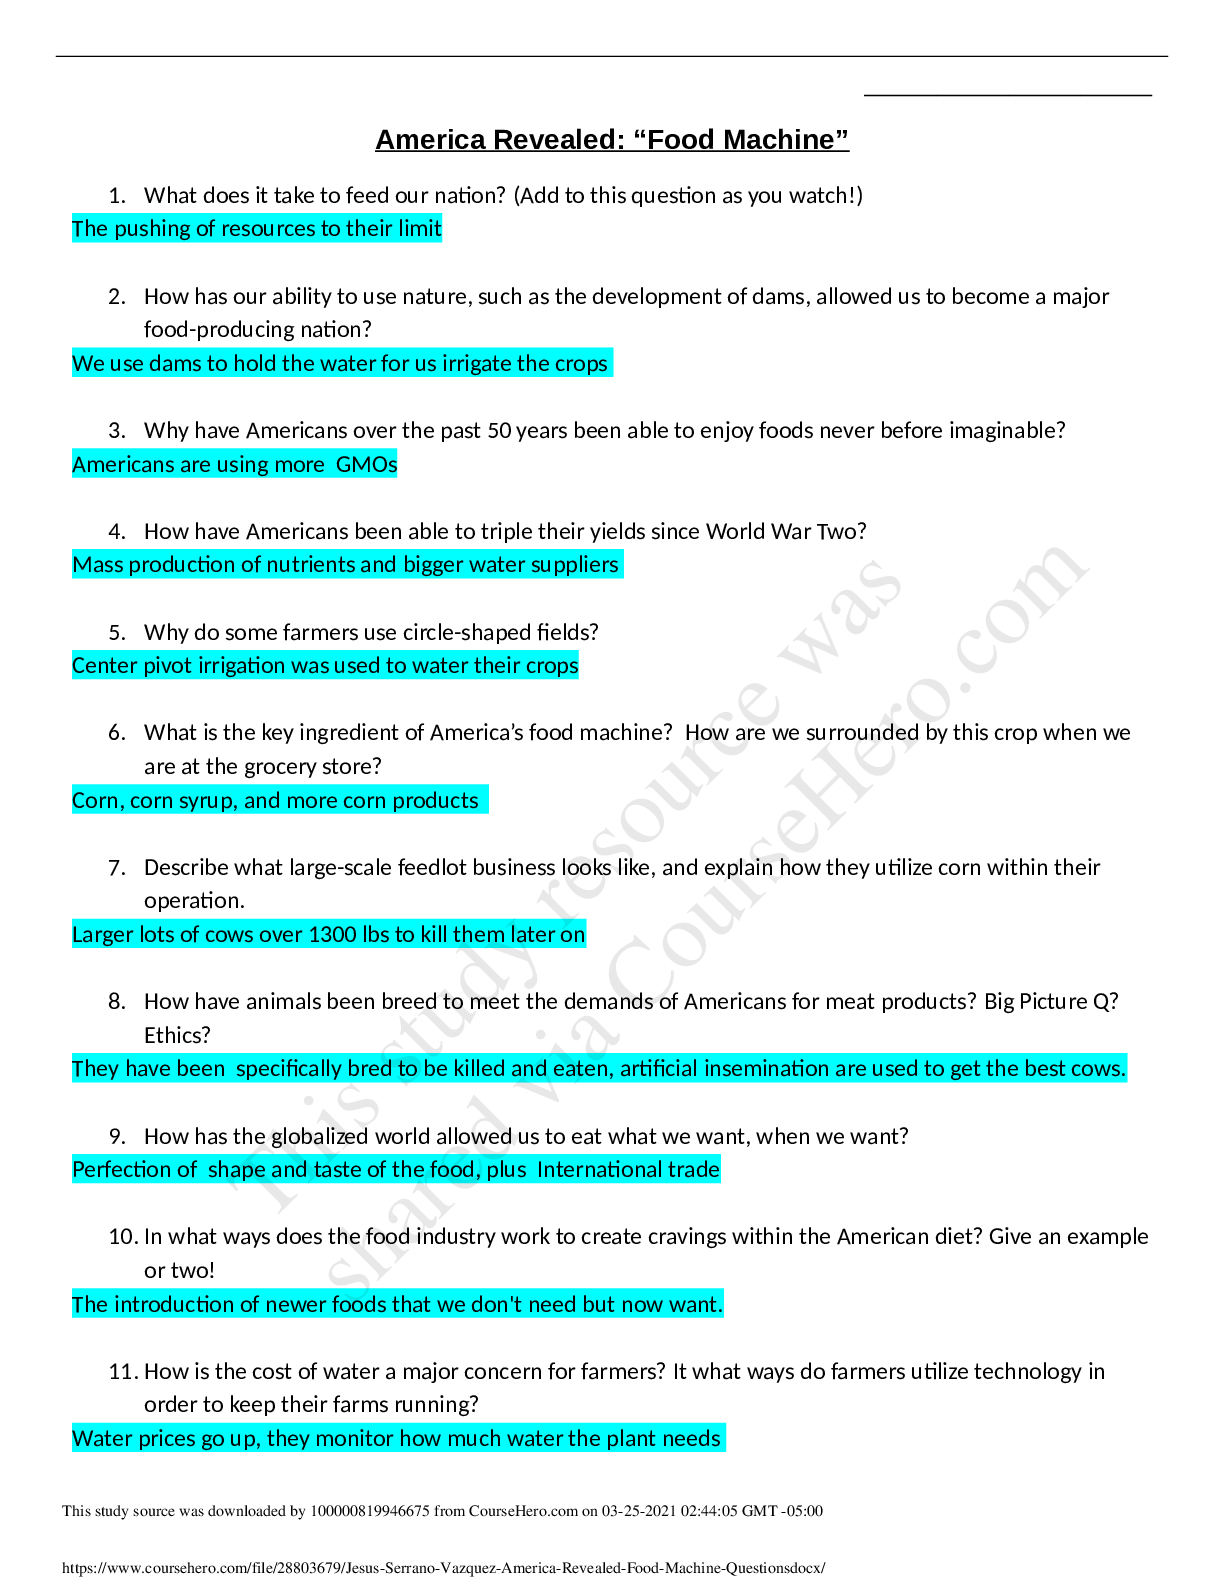
Jesus Serrano-Vazquez - America Revealed Food Machine Question...
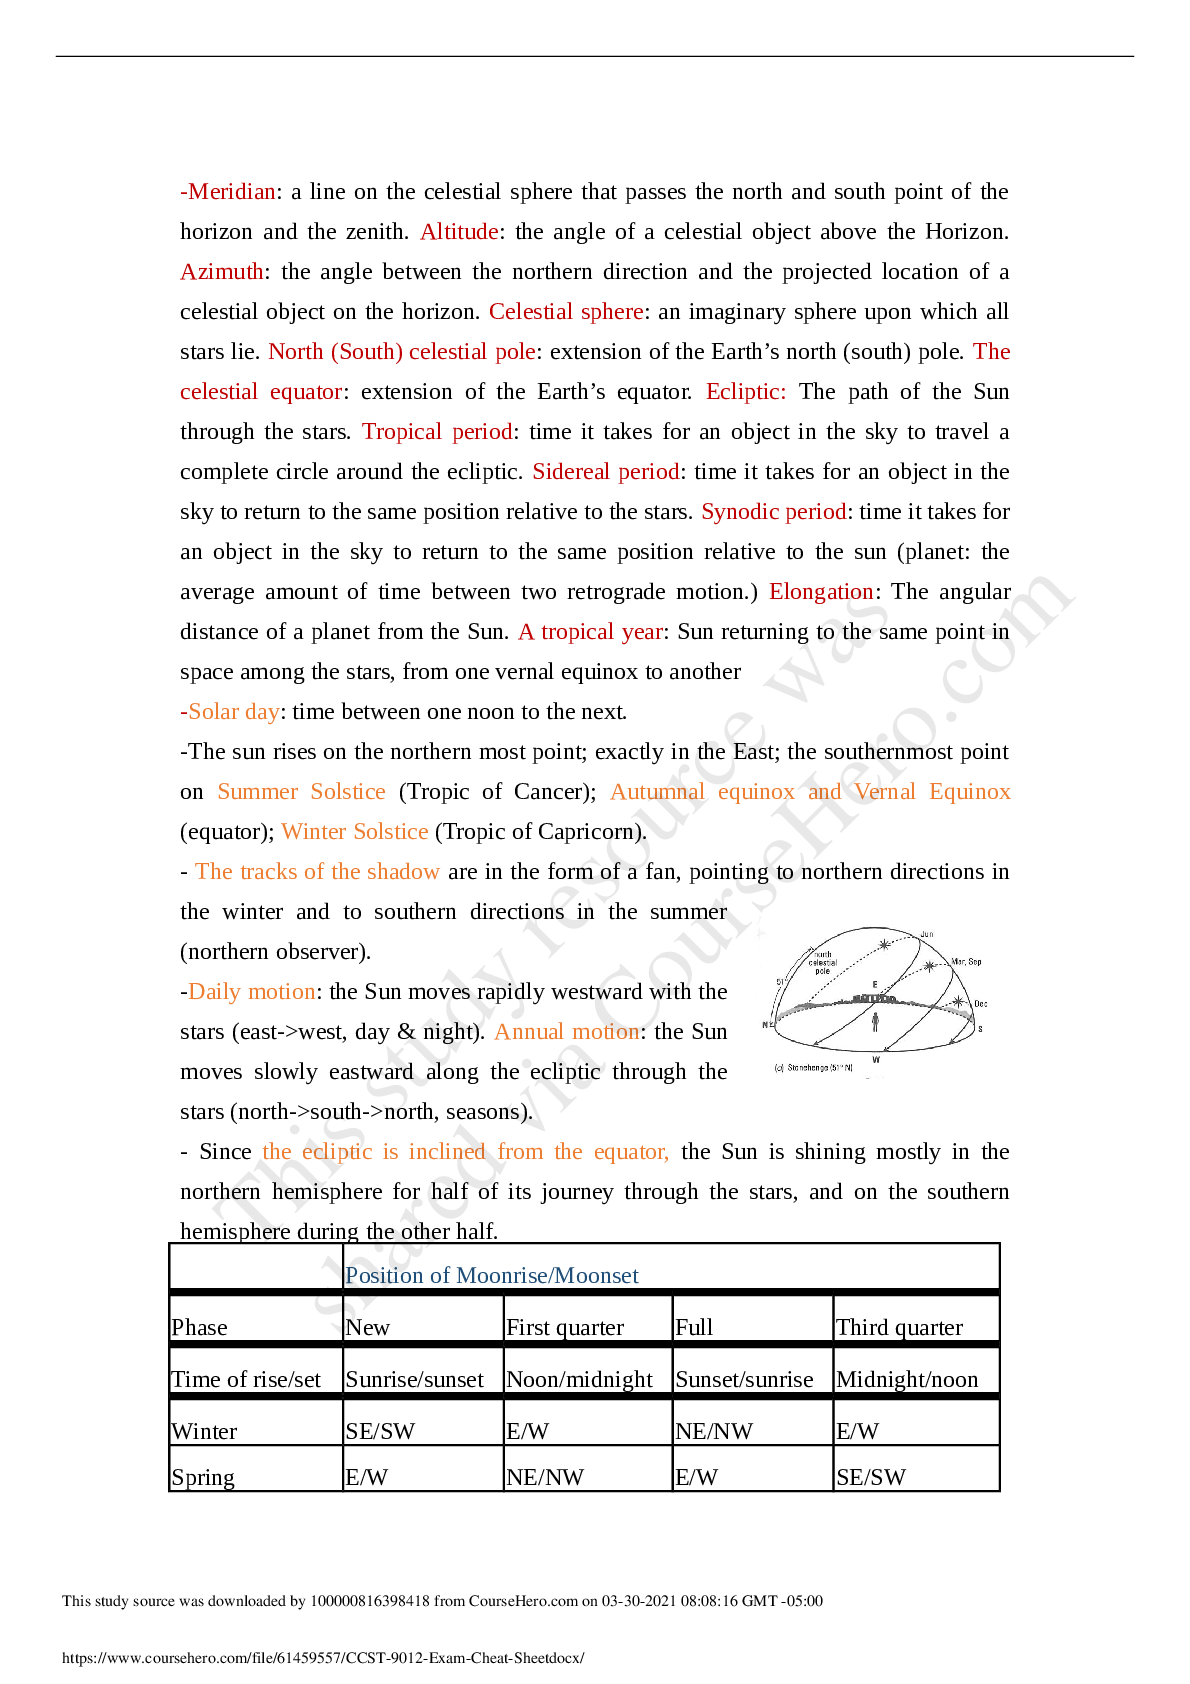
The University of Hong Kong - CCST 9012CCST 9012 Exam Cheat Sh...
![Preview of [Answer Key] American Military University GEOG 101 Week 5 Quiz](https://scholarfriends.com/storage/American-Military-University-GEOG-101-Week-5-Quiz.png)
[Answer Key] American Military University GEOG 101 Week 5 Qui...
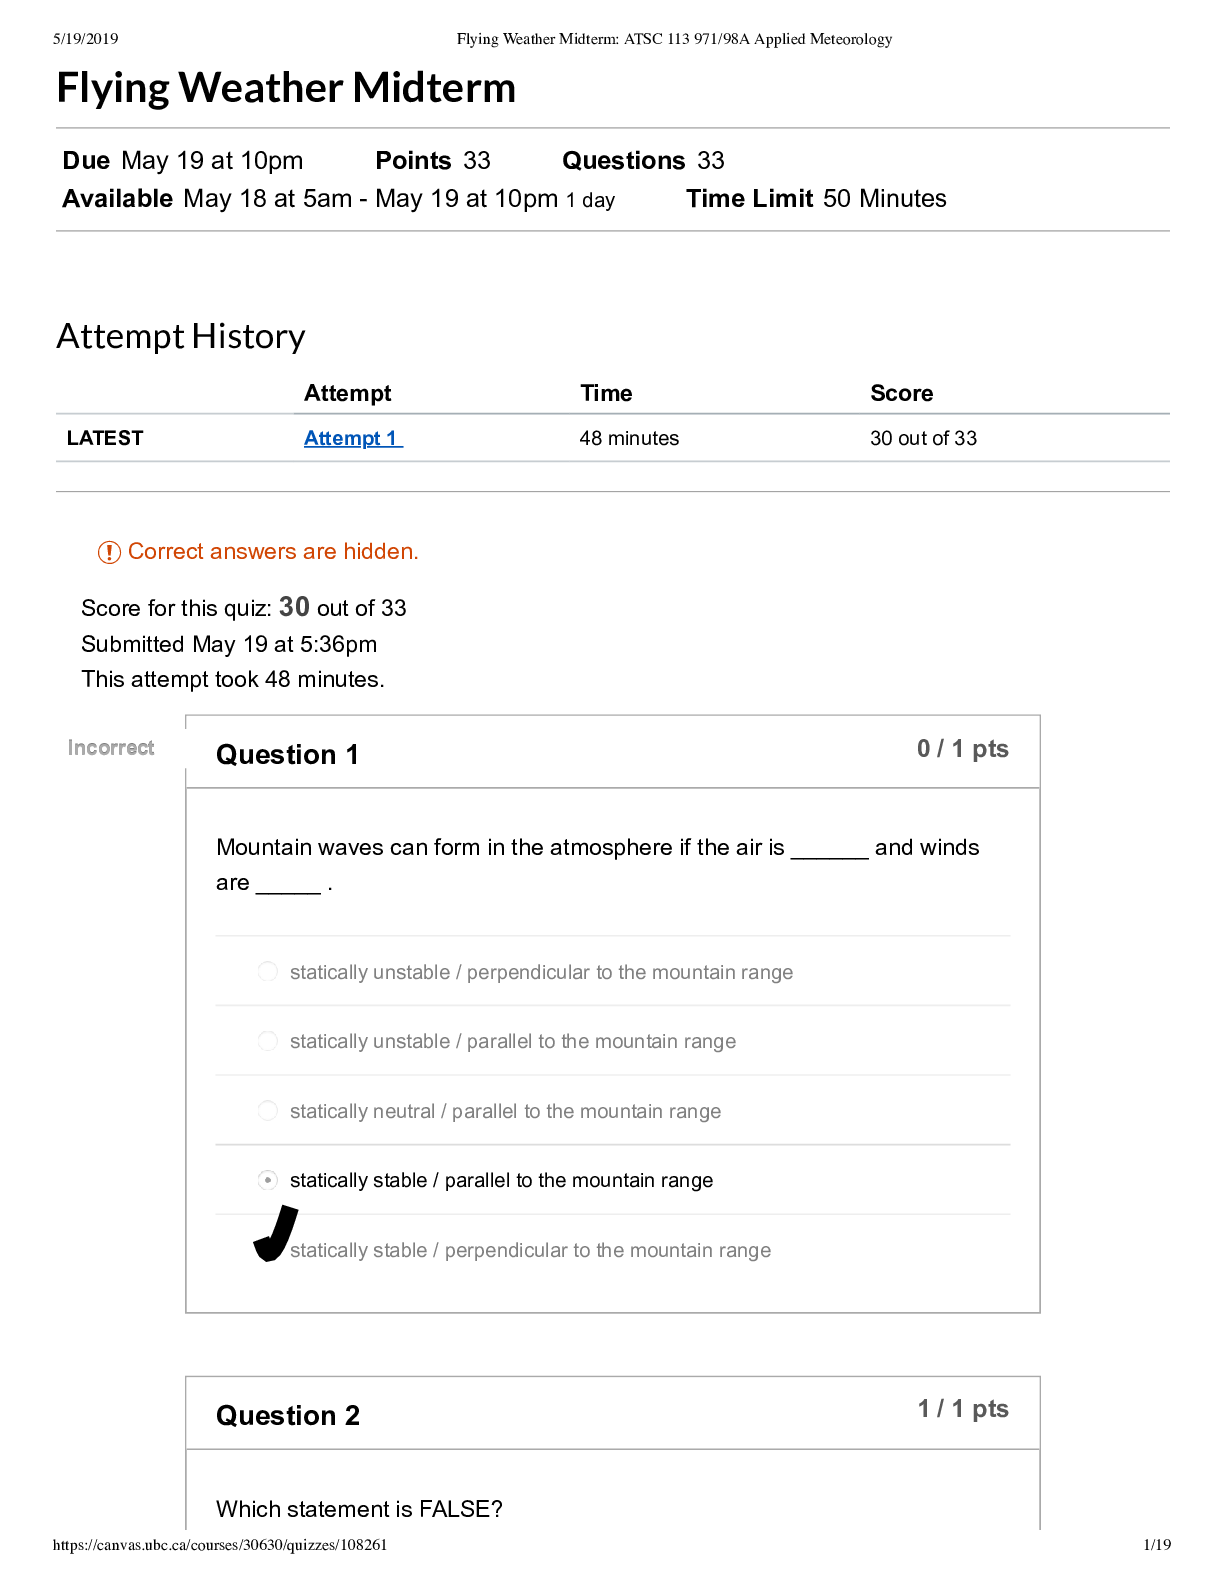
University of British ColumbiaATSC 113Flying Midterm Quiz Scor...
Earthquakes 1 – Recording Station GIZMO < ALL ANSWERS CORRECT>


AQA GCSE GEOGRAPHY 8035/2 Paper 2 Challenges in the Human Envi...
x.png)
NURS6521 / NURS 6521 Exam Study Guide (Latest): Advanced Pharm...


NUR 2633 / NUR2633 Exam 2 Study Guide Updated: Maternal Child...
![Preview of NUR2488 / NUR 2488 Exam 2 Study Guide [In Class Review] : Mental Health Nursing - Rasmuss](https://scholarfriends.com/storage/Mental Health Exam 2 Study Guide [In class review] MY21.png)


.png)