Business > QUESTIONS & ANSWERS > New York University Stern School of Business - STERN BIG DATAd3m hw1. (All)
New York University Stern School of Business - STERN BIG DATAd3m hw1.
Document Content and Description Below
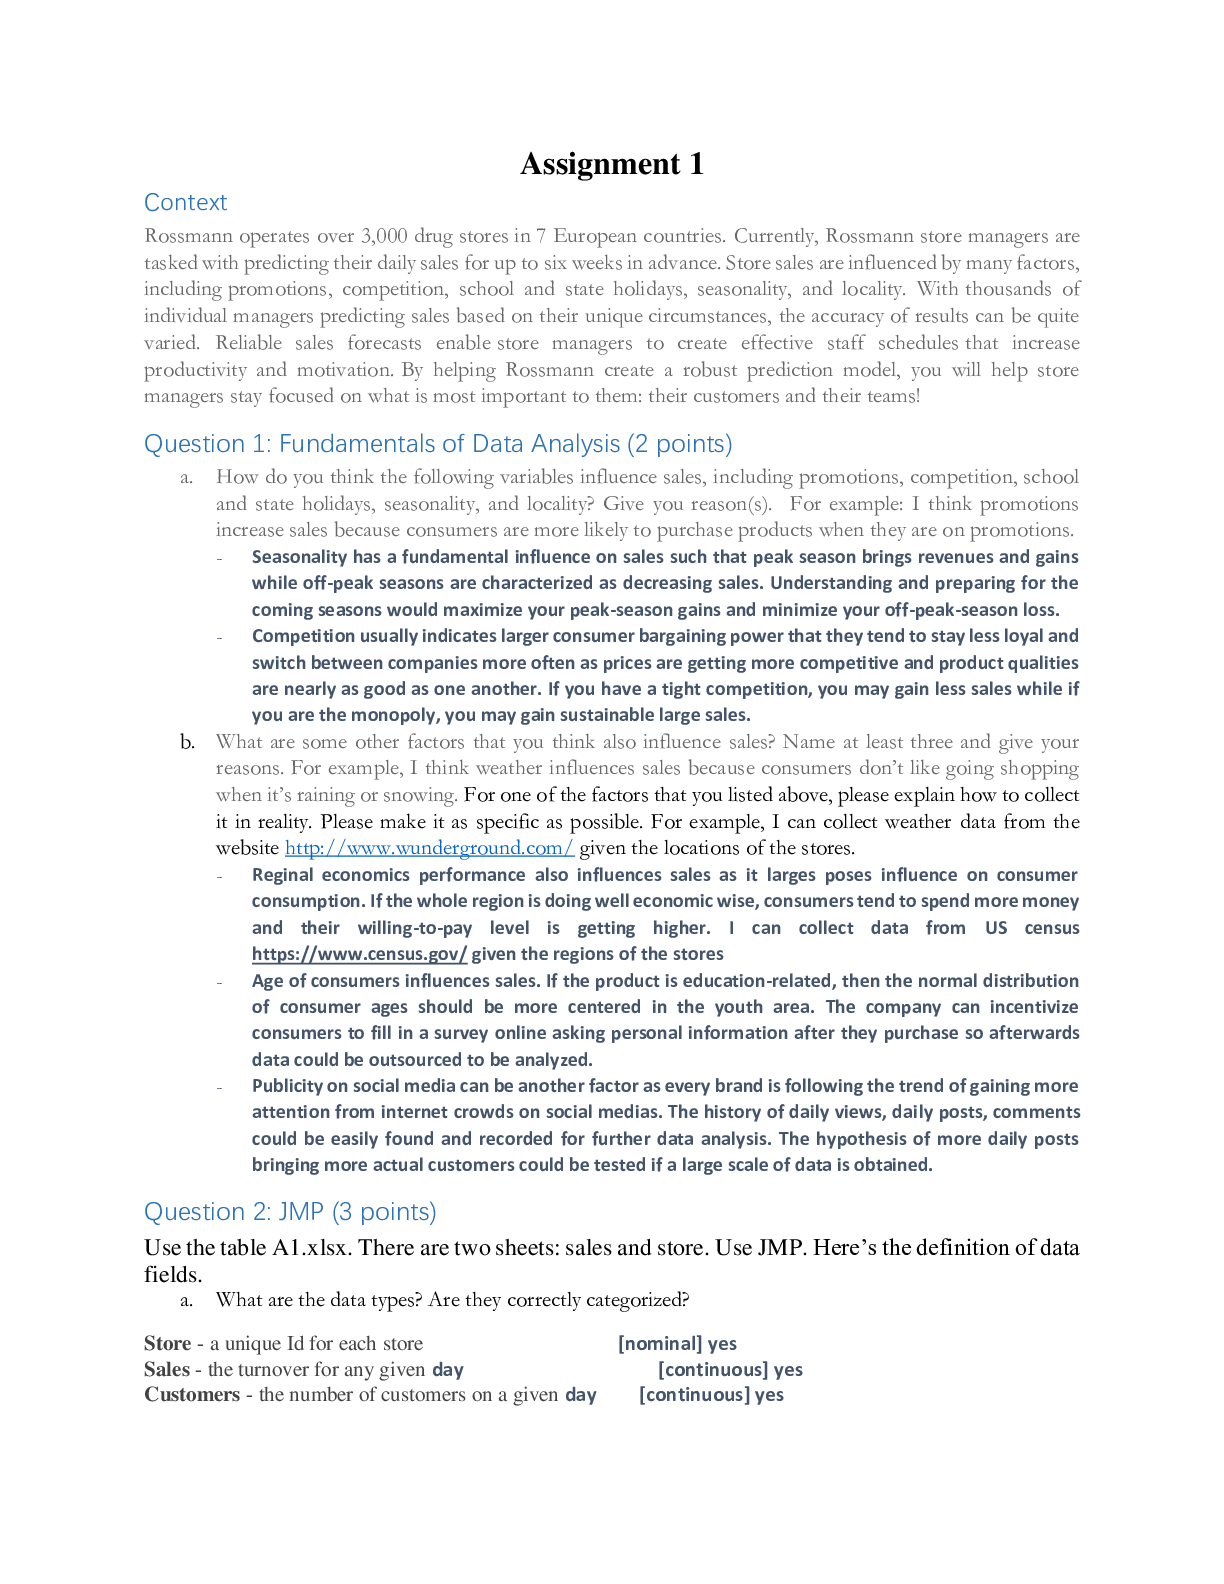
Assignment 1 Context Rossmann operates over 3,000 drug stores in 7 European countries. Currently, Rossmann store managers are tasked with predicting their daily sales for up to six weeks in advance... . Store sales are influenced by many factors, including promotions, competition, school and state holidays, seasonality, and locality. With thousands of individual managers predicting sales based on their unique circumstances, the accuracy of results can be quite varied. Reliable sales forecasts enable store managers to create effective staff schedules that increase productivity and motivation. By helping Rossmann create a robust prediction model, you will help store managers stay focused on what is most important to them: their customers and their teams! Question 1: Fundamentals of Data Analysis (2 points) a. How do you think the following variables influence sales, including promotions, competition, school and state holidays, seasonality, and locality? Give you reason(s). For example: I think promotions increase sales because consumers are more likely to purchase products when they are on promotions. b. What are some other factors that you think also influence sales? Name at least three and give your reasons. For example, I think weather influences sales because consumers don’t like going shopping when it’s raining or snowing. For one of the factors that you listed above, please explain how to collect it in reality. Please make it as specific as possible. For example, I can collect weather data from the Question 2: JMP (3 points) Use the table A1.xlsx. There are two sheets: sales and store. Use JMP. Here’s the definition of data fields. a. What are the data types? Are they correctly categorized? b. | Summarize all variables. Briefly explain your findings for each variable. For example: How many stores are there? What’s the starting and ending dates of the data? What’s the average number of customersper store per day? What’s the median sales per store per day? What’s the maximum number of days open for any store? How many state and school holidays are there (unique values)? What’s the average competition distance for each store? c. Are sales significantly higher when there’s promotion? Question 3: Tableau (3 points) a. Join the two sheets sales and store in the file A1.xlsx with Tableau. What variable is these two sheets joined by? b. Plot the time series of sum of sales at different levels: year, month, week, weekday, exact date. Any interesting stories? c. Plot the time series of average sales at different levels: year, month, week, weekday, exact date. Do they look differently from those in b? Why? Question 4: R (2 points) Use sales.csv. a. Redo Question 2 b using R. Question 5: (Bonus 1 point) Based on your analysis, what do you think the sales for store 2 on August 1 2015 will be? [Show More]
Last updated: 2 years ago
Preview 1 out of 12 pages
Buy this document to get the full access instantly
Instant Download Access after purchase
Buy NowInstant download
We Accept:

Reviews( 0 )
$7.00
Can't find what you want? Try our AI powered Search
Document information
Connected school, study & course
About the document
Uploaded On
Apr 13, 2021
Number of pages
12
Written in

Additional information
This document has been written for:
Uploaded
Apr 13, 2021
Downloads
0
Views
43


.png)
