MATH 225N week 8 statistics questions module Correlation.
Question
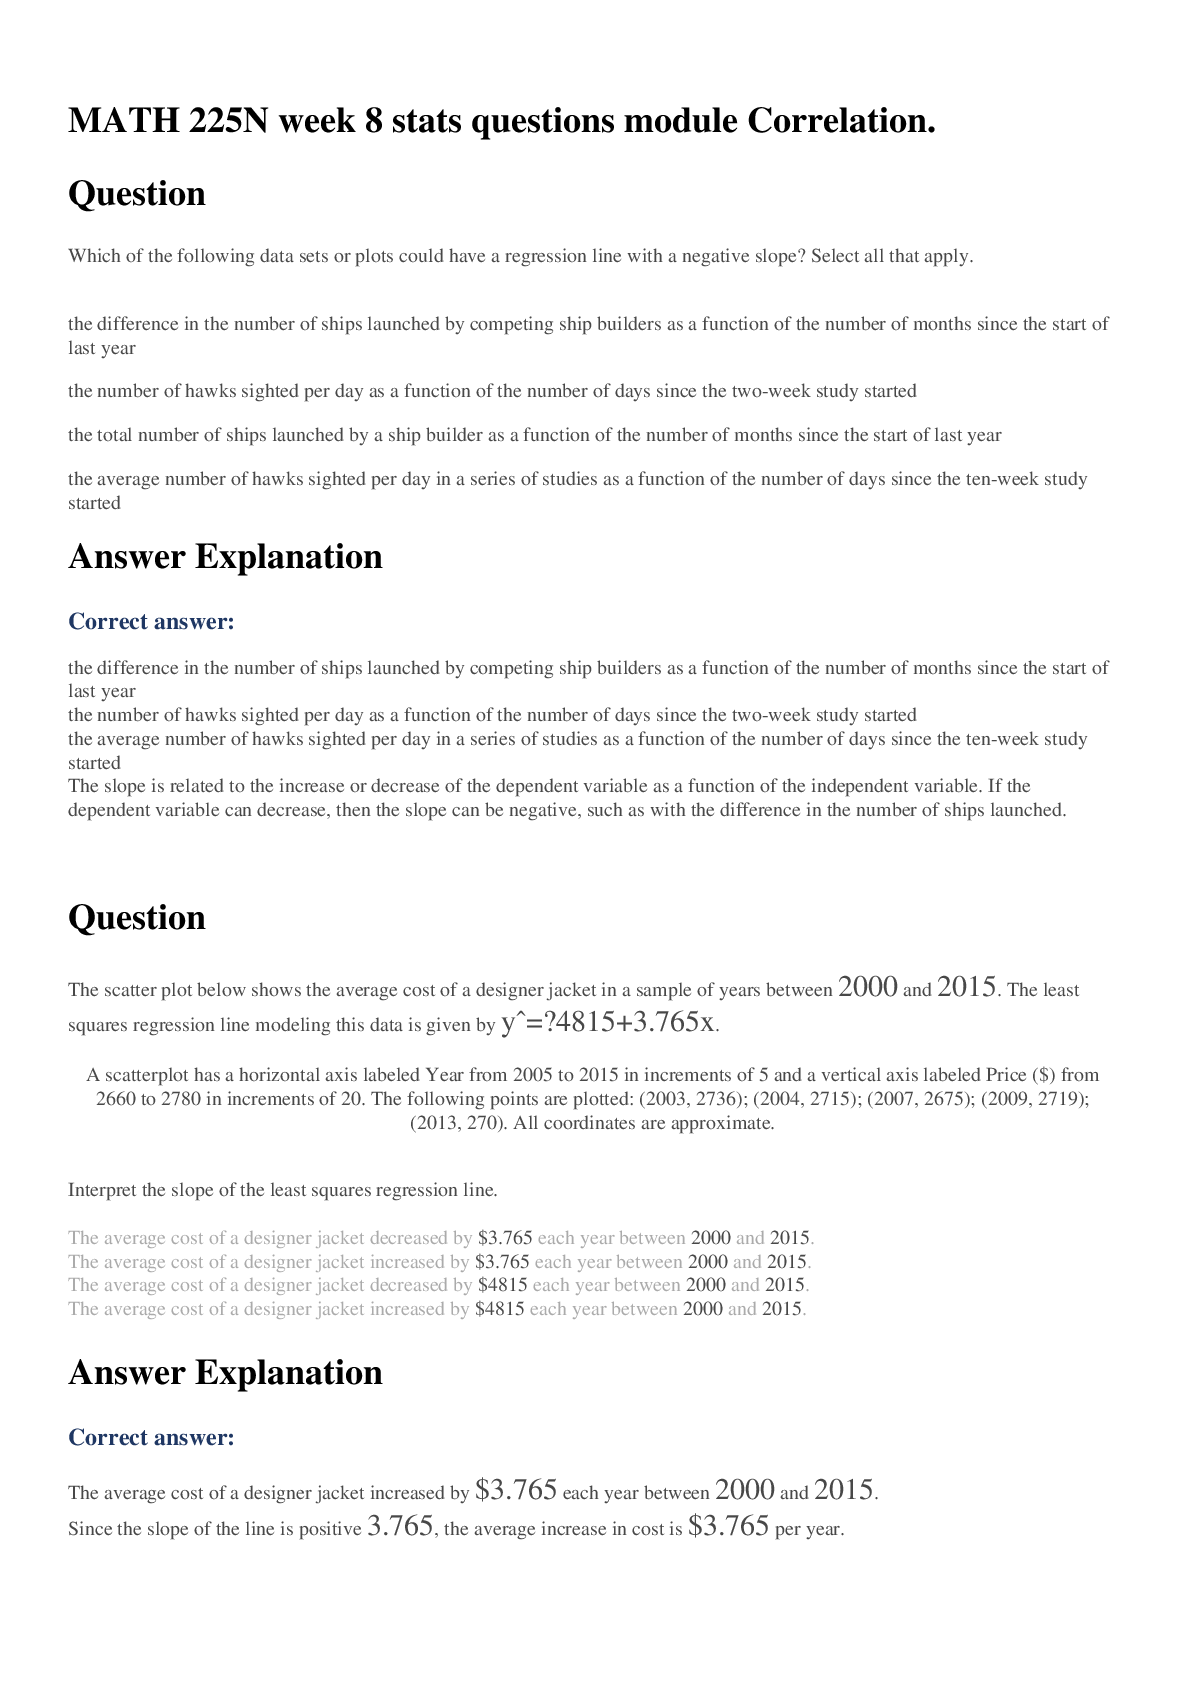
Which of the following data sets or plots could have a regression line with a negative slope? Select all that apply.
•
the difference in the numb
...
MATH 225N week 8 statistics questions module Correlation.
Question
Which of the following data sets or plots could have a regression line with a negative slope? Select all that apply.
•
the difference in the number of ships launched by competing ship builders as a function of the number of months since the start of last year
• ________________________________________
•
the number of hawks sighted per day as a function of the number of days since the two-week study started
• ________________________________________
•
the total number of ships launched by a ship builder as a function of the number of months since the start of last year
• ________________________________________
•
the average number of hawks sighted per day in a series of studies as a function of the number of days since the ten-week study started
• ________________________________________
Question
The scatter plot below shows the average cost of a designer jacket in a sample of years between 2000 and 2015. The least squares regression line modeling this data is given by yˆ=−4815+3.765x.
A scatterplot has a horizontal axis labeled Year from 2005 to 2015 in increments of 5 and a vertical axis labeled Price ($) from 2660 to 2780 in increments of 20. The following points are plotted: (2003, 2736); (2004, 2715); (2007, 2675); (2009, 2719); (2013, 270). All coordinates are approximate.
Interpret the slope of the least squares regression line.
________________________________________
________________________________________
The average cost of a designer jacket decreased by $3.765 each year between 2000 and 2015.
The average cost of a designer jacket increased by $3.765 each year between 2000 and 2015.
The average cost of a designer jacket decreased by $4815 each year between 2000 and 2015.
The average cost of a designer jacket increased by $4815 each year between 2000 and 2015.
Question
The scatter plot below shows data for the average cost of a high-end computer (y, in dollars) in the year x years since 2000. The least squares regression line is given by yˆ=−1677+314x.
A coordinate plane has a horizontal x-axis labeled Year from 4 to 12 in increments of 2 and a vertical y-axis labeled Cost in dollars from 0 to 2000 in increments of 500. The following points are plotted: left-parenthesis 6 comma 250 right-parenthesis, left-parenthesis 7 comma 550 right-parenthesis, left-parenthesis 9 comma 1000 right-parenthesis, left-parenthesis 10 comma 1300 right-parenthesis, and left-parenthesis 11 comma 2000 right-parenthesis. A line rises from left to right, passing through left-parenthesis 7 comma 550 right-parenthesis and left-parenthesis 10 comma 1500 right-parenthesis. All coordinate are approximate.
Interpret the slope of the least squares regression line.
________________________________________
Great work! That's correct.
________________________________________
On average, the average cost of a high-end computer is predicted to decrease by $314 each year.
On average, the average cost of a high-end computer is predicted to increase by $314 each year.
The average cost of a high-end computer increases by $314 each year.
On average, the average cost of a high-end computer is predicted to decrease by $1677 each year.
Question
Which of the following data sets or plots could have a regression line with a negative slope?
•
the number of miles a ship has traveled as a function of the number of years since it was launched
• ________________________________________
•
the number of miles a ship has traveled each year as a function of the number of years since it was launched
• ________________________________________
•
the number of cats living in an abandoned lot as a function of the number of years since the building was torn down
• ________________________________________
•
the number of cats born each year in an abandoned lot as a function of the number of years since the building was torn down
• ________________________________________
Question
A survey regarding truck engines found a positive correlation between the size of the engine and horsepower the engine produces. Answer the following question based only on this information.
True or false: It can be concluded that trucks with larger engines have greater horsepower.
________________________________________
________________________________________
True
False
Question
Which of the following data sets or plots could have a regression line with a negative y-intercept? Select all that apply.
________________________________________
•
the percent change in the land area in the arctic circle covered by ice as a function of the tons of CO2 produced by humans
• ________________________________________
•
the change in the square mileage in the arctic circle covered by ice as a function of the tons of CO2 produced by humans
• ________________________________________
•
the number of people living on a volcanic island as a function of the number of days since the last volcanic eruption
• ________________________________________
•
the difference in the number of ships launched by competing ship builders as a function of the number of months since the start of last year
• ________________________________________
Question
True or False: The more time it takes to travel a road, the longer the road is.
True
False
Question
A large observational study asks participants about caffeine consumption and sleep duration. The study finds that people with the largest caffeine intake have the shortest sleep duration.
Identify the relation between caffeine consumption and sleep duration.
________________________________________
________________________________________
Caffeine consumption and sleep duration are correlated.
An increase in caffeine consumption causes a decrease in sleep duration.
A decrease in sleep duration causes an increase in caffeine consumption.
There is no relation between caffeine consumption and sleep duration.
[Show More]


.png)
 2e Peter Olver, Chehrzad Shakiban.png)