Database Management > Solutions Guide > San Jose City College_CIS 024_lab05-EDITED AND REVIEWED BY EXPERTS (All)
San Jose City College_CIS 024_lab05-EDITED AND REVIEWED BY EXPERTS
Document Content and Description Below
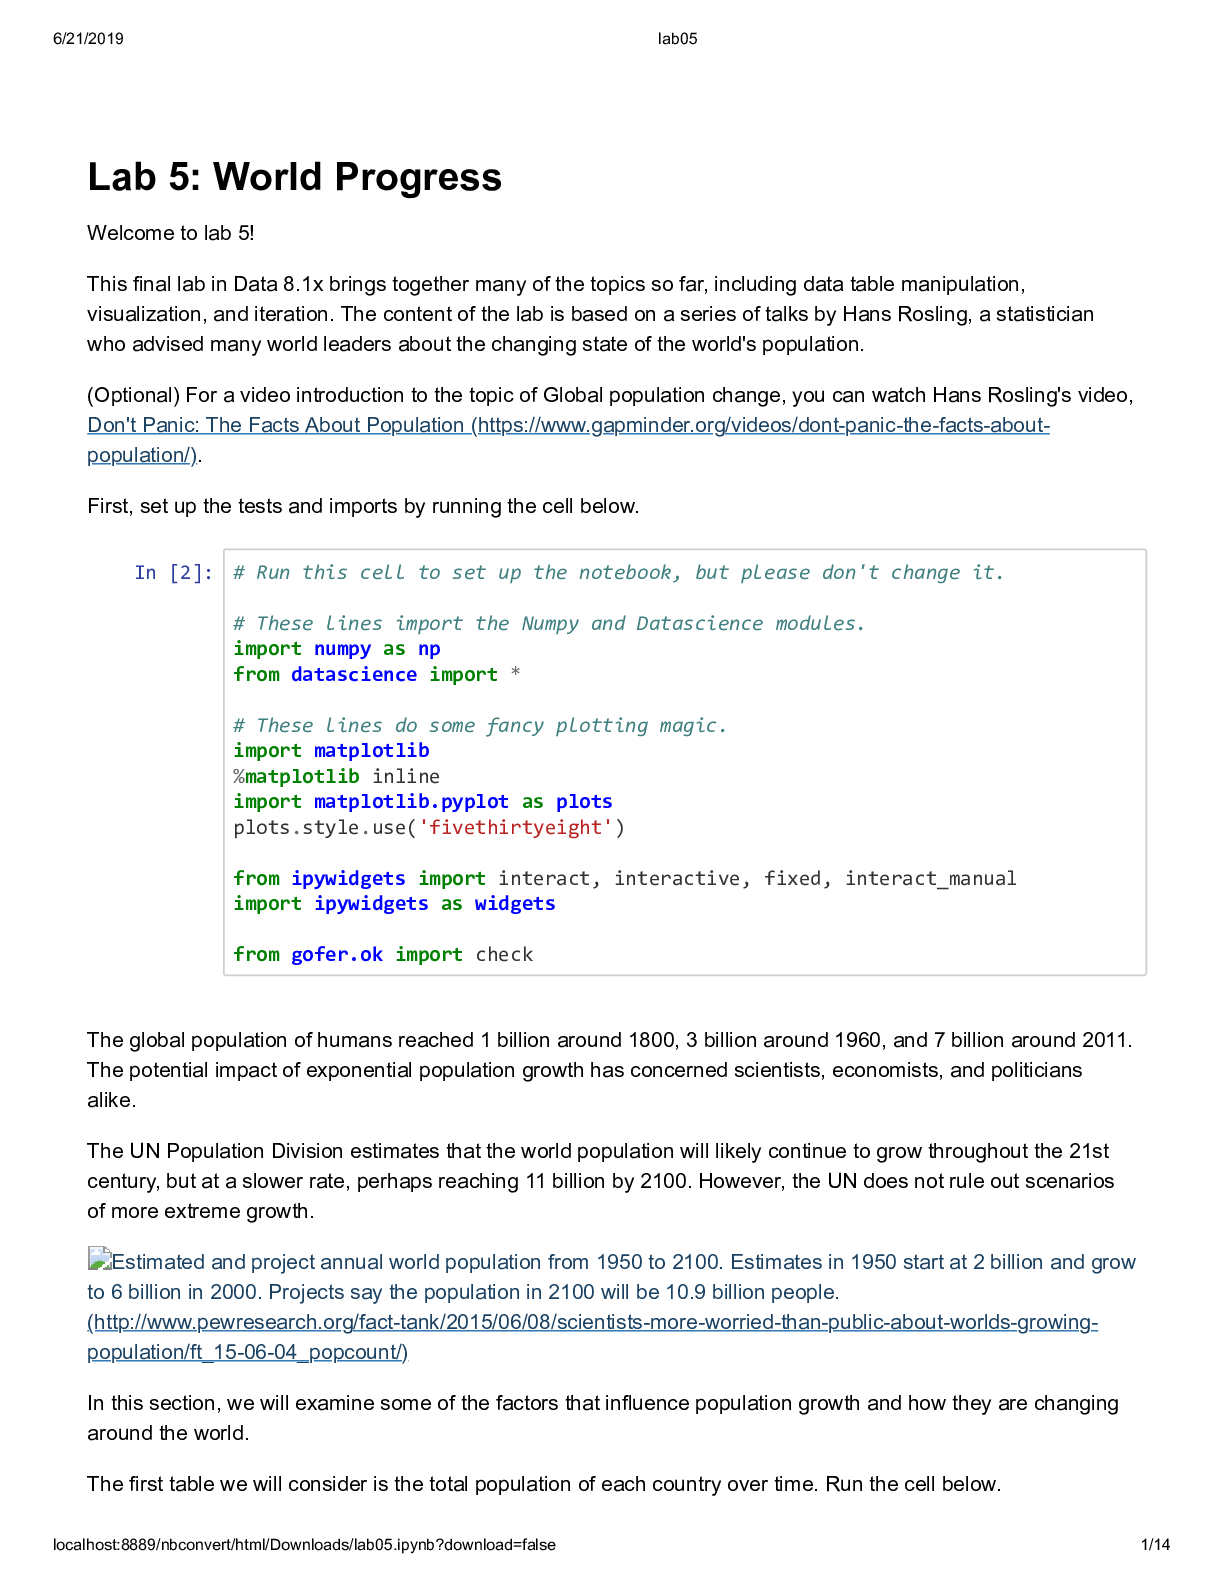
Lab 5: World Progress Welcome to lab 5! This final lab in Data 8.1x brings together many of the topics so far, including data table manipulation, visualization, and iteration. The content of the la... b is based on a series of talks by Hans Rosling, a statistician who advised many world leaders about the changing state of the world's population. (Optional) For a video introduction to the topic of Global population change, you can watch Hans Rosling's video, Don't Panic: The Facts About Population (https://www.gapminder.org/videos/dont-panic-the-facts-aboutpopulation/). First, set up the tests and imports by running the cell below. In [2]: # Run this cell to set up the notebook, but please don't change it. # These lines import the Numpy and Datascience modules. import numpy as np from datascience import * # These lines do some fancy plotting magic. import matplotlib %matplotlib inline import matplotlib.pyplot as plots plots.style.use('fivethirtyeight') from ipywidgets import interact, interactive, fixed, interact_manual import ipywidgets as widgets from gofer.ok import check The global population of humans reached 1 billion around 1800, 3 billion around 1960, and 7 billion around 2011. The potential impact of exponential population growth has concerned scientists, economists, and politicians alike. The UN Population Division estimates that the world population will likely continue to grow throughout the 21st century, but at a slower rate, perhaps reaching 11 billion by 2100. However, the UN does not rule out scenarios of more extreme growth. Estimated and project annual world population from 1950 to 2100. Estimates in 1950 start at 2 billion and grow to 6 billion in 2000. Projects say the population in 2100 will be 10.9 billion people. (http://www.pewresearch.org/fact-tank/2015/06/08/scientists-more-worried-than-public-about-worlds-growingpopulation/ft_15-06-04_popcount/) In this section, we will examine some of the factors that influence population growth and how they are changing around the world. The first table we will consider is the total population of each country over time. Run the cell below.6/21/2019 lab05 localhost:8889/nbconvert/html/Downloads/lab05.ipynb?download=false 2/14 In [3]: # The population.csv file can also be found online here: # https://github.com/open-numbers/ddf--gapminder--systema_globalis/raw/master/ ddf--datapoints--population_total--by--geo--time.csv # The version in this project was downloaded in February, 2017. population = Table.read_table('population.csv') [Show More]
Last updated: 2 years ago
Preview 1 out of 14 pages
Buy this document to get the full access instantly
Instant Download Access after purchase
Buy NowInstant download
We Accept:

Reviews( 0 )
$7.00
Can't find what you want? Try our AI powered Search
Document information
Connected school, study & course
About the document
Uploaded On
May 07, 2021
Number of pages
14
Written in

Additional information
This document has been written for:
Uploaded
May 07, 2021
Downloads
0
Views
104


.png)


