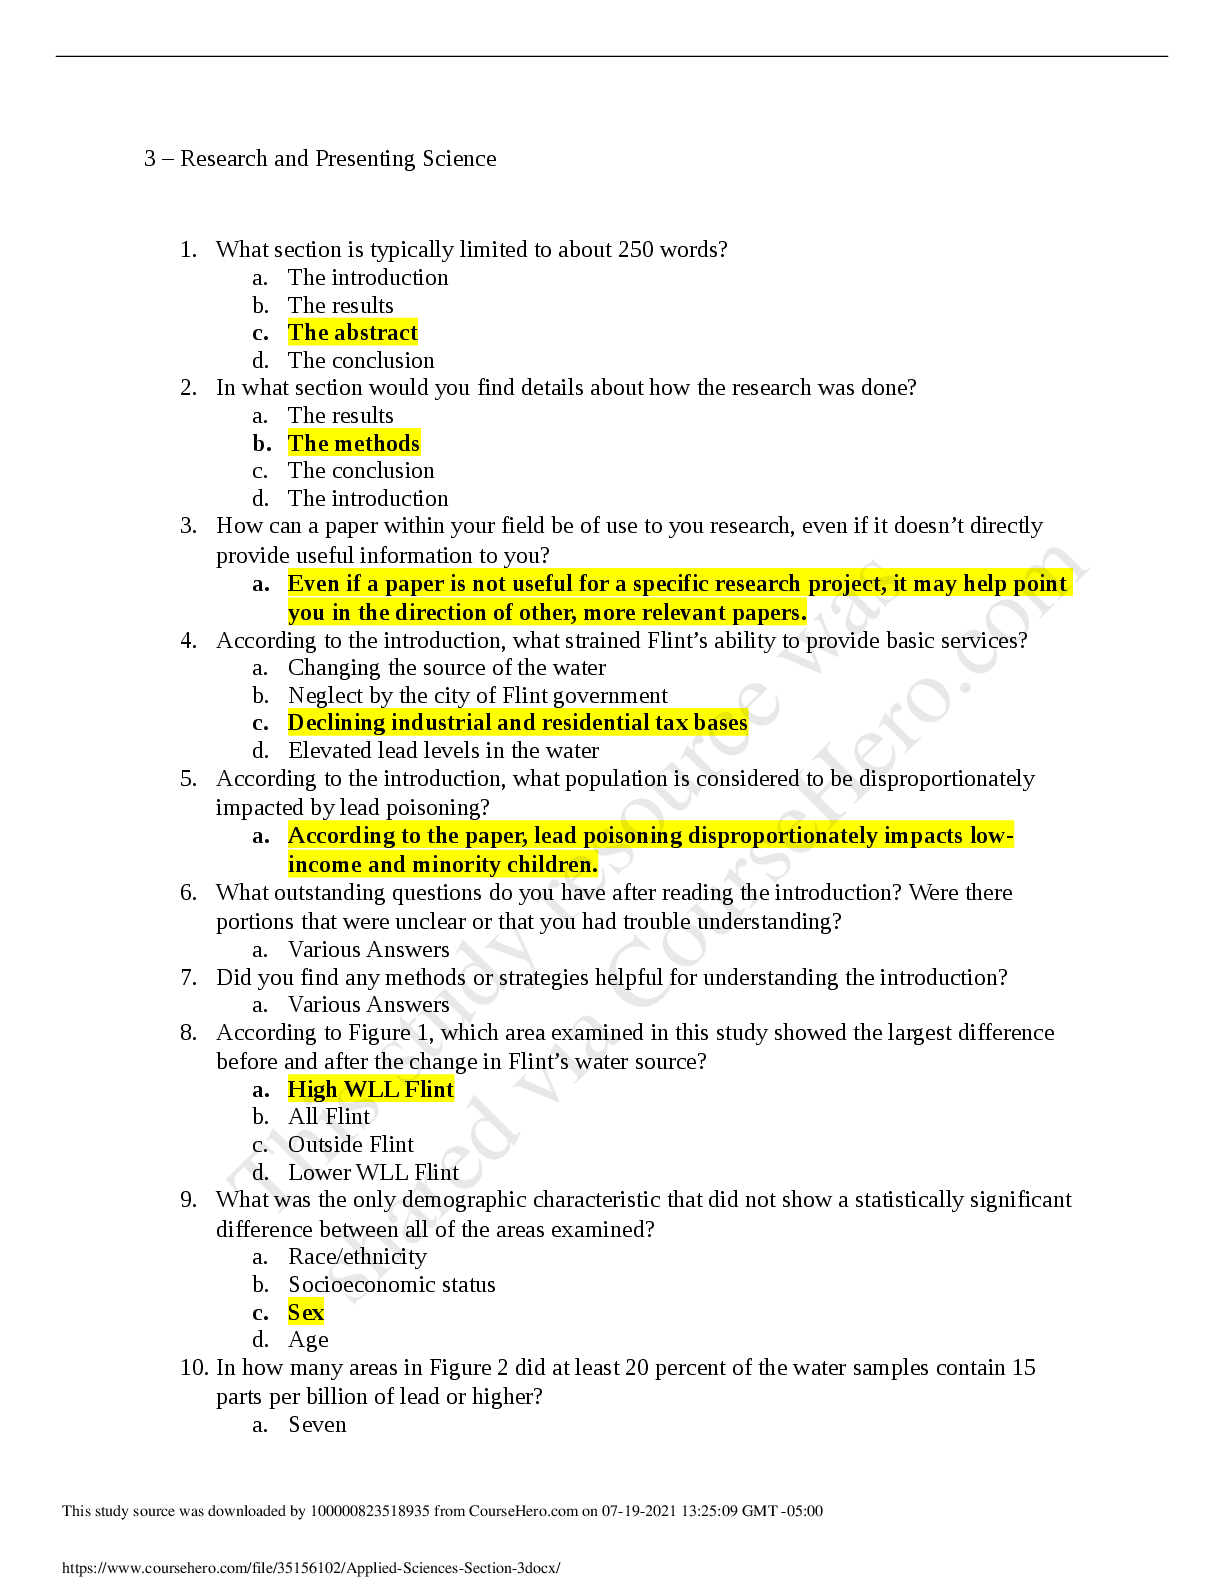
WEEK 2 HOMEWORK – SAMPLE SOLUTIONS
IMPORTANT NOTE
These homework solutions show multiple approaches and some optional extensions for most of
the questions in the assignment. You don’t need to submit all this in your a
...
WEEK 2 HOMEWORK – SAMPLE SOLUTIONS
IMPORTANT NOTE
These homework solutions show multiple approaches and some optional extensions for most of
the questions in the assignment. You don’t need to submit all this in your assignments; they’re
included here just to help you learn more – because remember, the main goal of the homework
assignments, and of the entire course, is to help you learn as much as you can, and develop
your analytics skills as much as possible!
Question 4.1
Describe a situation or problem from your job, everyday life, current events, etc., for which a clustering
model would be appropriate. List some (up to 5) predictors that you might use.
Question 4.2
The iris data set iris.txt contains 150 data points, each with four predictor variables and one categorical
response. The predictors are the width and length of the sepal and petal of flowers and the response is
the type of flower. The data is available from the R library datasets and can be accessed with iris once
the library is loaded. It is also available at the UCI Machine Learning Repository
(https://archive.ics.uci.edu/ml/datasets/Iris ). The response values are only given to see how well a
specific method performed and should not be used to build the model.
Use the R function kmeans to cluster the points as well as possible. Report the best combination of
predictors, your suggested value of k, and how well your best clustering predicts flower type.
Here’s one possible solution. Please note that a good solution doesn’t have to try all of the possibilities
in the code; they’re shown to help you learn, but they’re not necessary.
The R code in file solution 4.2.R shows clustering solutions for k=2,3,4,5 using all factors, for both
unscaled and scaled data.
Question 5.1
Using crime data from the file uscrime.txt (http://www.statsci.org/data/general/uscrime.txt, description
at http://www.statsci.org/data/general/uscrime.html), test to see whether there are any outliers in the
last column (number of crimes per 100,000 people). Use the grubbs.test function in the outliers package
in R.
Question 6.1
Describe a situation or problem from your job, everyday life, current events, etc., for which a Change
Detection model would be appropriate. Applying the CUSUM technique, how would you choose the
critical value and the threshold?
Question 6.2
1. Using July through October daily-high-temperature data for Atlanta for 1996 through 2015, use
a CUSUM approach to identify when unofficial summer ends (i.e., when the weather starts
cooling off) each year.
2. Use a CUSUM approach to make a judgment of whether Atlanta’s summer climate has gotten
warmer in that time (and if so, when).
[Show More]












 Charles Herrick - 100 Q&A About Alcoholism & Drug Addiction-Jones and Bartlett Publishers, Inc.png)