Biology > Solutions Guide > LS 40 (Life Science) Homework 1 Solutions (Lecture 1 W21)updated in Jan 2021 (All)
LS 40 (Life Science) Homework 1 Solutions (Lecture 1 W21)updated in Jan 2021
Document Content and Description Below
Last updated: 3 years ago
Preview 1 out of 13 pages
Instant download
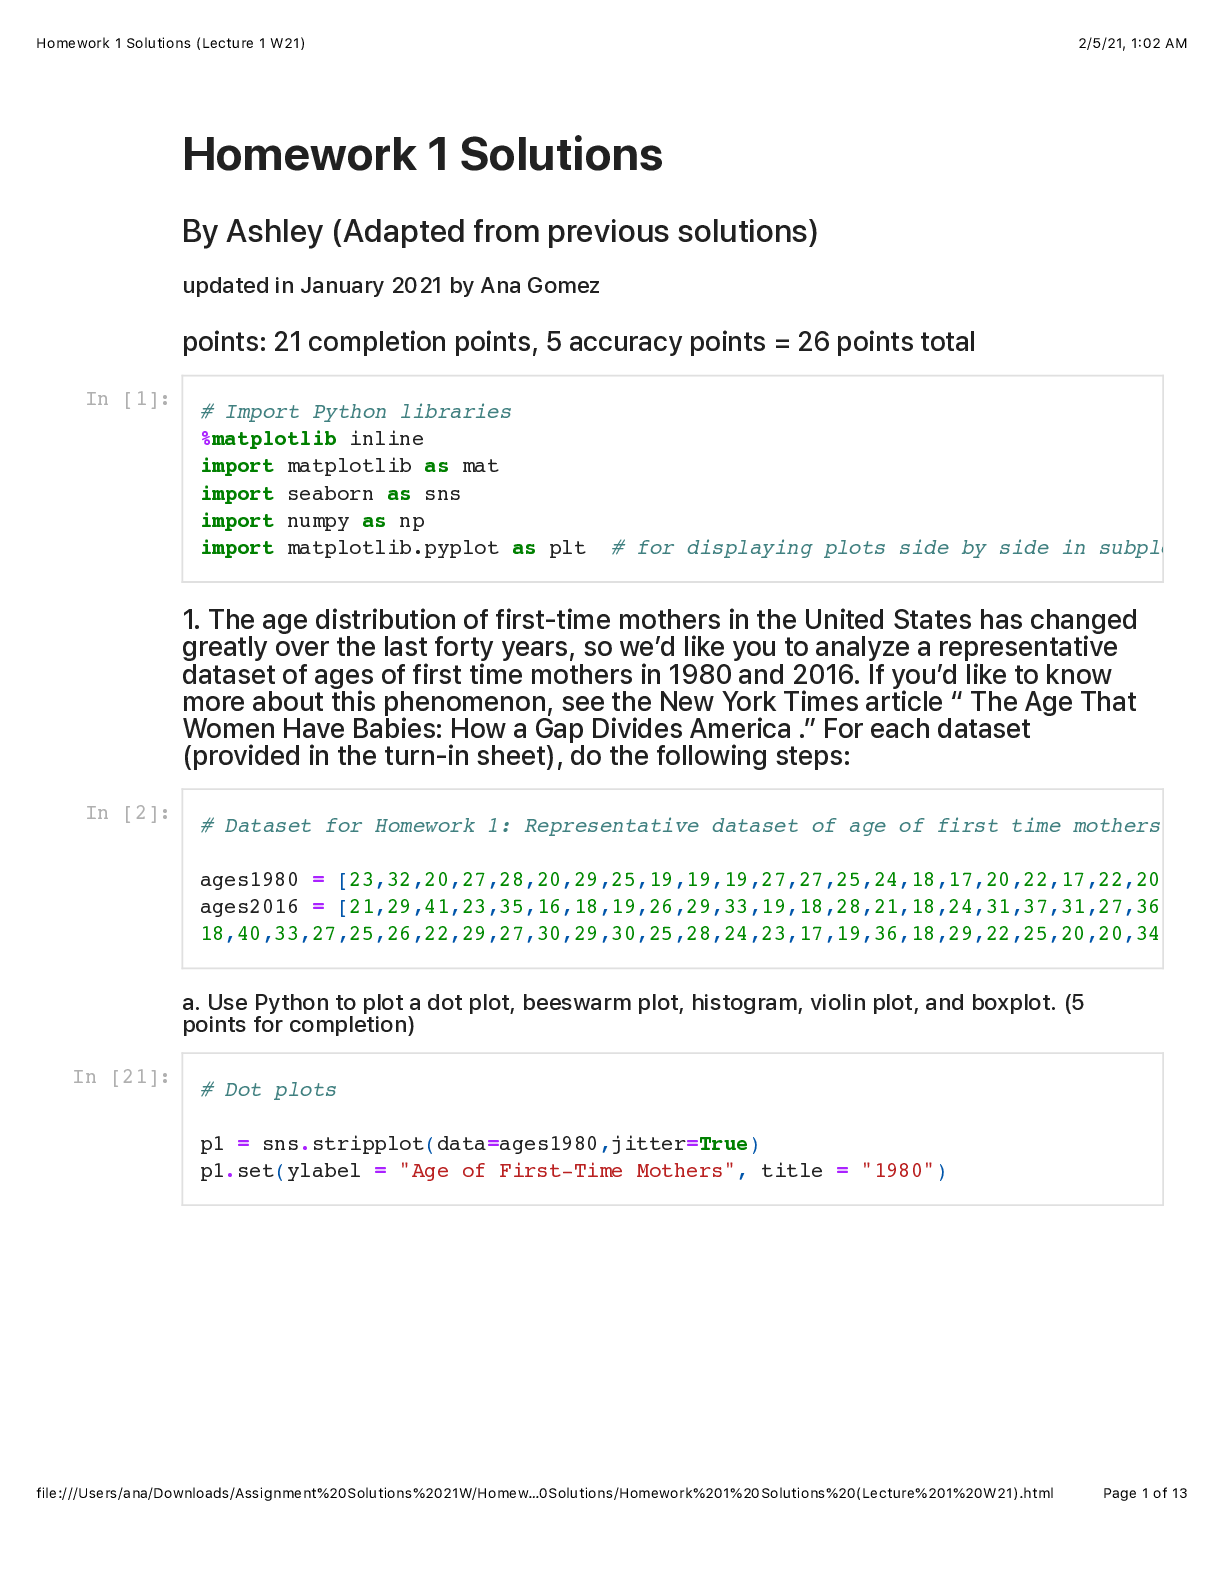
Buy this Document to get the Full Access Instantly
Provided by Students Who Aced it
We Verify Document Content to Gurantee Accuracy
Reviews( 0 )
Document information
Connected school, study & course
About the document
Uploaded On
Jul 09, 2021
Number of pages
13
Written in
All

Additional information
This document has been written for:
Uploaded
Jul 09, 2021
Downloads
0
Views
272
Topic Tags
Recommended For You
Get more on Solutions Guide »
Solution Manual For Income Tax Fundamentals 40th Edition by Ge...

Test Bank For Income Tax Fundamentals 40th Edition by Gerald E...

NR 603 Week 3 Quiz (Jan 2021)/Advanced Clinical Diagnosis And...

NR 603 Week 1 Quiz (Jan 2021)/ Advanced Clinical Diagnosis The...

.png)
Pearson Edexcel Level 3 GCE 9EL0/02 English Language and Liter...
Pearson Edexcel Level 3 GCE 9EL0/02 English Language and Liter...
Pearson Edexcel Level 3 GCE 9EL0/02 English Language and Liter...
Pearson Edexcel Level 3 GCE 9EL0/02 English Language and Liter...

TEST BANK for Mass Media Law 21st Edition by Calvert, Kozlowsk...

Mass Media Law 21st Edition by Calvert, Kozlowski, Silver | TE...

Test Bank for Mass Media Law 21st Edition Calvert All Chapters
.png)