Social Sciences > Solutions Guide > LS 40 (Life Science) Homework 4 Solutions (Lecture 1 W21)updated in Jan 2021 (All)
LS 40 (Life Science) Homework 4 Solutions (Lecture 1 W21)updated in Jan 2021
Document Content and Description Below
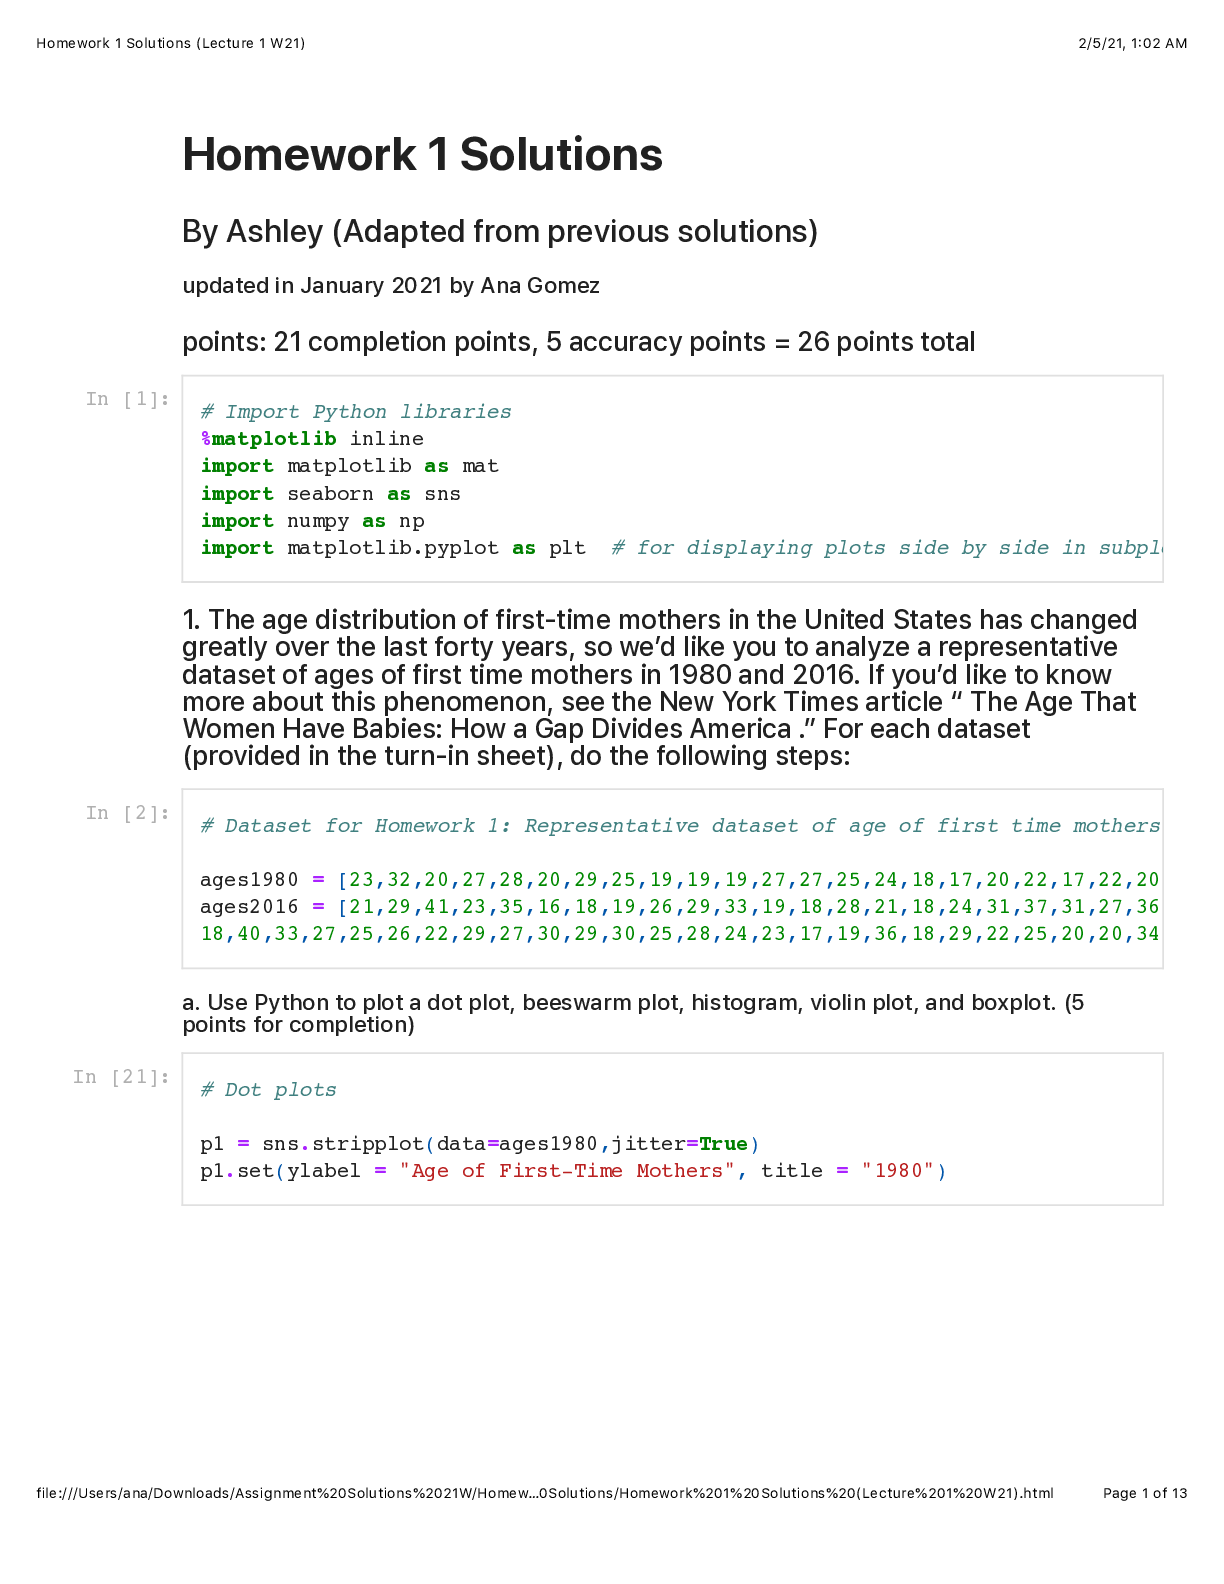
LS 40 (Life Science) Homework 4 Solutions (Lecture 1 W21 Homework 4 Solutions By Ashley Van Reynolds (Adapted from Previous Solutions) updated in Jan 2021 Scoring: * Completion: 30/30 LS 40 (L ... ife Science) Homework 4 Solutions (Lecture 1 W21 * Accuracy: 10/10 #4a,b,c,e,f, #5e,f,g </font> (array([False, False, False]), array([0.0684, 1. , 0.066 ]), 0.016952427508441503, 0.016666666666666666) (array([False, False, False]), array([0.1368, 1. , 0.066 ]), 0.016952427508441503, 0.016666666666666666) In [2]: pvals = [0.0456,1,0.022] import statsmodels.stats.multitest as smm smm.multipletests(pvals,alpha=0.05,method='fdr_bh') Out[2]: In [3]: smm.multipletests(pvals,alpha=0.05,method='bonferroni') Out[3]: In [1]: # Dataset: Plant and macroinvertebrate species richness in ephemeral and permanent wetlands in Wisconsin, 2013 plant_eph = [34,51,20,47,22,19,24,18,33,45,36,42,30,25,44,33,47,35,51,15,24,13 plant_perm = [31,40,43,37,23,45,53,46,44,25,47,34,41,31,37,34,42,37,14,29,18,15 invert_eph = [33,27,25,32,26,29,24,25,17,21,18,21,21,18,27,20,31,26,27,30,29,16 invert_perm = [33,25,19,30,29,33,32,30,30,29,32,34,34,32,36,34,33,34,34,31,34, # Diarrhea dataset from Figueroa-Quintanilla and others (1993) control = [131,178,127,403,413,60,859,247,278,66,210,237,105,79,307,90,244,165 treatment = [237,110,106,1099,65,74,156,60,98,234,105,79,258,61,60,196,57,55,55 In [28]: import matplotlib as mat #import matplotlib import seaborn as sns #import seaborn import numpy as np #import numpy import matplotlib.pyplot as plt Homework 4 Solutions (Lecture 1 W21) 2/5/21, 1:03 AM file:///Users/ana/Downloads/Assignment%20Solutions%2021W/Homew…0Solutions/Homework%204%20Solutions%20(Lecture%201%20W21).html Page 2 of 22 1. The of an infectious disease is the mean number of new people infected by a patient with the disease. a. Suppose two diseases have the same . What might this fact hide? 1 completion point The basic reproduction number , is the average number of new patients who will get infected from a single infected patient in a fully susceptible population. For example, =2 means on average every case will create two new cases. If is greater than 1, the infection will initially spread in this population. If it’s less than 1, the infection will eventually die out. Two diseases with the same may have very important differences. The most obvious is that is an average. The distribution for number of new cases may not be bell-shaped, thus using (mean) to describe the central tendency may be misleading. Suppose a virus has an of 2, meaning that every single infected person passes the virus to two new cases. It could also mean that one infected person is a “super-spreader” who infects 100 people, while 49 infected people infect no one. very difficult to estimate. Usually, we calculate it based on data from an outbreak that has already occurred (recently or not) but local conditions in a different place can affect the spread significantly, as well as changes in behavior such as quarantining. assumes, by definition, a single patient zero dropped in a fully susceptible population. For a new disease such as COVID-19 that approximation is good, but for others it can be very misleading [Show More]
Last updated: 3 years ago
Preview 1 out of 22 pages

Buy this document to get the full access instantly
Instant Download Access after purchase
Buy NowInstant download
We Accept:

Reviews( 0 )
$13.50
Can't find what you want? Try our AI powered Search
Document information
Connected school, study & course
About the document
Uploaded On
Jul 09, 2021
Number of pages
22
Written in
All

Additional information
This document has been written for:
Uploaded
Jul 09, 2021
Downloads
0
Views
146


 V1-V2.png)


.png)
