Biological Psychology > QUESTIONS & ANSWERS > LS 40 (Life Science) Homework 2 Solutions (Lecture 1 W21)updated in Jan 2021 (All)
LS 40 (Life Science) Homework 2 Solutions (Lecture 1 W21)updated in Jan 2021
Document Content and Description Below
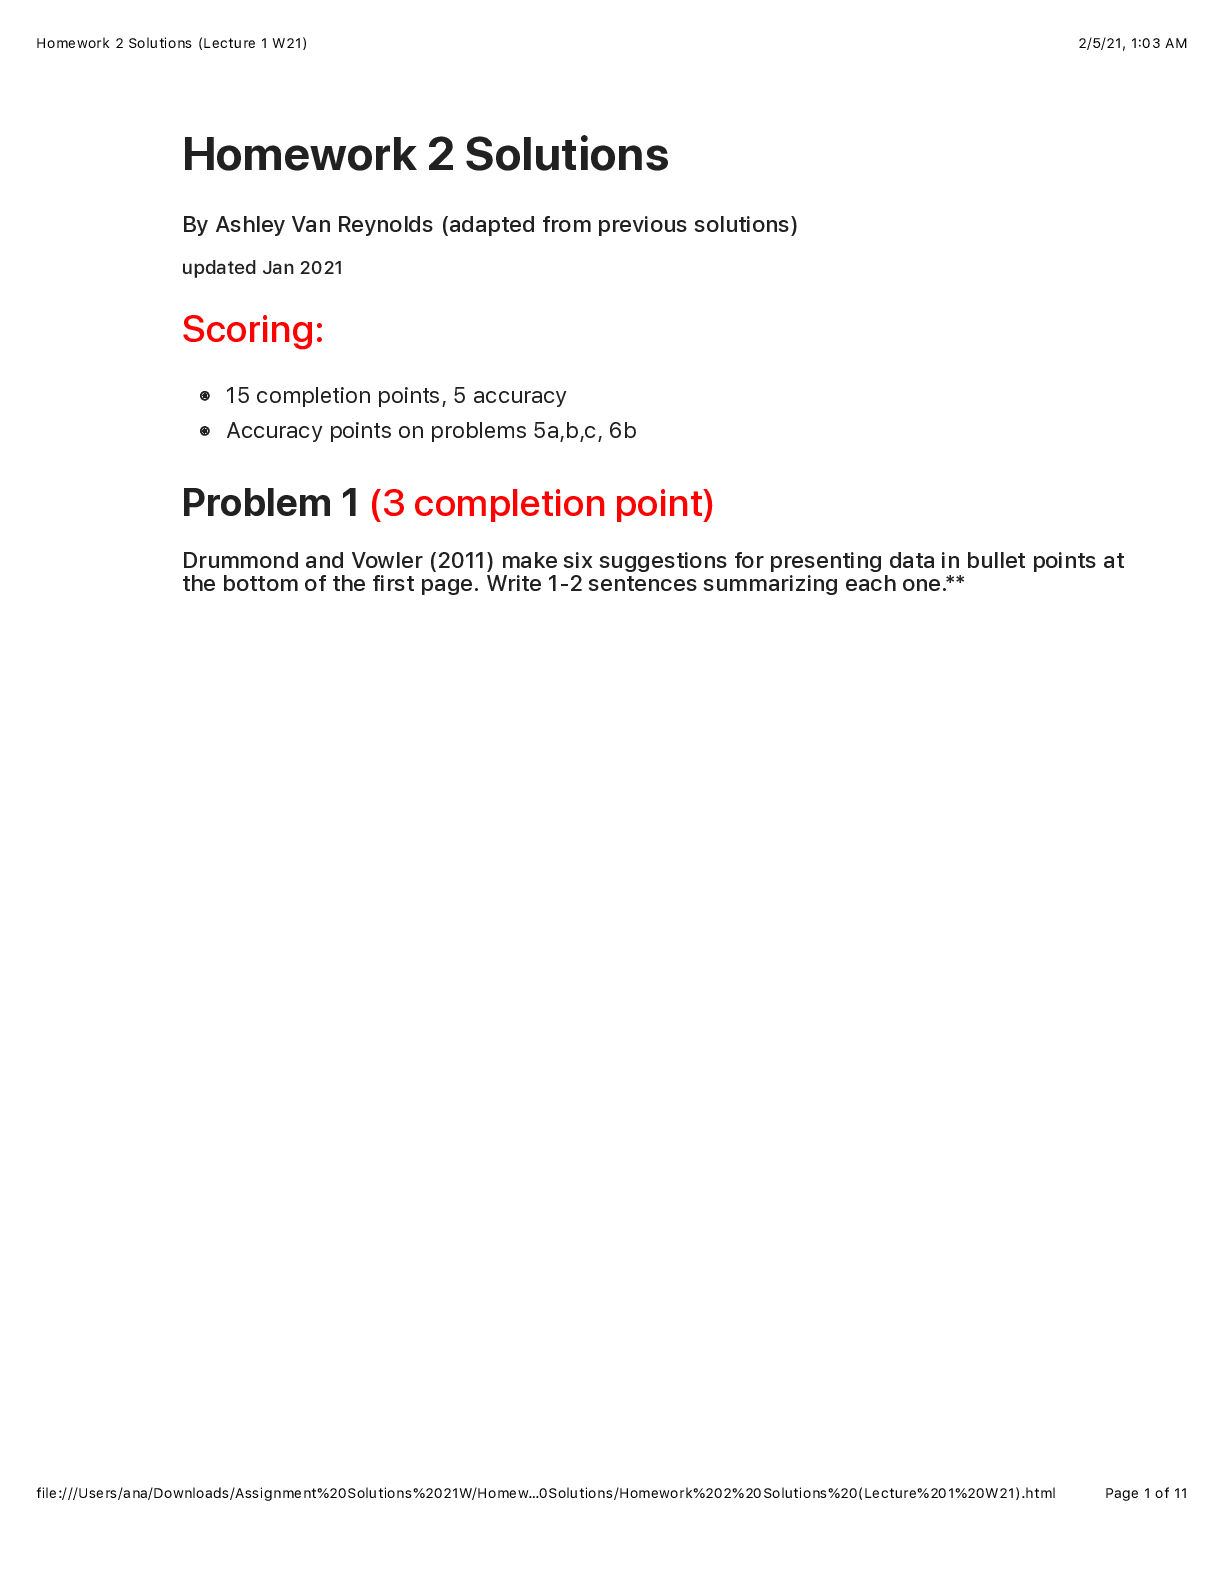
Homework 2 Solutions By Ashley Van Reynolds (adapted from previous solutions) updated Jan 2021 Scoring: 15 completion points, 5 accuracy Accuracy points on problems 5a,b,c, 6b Problem 1 (3 compl... etion point) Drummond and Vowler (2011) make six suggestions for presenting data in bullet points at the bottom of the first page. Write 1-2 sentences summarizing each one.** Homework 2 Solutions (Lecture 1 W21) 2/5/21, 1:03 AM file:///Users/ana/Downloads/Assignment%20Solutions%2021W/Homew…0Solutions/Homework%202%20Solutions%20(Lecture%201%20W21).html Page 2 of 11 1. Display data in their raw form If possible, show each individual data point. Otherwise, summarize (as with a histogram) without adjusting or eliminating values or just giving summary values. 2. A dot plot is a good start Dot plots are good visualizations because they show data and its features in a transparent way, without hiding the data or withholding information.. However, there are better options if you have a lot of data points. 3. 'Dynamite plunger plots' conceal data Using bar plots with error bars hides valuable information about the underlying data (such as the distribution of the data) and at worst is misleading. These provide almost no information, hiding the number of participants, confidence intervals, spread of data, and several other factors. 4. Check the pattern of the distribution of the values The distribution is an important feature of the data and should always be inspected to study skew, modality, tails, variance, and outliers. Checking the pattern could indicate other factors affecting the values or sample. 5. Take care when samples are small The smaller the sample, the less certain you are about the distribution, measures of central tendency, and any statistical analysis that is applied. Small samples can very easily fail to be reflective of a population. 6. Choose appropriate measures of distribution or dispersion The standard deviation (SD) and standard error of the mean (SEM) are appropriate only if the data are bell-shaped (i.e., distribution is unimodal, symmetric, and thin tailed). Confidence intervals are preferable and can be used if the sample size is sufficiently large. Be aware of the different types of tests and measurements you can use for examining data and choose appropriate ones for the test you are conducting and its possible future uses. [Show More]
Last updated: 2 years ago
Preview 1 out of 11 pages

Buy this document to get the full access instantly
Instant Download Access after purchase
Buy NowInstant download
We Accept:

Reviews( 0 )
$12.00
Can't find what you want? Try our AI powered Search
Document information
Connected school, study & course
About the document
Uploaded On
Jul 09, 2021
Number of pages
11
Written in
Additional information
This document has been written for:
Uploaded
Jul 09, 2021
Downloads
0
Views
79


