Mathematics > AQA QUESTION and MARK SCHEMES > Maths 221 Statistics For Decision Making week 2 (All)
Maths 221 Statistics For Decision Making week 2
Document Content and Description Below
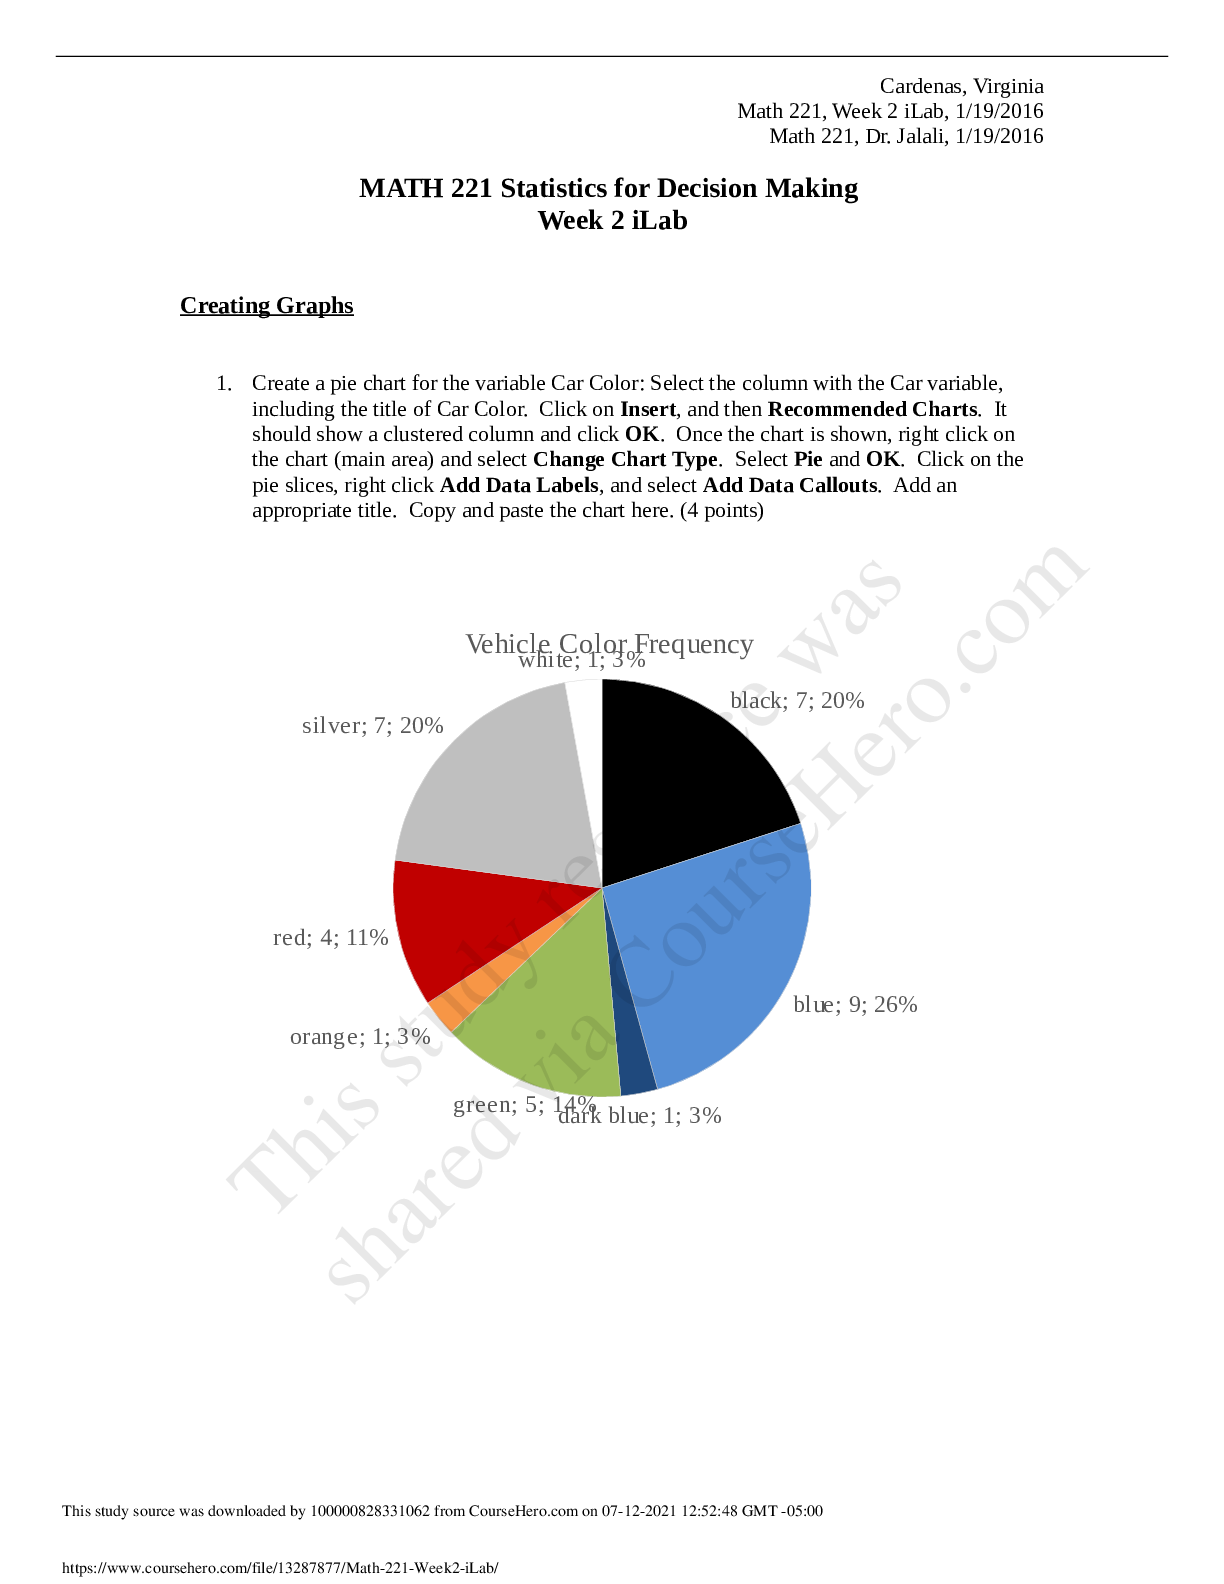
Create a histogram for the variable Height. You need to create a frequency distribution for the data by hand. Use 5 classes, find the class width, and then create the classes. Once you have the clas ... ses, count how many data points fall within each class. It may be helpful to sort the data based on the Height variable first. Create a new worksheet in Excel by clicking on the + along the bottom of the screen and type in the categories and the frequency for each category. Then select the frequency table, click on Insert, then Recommended Charts and choose the column chart shown and click OK. Right click on one of the bars and select Format Data Series. In the pop up box, change the Gap Width to 0. Add an appropriate title and axis label. Copy and paste the graph here. (4 points) [Show More]
Last updated: 3 years ago
Preview 1 out of 6 pages
Buy this document to get the full access instantly
Instant Download Access after purchase
Buy NowInstant download
We Accept:

Reviews( 0 )
$4.00
Can't find what you want? Try our AI powered Search
Document information
Connected school, study & course
About the document
Uploaded On
Jul 12, 2021
Number of pages
6
Written in
All
Additional information
This document has been written for:
Uploaded
Jul 12, 2021
Downloads
0
Views
219


