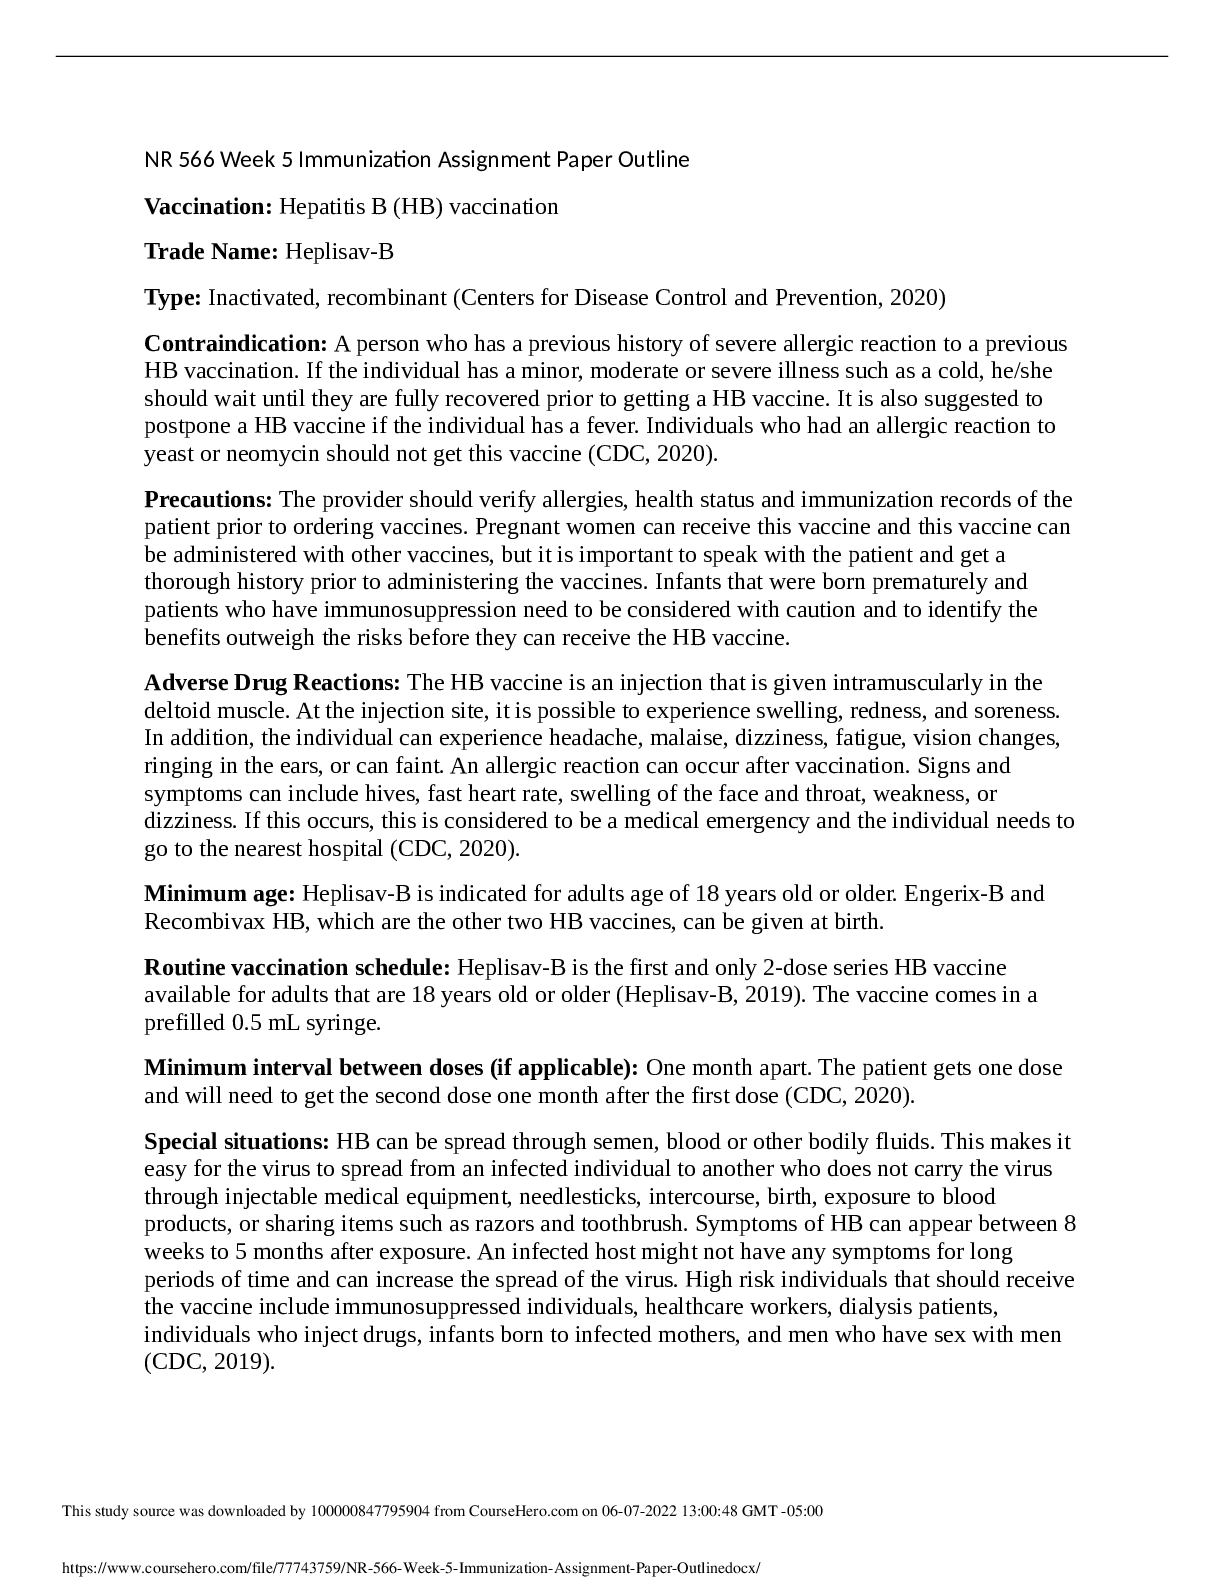
*NURSING > CASE STUDY > WGU D209 - Population Health Data Brief Template - A. SAN BERNARDINO COUNTY, CALIFORNIA (All)
WGU D209 - Population Health Data Brief Template - A. SAN BERNARDINO COUNTY, CALIFORNIA
Document Content and Description Below
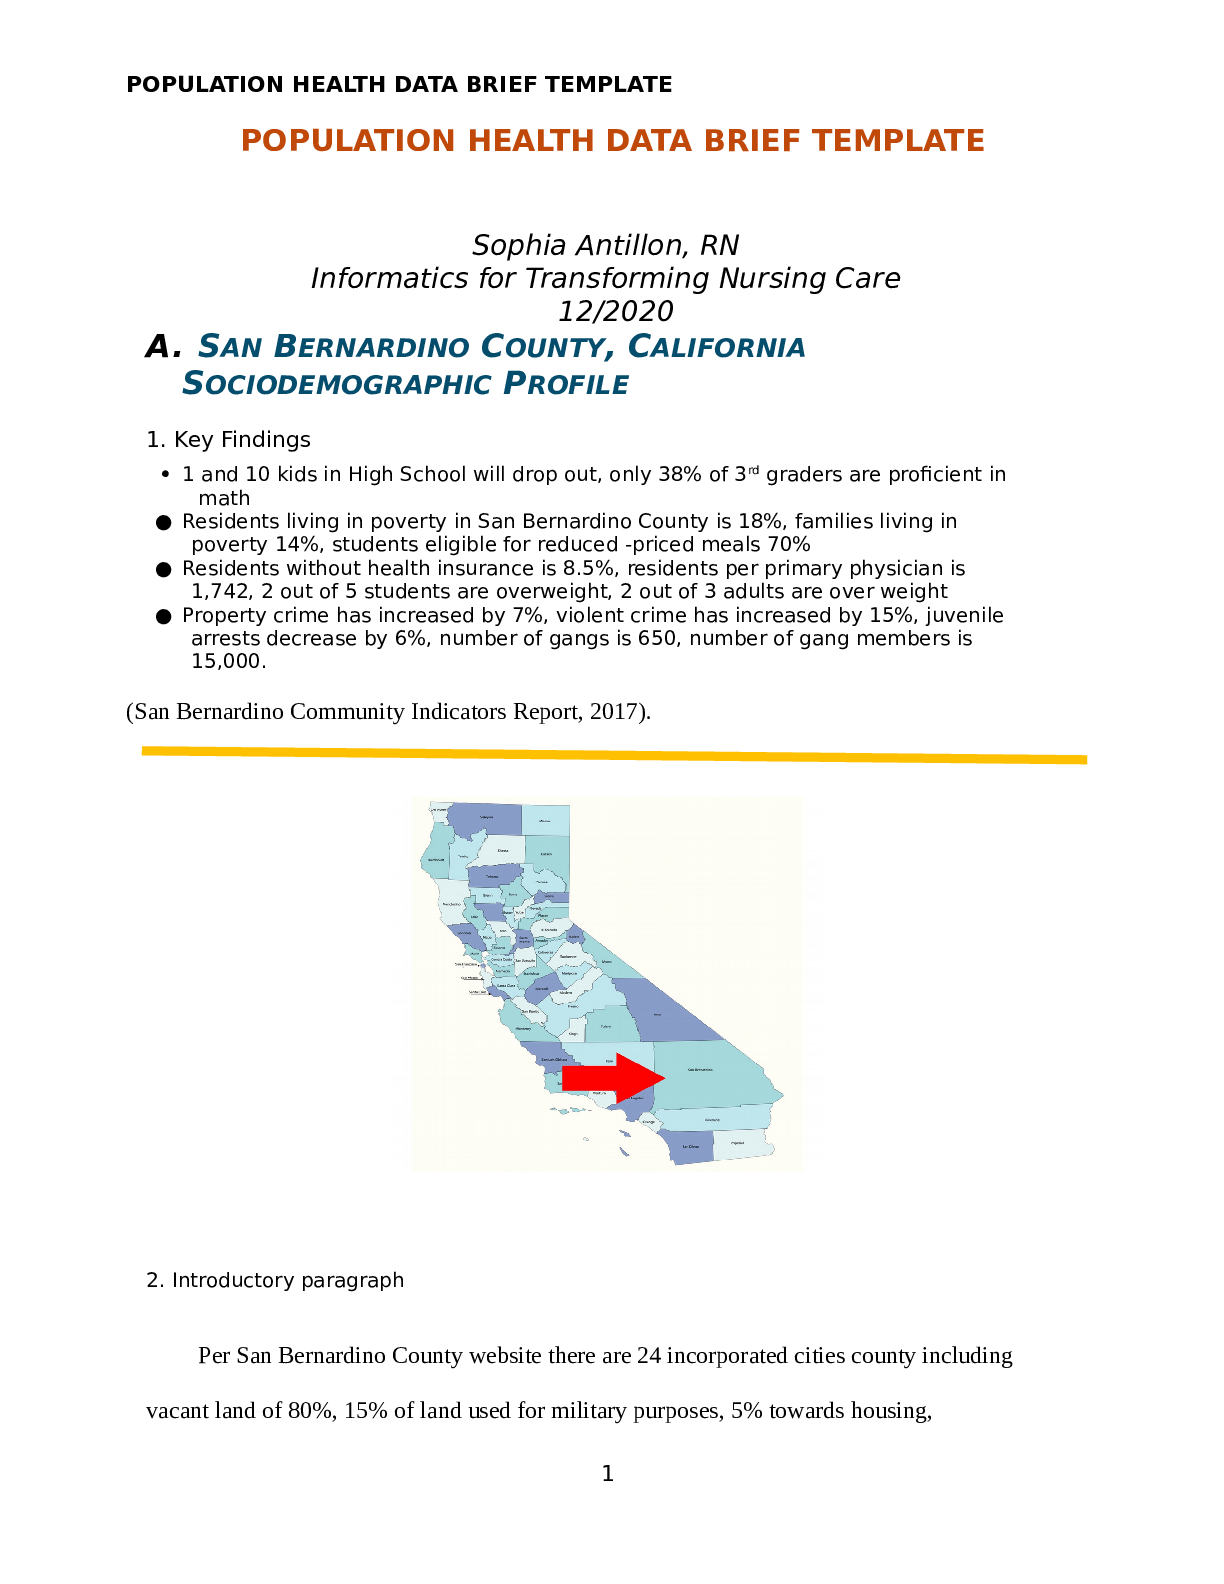
POPULATION HEALTH DATA BRIEF TEMPLATE A. SAN BERNARDINO COUNTY, CALIFORNIA SOCIODEMOGRAPHIC PROFILE 1. Key Findings • 1 and 10 kids in High School will drop out, only 38% of 3rd graders are p... roficient in math ● Residents living in poverty in San Bernardino County is 18%, families living in poverty 14%, students eligible for reduced -priced meals 70% ● Residents without health insurance is 8.5%, residents per primary physician is 1,742, 2 out of 5 students are overweight, 2 out of 3 adults are over weight ● Property crime has increased by 7%, violent crime has increased by 15%, juvenile arrests decrease by 6%, number of gangs is 650, number of gang members is 15,000. (San Bernardino Community Indicators Report, 2017). 2. Introductory paragraph Per San Bernardino County website there are 24 incorporated cities county including vacant land of 80%, 15% of land used for military purposes, 5% towards housing, industrial utilities, transportation and agriculture. San Bernardino County population in 2017 was 2,160,256 with an estimated growth of 28% between the years 2020-2045 (San Bernardino Community Indicators Report, 2017). Latinos make up the largest ethnicity in the region at 51% and are estimated to increase to 57% of total population by 2045 (San Bernardino Community Indicators Report, 2017). San Bernardino percentage of change is greater when compared to the United States (U.S.) as a whole. Areas in which San Bernardino County rates in a negative manner compared to the United States include; Persons under the age of 18, is 4% higher, Hispanics alone rate 35% higher, foreign born persons is 7.5% higher in San Bernardino County, people over the age of 65 years old is lower by 0.2% than the remaining U.S., high school graduates are lower by 8% in San Bernardino County (San Bernardino Community Indicators Report, 2017). Those living in poverty are higher than the remaining U.S. by nearly 5% (San Bernardino Community Indicators Report, 2017). 3. Sociodemographic Profile Table Population Characteristics San Bernardino County United States Population Estimates 2,180,08 5 328,239,5 23 Population Percent Change 7.1% 6.3% Percentage of Persons Under the Age of 18 26.1% 22.3% Percentage of Persons 65 Years and Over 11.9% 16.5% Percentage of Women 50.2% 50.8% Percentage White Alone 76.6% 76.3% Percentage Hispanic Alone 54.4% 18.5% Percentage of Foreign-Born Persons 21% 13.5% Percentage Language Other Than English Spoken at Home, Percent of Persons Age 5+ n/a n/a Percentage of Houses with a Computer 91.2% 88.8% Percentage with High School Graduate or Higher 79.5% 87.7% Percentage with a Disability, Under Age 65 Years 7.4% 8.6% Percentage without Health Insurance, Under Age 65 Years 9.3% 9.5% Percentage in Civilian Labor Force Age 16 Years+ 60.1% 62.9% Percentage of Women in Labor Force Age 16 Years+ 54.4% 58.2% Total Healthcare and Social Assistance Revenue 11,199,3 15 2,040,441, 203 Total Retail Sales Per Capita $11,714 $13,443 Per Capita Income in the Past 12 Months n/a n/a Percentage of Persons in Poverty 14.9% 10.5% Population Per Square Mile 101.5 87.4 (SAN BERNARDINO COMMUNITY INDICATORS REPORT, 2017). San Bernardino County population is smaller than the remaining United States (U.S.), yet a significant number of people at 2,180,085 (San Bernardino Community Indicators Report, 2017). The Percentage change is less than 1% difference than the U.S. San Bernardino County has a larger population of people under the age of 18 years old, however a smaller percentage of 11.9% of persons over the age of 65 than the remaining U.S. (San Bernardino Community Indicators Report, 2017). The U.S. and San Bernardino County have similar percentage of women and Whites, with San Bernardino having nearly 45% more Hispanics than the rest of the Nation, 8% more of foreign- born individuals, (San Bernardino Community Indicators Report, 2017) with no data available for the percentage of English spoken at home. Similar amount of people with computers in homes in San Bernardino trailing behind in high school graduates in comparison to the U.S. (San Bernardino Community Indicators Report, 2017). Less than 1% difference of people with disabilities in comparison along with similar percentage of people under the age of 65 years without health insurance (San Bernardino Community Indicators Report, 2017). Similar percentage of civilian labor force with individuals working at the age of 16 years or older, woman in the labor force above age of 16. Total health social assistance is lower in San Bernardino County with retail sales per capita less than $2,000 difference in San Bernardino compared to the U.S. (San Bernardino Community Indicators Report, 2017). People living in poverty is higher in San Bernardino by nearly 5% the population per square mile is greater in San Bernardino by nearly 12% compared to the U.S. (San Bernardino Community Indicators Report, 2017). B. COUNTY HEALTH TRENDS & RANKINGS The city of San Bernardino is in Southern California, near the San Bernardino Mountains. For research purposes I utilized San Bernardino County Indicators from years 2017 and 2018. Seven health trends I will be focusing on are violence, teen pregnancies, sexually transmitted disease, unemployment, and health disease such as obesity related to physical inactivity and lack of exercise opportunities. Affordable housing is an area of concern as rent continues to increase along with cost of homes. Accessible health care for San Bernardino residents (San Bernardino Community Indicators Report, 2017). These areas of focus were some of the highest numbers in which have trended in the wrong direction for nearly a decade or continue to trend in the wrong direction. San Bernardino County rankings are lower than other counties in California and worse off than other States in the Nation. Sources used is the San Bernardino County website for their graphs, clinical indicators, trends, and data. 2. Discussion of Health Trends Violence in San Bernardino County VIOLENT CRIME VIOLENT CRIME COMPARISON (PER 1,000 RESIDENTS) National Median: 4 SAN BERNARDINO VIOLENT CRIMES POPULATION: 215,941 Violence in San Bernardino County is worse in comparison for the rest of the U.S. Residents fear of crime is higher than years before, as residents of San Bernardino show an increased “fear of being a victim of a violent crime” dropping from 42% to 40% (San Bernardino Community Indicators Report, 2018). Number of Gangs has dropped from 700 in 2007 to 650 in 2016, homicides gang-related have dropped from 36 in 2007 to 30 in 2016 (San Bernardino Community Indicators Report, 2018). Per 1,000 residents’ violent crimes in San Bernardino is 15.36% compared to the entire State of California of 4.47% (Neighborhoodscout, 2020). The chances of becoming a victim of crime are 1 in 65 in San Bernardino compared to 1 in 224 in the State of California (Neighborhoodscout, 2020). San Bernardino is trending in a negative direction and needs improvement. Teen Pregnancy in San Bernardino County Teen pregnancies in San Bernardino County are higher than in the United States overall. In San Bernardino County is 21.7 out of a rate of 1,000, United States 20.3 out of a rate of 1,000 (Kidsdata, 2016). Data shows a downward trend from 1995 to 2016, the rate has declined significantly. In 1995 the rate per 1,000 teen girls ages 15-19 years old was 80 in San Bernardino County and 55 in the United States, most recent information shows in 2016 both the United States and San Bernardino County are at less than 25 (Kidsdata, 2016). Though data shows San Bernardino County is worse than the U.S. it is still trending in the right direction with improvement. Sexually Transmitted Disease: Gonorrhea Rates of the sexually transmitted disease particularly gonorrhea, have increased from years 2015-2017 from 125 to 184 incidents per 100,000 cases (San Bernardino County, Public Health Department communicable disease section, 2018). Other sexually transmitted disease that have risen include chlamydia and syphilis (San Bernardino County, Public Health Department communicable disease section, 2018). African Americans rank highest in contracting gonorrhea, although from 2015 to 2017 the numbers have declined. In 2015 Blacks had 270 incidents per 100,000 people, in 2017 the number of incidents has declined to 225.1 incidents per 100,000 people (San Bernardino County, Public Health Department communicable disease section, 2018). Except for Hispanics, all other races incidents of disease have declined, overall, the numbers have climbed and need improvement. Unemployment in San Bernardino County Unemployment rate continues to decline from 2010 when it was at its peak at 13% and in 2017 unemployment was as low as 4.5% (San Bernardino Community Indicators Report, 2017). Per San Bernardino Community Indicators Report from years 2008 towards the end of 2010, jobs lost fell to its lowest since 2003. In 2009 jobs lost were at its worst at 40,000, while housing permit grants fell below 1,000 in 2010 (San Bernardino Community Indicators Report, 2017). Cost of housing in San Bernardino County Cost of housing in 2018 was a median of $353,400 an increase from the previous year by about $25,000 (San Bernardino Community Indicators Report, 2018). This chart represents where San Bernardino is as compared to the United States, with orange color representing San Bernardino County. Property taxes are nearly 4% more in San Bernardino as compared to the rest of the United States (San Bernardino Community Indicators Report, 2018). Population to primary care physician in San Bernardino County In San Bernardino County there are 26 hospitals serving residents including two trauma centers. In California 82.1% of people under the age of 65 years old have a usual place to go for health care services, in San Bernardino County 10.4% of residents under the age of 65 years old delay or do not get the medical care they require (San Bernardino County Indicators Report, 2017). Health rankings, San Bernardino County ranks number 40 out of 58 counties in California, not a positive or healthy ranking (County Health Ranking Report, 2020). Access to exercise opportunity in San Bernardino County San Bernardino County is ranked 37 in the State of California for highest obesity rates (County Health Rankings, 2020). The obesity in San Bernardino County is in relation to physical inactivity, leading to obesity, to diabetes and other health diseases in which access to exercise opportunities lags. San Bernardino County has 88% access to exercise opportunities (County Health Rankings, 2020). Compared to California, San Bernardino County is of 36% for adult obesity, compared to the average in the California being 28% (Food security and obesity in San Bernardino County, 2017). Races in which are the highest in obesity in San Bernardino County include 45.5% are of African Americans, 40.5% Latinos, 29.3% White and 15.2% Asians (Food security and obesity in San Bernardino County, 2017). San Bernardino County is a large county with an impressive 83% high school graduate rate, however still a very low rate of college graduates (San Bernardino Community Indicators, 2018). Health ranking in San Bernardino County for length of life is 33 out of 58, which is near the middle in ranking and the Health Outcomes for San Bernardino County (2020) is 40 out of 58 in which is a poor rating. San Bernardino Community Indicators (2018) show the cost of living continues to climb to 28% with a median household income only at $63,857/year. San Bernardino population characteristics are overall worse than the rest of the United States. Teen pregnancy continues to decline each year. Number of gangs have declined however violence continues to increase. San Bernardino Community Indicators (2018) shows sexually transmitted disease of gonorrhea continues to increase each year. Per San Bernardino Community Indicators (2018), jobs created declined in 2008-2010 and since have steadily increased while housing permits have not increased over the past 8 years. San Bernardino Community Indicators (2018) states cost of property taxes have increased from 2013 to 2018 and have surpassed the average for the United States at nearly $3,000+/ year, each year cost of homes increases an average of $25,000. There are 1747 people per physician in San Bernardino County which is worse than the average ratio nationally of 1050 per physician (San Bernardino Community Indicators, 2018). 3. Health Trends (Visual Graphs) Unemployment in San Bernardino County compared to United States and California Unemployment rate peaked in years 2008 thru 2014 and continued to trend downwards each year. Trending in the right direction. The State of California is better off than the county of San Bernardino, but still worse than the United States by nearly 5%. (County Health Ranking Report, 2020). Adult obesity in San Bernardino County compared to United States and California Data began in 2004 and the County continues to increase each year at nearly 30% obesity in 2018, which is a negative trend (County Health Ranking Report, 2020). With obesity comes other health concerns such as diabetes, heart disease, stroke and heart attacks. Obesity is related to the low access to exercise opportunities for residents in San Bernardino County and low physical activity level of those individuals. Primary Care Physicians in San Bernardino County compared to United States and California Ratio of primary care physicians to patients in San Bernardino County is above both the United States and California, of 1,710 patients to one physician (County Health Ranking Report, 2020). There is not improvement in the numbers in the past 7 years. Across the graph between San Bernardino County, California and the United States numbers have not improved nor declined over the past 7 years. Violent crime rate in San Bernardino County compared to United States and California Violent crimes in San Bernardino are on a steady incline with only a small improvement between 2009 to 2014. No data available for 2015 and in 2016 there was an increase of 100 incidents (County Health Ranking Report, 2020). The United States and State of California fluctuate in violent crimes rate each year, with an overall improvement of 100 less incidents for the last 7 years (County Health Ranking Report, 2020). Sexually transmitted infections in San Bernardino County compared to United States and California Since 2007 for the past 10 years the rates of chlamydia continue to rise. San Bernardino County rate from 2010 to 2017 surpassed the United States and California by nearly 200,000 cases (County Health Ranking Report, 2020). There is no improvement for the United States, California, or San Bernardino County in 10 years of data. In 2007 San Bernardino County had 406 per 100,000 population and in 2017 has increased to 609 cases per 100,000 population (County Health Ranking Report, 2020). This trend is going in a negative direction. Physical inactivity in San Bernardino County compared to United States and California San Bernardino County falls below the average line for physical activity compared with the United States however ranks above the California average. Physical activity has increased from 2015 to 2016 by only 2%. (County Health Ranking Report, 2020). As individuals continue to live an inactive lifestyle, other health problems will develop including arthritis, future back and knee problems, leading to preventable surgeries. Median Household Income San Bernardino County median household is $63,857 nearly a 16% increase from 10 years ago (San Bernardino County Indicators Report, 2018). Though an increase as opposed to the rest of the United States, this income is still lower than the rest of the State of California, which affects family’s ability to purchase a home. Average cost of homes in San Bernardino County begin at the low $300 thousand up to $600 thousand or more (San Bernardino County Indicators Report, 2018). The income made cannot keep up with the average cost of a home for this community. Adult Obesity Centers of Disease Control and Prevention. (2018). • health trend 1 Violence: Residents fear of crime is higher than years before as residents of San Bernardino show there is an increased “fear of being a victim of a violent crime” has dropped from 42% to 40%. Number of Gangs has dropped from 700 in 2007 to 650 in 2016, as well as homicides that are gang-related have dropped from 36 I 2007 to 30 in 2016 (San Bernardino Community Indicators Report, 2017). Improvement is related to new programs being introduced to the youth, such as Friday Night Lights. • health trend 2 Teen pregnancies: Teen pregnancies in San Bernardino California are higher than in the United States. I San Bernardino County it is 21.7 out of a rate of 1,000. The United States is 20.3 out of a rate of 1,000 (Kidsdata, 2016). Improvement is related to county programs educating the youth and providing preventative products such as birth control and condoms to the youth. • health trend 3 Sexually transmitted disease: Rates of sexually transmitted disease such as gonorrhea, in total has increased from years 2015-2017 from 125 to 184 incidents per 100,000 cases (San Bernardino County, Public Health Department communicable disease section, 2018) Other sexually transmitted disease that have risen include chlamydia and syphilis (San Bernardino County, Public Health Department communicable disease section, 2018). As there are programs and decrease in teen pregnancies, the youth still need more education of sexual transmitted infections, as there has not been cuts made to these programs. • health trend 4 Unemployment: Unemployment rate continues to decline from 2010 when it was at its peak at 13% and in 2017 unemployment was as low as 4.5% (San Bernardino Community Indicators Report, 2017). Due to COVID-19 unemployment has increased immensely causing nearly all areas of businesses to shut down or limit capacity. The cause was the housing market crashing in 2008, and the current pandemic in 2020 these numbers will only further increase in a negative trend. • health trend 5 Health disease: Inactivity and lack of exercise opportunities leads to an increase in obesity and then diabetes. Diabetes continues to be prevalent in our Country as well as a focus in San Bernardino County. In a survey from 2014-2015 it was found 20.7% of those with diabetes were above the age of 65 (San Bernardino Community Indicators Report, 2017). County needs more financing, grants, scholarships towards access for exercise opportunities to decrease physical inactivity. • health trend 6 Affordable Housing: Cost of housing in 2018 was a median of $353,400 an increase from the previous year by about $25,000, property taxes are nearly 4% more in San Bernardino as compared to the rest of the United States (San Bernardino County Indicators Report, 2018). California has ideal weather and property value continues to rise in a positive manner, however if residents can not increase their income to keep up with the cost of living in California, they will need to look for housing in other states. • health trend 7 Accessible health care: In San Bernardino County there are 26 hospitals serving residents including two trauma centers. In California 82.1% of people under the age of 65 years old have a usual place to go for health care services (San Bernardino County Indicators Report, 2018). However in San Bernardino County 10.4% of residents under the age of 65 years old delay or do not get medical care they require (San Bernardino County Indicators Report, 2018). Many health care programs, resources are online and the age group of 65+ years old do not know how to access these sources, do not have a computer access to use these resources. C. Health Factors 1. Health Factors Table Factors Influencing Health County Data Top U.S. Performer State Data Percentage Adult Smoking 13.1 % 15.6% 17. 5 % Percentage with Access to Exercise Opportunities 88% 91% 93% Percentage Excessive Drinking 17.3 % 23.6% 18 % Primary Care Physicians (Ratio of Population to 1 Physician) 1747 :1 2300:1 148 3: 1 Percentage with High School Graduation 89.9 % 88% 83 % Percentage with Some College 38% 67% 64. 4% Percentage with Unemployment 4.1% 3.9% 4.3 % Percentage of Children in Single- Parent Households 31.5 % 23% 34 % Social Associations (Number of Associations Per 10,000) n/a n/a n/a Violent Crime (Number of Violent Crimes Per 100,000) 2585 .7 1888.6 249 6.7 Injury Deaths (Number of Injury Deaths Per 10,000) 29.1 53.5 30. 9 Percentage of Children Eligible for Free or Reduced-Price Lunch 70% 34th out of 35 countr ies 72. 1% Air Pollution (Average Daily Density of Air Pollutants) 13.6 0 1.87 8.9 8 Percentage with Severe Housing Problems 48% 26.7% 41. 6% (San Bernardino County Indicators Report, 2018). 2. Comparison of Data San Bernardino County is lower than top perform of the United States and the State of California for percentage of those with some college education. San Bernardino is 38% while the top performer is 67% (San Bernardino County Indicators Report, 2018). With less education this provides for less opportunity for a higher income. Less income related to housing problems. San Bernardino County indicators report (2018) states there is severe housing problems at 48% while the State is 41.6% and the top U.S. performer is 26.7%. Violent crime in San Bernardino is 2585.7 per 100,000 higher than the top U.S. performer but nearly the same for the State of California (San Bernardino County Indicators Report, 2018) . Lower level of education leads to higher crime areas. Children eligible for free meals or reduced cost of meals is 70%, while the U.S. is 34 out of 35 countries however the State of California is at 72.1% (San Bernardino County Indicators Report, 2018). Less education leads to less income, which leads to less food availability for children. Unemployment in San Bernardino County is 4.1% with the top performer being 3.9% and the State at 4.3% (San Bernardino County Indicators Report, 2018). Percentage of single-parent households in San Bernardino County is 31.5% with top performer only at 23% and the State at 34% (San Bernardino County Indicators Report, 2018). Single parents have less income, which is less money for housing, food, and other resources. Primary care physician’s ratio is 1747:1, top performer is 2300:1 and the State of California is 1483:1 (San Bernardino County Indicators Report, 2018). Seems as though there are mor physicians in San Bernardino than other places in the U.S. including the State overall. Excess drinking and adult smoking are lower in San Bernardino than the top performer and still lower than California. Access to exercise opportunities in San Bernardino County is 88%, top performer is 91% and California 93%, less access leads to less physical activity in which leads to obesity and other health disease. Injury in death is 29.1 for San Bernardino and top performer is 53.5 with California being at 30.9 per 10,000 death (San Bernardino County Indicators Report, 2018). D. SUMMARY 1. Significant Finding(s) The focus in my paper is the theme “Safety in the community” in which needs improvement. Safety includes avoidance of sexually transmitted disease by educating the community. Residents in the community want to feel safe outside their homes, not worried they will be robbed or caught in the cross-fires of a shootout. Teen pregnancy is a safety concern, as pregnancy decreases a teens chances of graduating high school and attending college. Without being educated about sexual transmitted disease and knowing how to practice safe sex, teens will continue to have practice unsafe sex. When teens attend college, they have the opportunity to increase their annual income, allowing an opportunity to purchase a home and not live in poverty. With improved income people are able to financially afford healthier food items such as fresh veggies / fruit, a gym membership or other sports activities to participate in. With healthier eating and exercise it decreases their chances for obesity, diabetes, and heart disease. Everything is a domino effect in which it all begins with knowledge, then action. 2. Action Plan(s) Knowledge will need to begin with the children when they are young, impressionable and have not been “tainted” by their environment. This begins with early sex education when kids are in 5th grade about all the sexually transmitted disease and effects of teen pregnancies. In early elementary begin teaching different forms of exercise and encourage physical activity, healthy eating habits and educate on risks of obesity. Assist the youth in setting goals for themselves, along with educating them on different careers and vocational trades. Health classes need to begin at an earlier age and continued throughout high school. In educating adults with already unhealthy habits or lack of education, it is vital we educate the community and provide training classes with incentives for their own improvement. a. Services or Programs The advanced professional nurse will be educating the public about sexually transmitted disease the county is campaigning is GYT:Get Yourself Tested Campaign. This movement is to encourage people to get tested and increase their knowledge on the different sexually transmitted disease are out there. A website called Teen Source assists in helping teens find clinics for birth control options, sex education, prevention and tools. b. Raise Public Awareness and Promote Public Engagement Summer Night Lights program developed from an Ex-gang member whom found a place for people to engage in a public setting with safe activities in which to participate in. This program allowed parks to keep the lights on until midnight. The advanced professional nurse will be educating and promoting healthy ways to engage in the community with different programs the county provides at no cost. California School Aged Families Education (Cal-SAFE) program that increased availability of support services for expecting/ parenting students to improve academic achievement, parenting skills, provide quality child care/ development programs for their children. The advanced professional nurse will be educating new young mothers in how to breast feed their babies along with healthy eating for toddlers. Mobile Testing Units (MTU) are out in the community in which offer free testing for sexually transmitted disease that are free and confidential for those 12 years old and older. These services provide informational pamphlets, condoms, internal female condoms, dental dams, bleach kits and lubricant. The advanced professional nurse will be educating on proper use of birth control options, and education of sexually transmitted infections. The advanced nurse practitioner will use social medica, Instagram, Facebook, Snap Chat and Twitter as means to connect with the youth. Community booths, mobile units in public parks or outside of school availability for youths to access these services. b. Monitoring and Evaluating Action Plan To track and see improvement researchers will need to track children from the beginning of starting school, implement the education and track even after high school to verify if there is an improvement. Confidential emails to be sent out to participants with survey questions for participants to complete after each service received. A phone application on a cell phone for which participants can anonymously completed for the County program to track usage or benefits of program directly from the participant along with suggestions. This phone application can be called Teen Drop in which the County of San Bernardino tracks based off education questions participants answer correctly and based off time spent on the application participants can win gift cards towards participating stores/ programs. The county can utilize Survey Monkey to track data by participants. If there is a decrease of 10-15% or more each year that data is collected the program can be considered a success. If trends continue to trend upwards in violence, teen pregnancy, contraction of sexually transmitted diseases along with any of the other trends discussed in this paper it will be considered a failure. After 5 years of data collection and no improvement in these categories, there will need to be re-evaluation and minor adjustments made on the education being provided. Researchers will need a graph chart created for each category with a controlled group of students to track. Data will be collected via a phone app monthly including weight, food intake, grades, sexual activity, disease reporting, housing situation and parent income. Annually reports will be made public for the residents and County of San Bernardino to track and see potential progress. E. DATA SOURCES & METHODS For collection of data and graphs I used the website for the County of San Bernardino in which they have several reports accessible to the public. The County of San Bernardino compile a report called Community Indicators Report in which I used to collect my data and visual charts for of this paper. The County of San Bernardino uses several websites, resources, and data to create graphs, rate trends in comparing states, counties, and years of data. The data is collected by residents self-reporting data via the census reporting that is conducted, school data that is reported to the county and hospital data in which they report to the Department of Public Health, center of Disease Control and Prevention . Some data is retrieved from private sources such as Kaiser Family Foundation, public websites, government surveys and reports. Centers of Disease Control and Prevention. (2018). Overweight and obesity. Retrieved from https://www.cdc.gov/obesity/ County Health Rankings. (2020). San Bernardino County. Retrieved from https://www.countyhealthrankings.org/resources/san-bernardino- countycahttps://www.countyhealthrankings.org/app/california/2020/measure/factors/132/data ?sort=desc-0 Food security and obesity in San Bernardino County. (2017). Public health nutrition program. Retrieved from https://wp.sbcounty.gov/ Kidsdata.(2016). Teen births. Retrieved from https://www.kidsdata.org/topic/314/teen-births/table#fmt Public Health Department. (2018). Communicable disease section STI/HIV. Retrieved from https://indicators.sbcounty.gov/ San Bernardino Community Indicators Report. (2017). Community indicators report. Retrieved from http://cms.sbcounty.gov/Portals/21/Resources %20Documents/CIR_2017_report.pdf?ver=2018-03-23-132312-883 San Bernardino Community Indicators Report. (2018). Community indicators report. Retrieved from http://www.sbcounty.gov/Uploads/CAO/Feature/Content/SB_2018_REPORT_-3.pdf To collect data on housing, population, computer and internet use, health and economy data to compare San Bernardino County from the State of California and the entire United States. This data comes from surveys that combine interviews and physical examinations. School District data provides information for their county along with immunization and health records. Websites used include: NeighborhoodScout. (2020). Demographic data. Retrieved from https://www.neighborhoodscout.com/ca [Show More]
Last updated: 2 years ago
Preview 1 out of 30 pages
Buy this document to get the full access instantly
Instant Download Access after purchase
Buy NowInstant download
We Accept:

Also available in bundle (1)

NURSING D029 - Population Health Data Brief (BUNDLE) containing all the COUNTIES | Download For Best Study.
NURSING D029 - Population Health Data Brief (BUNDLE) containing all the COUNTIES | Download For Best Study.
By Goodluck Academia 3 years ago
$14.5
9
Reviews( 0 )
$15.00
Can't find what you want? Try our AI powered Search
Document information
Connected school, study & course
About the document
Uploaded On
Aug 01, 2021
Number of pages
30
Written in

Additional information
This document has been written for:
Uploaded
Aug 01, 2021
Downloads
0
Views
171