*NURSING > CASE STUDY > WGU D029 - Population Health Data Brief Template -San Bernardino County, CA (All)
WGU D029 - Population Health Data Brief Template -San Bernardino County, CA
Document Content and Description Below
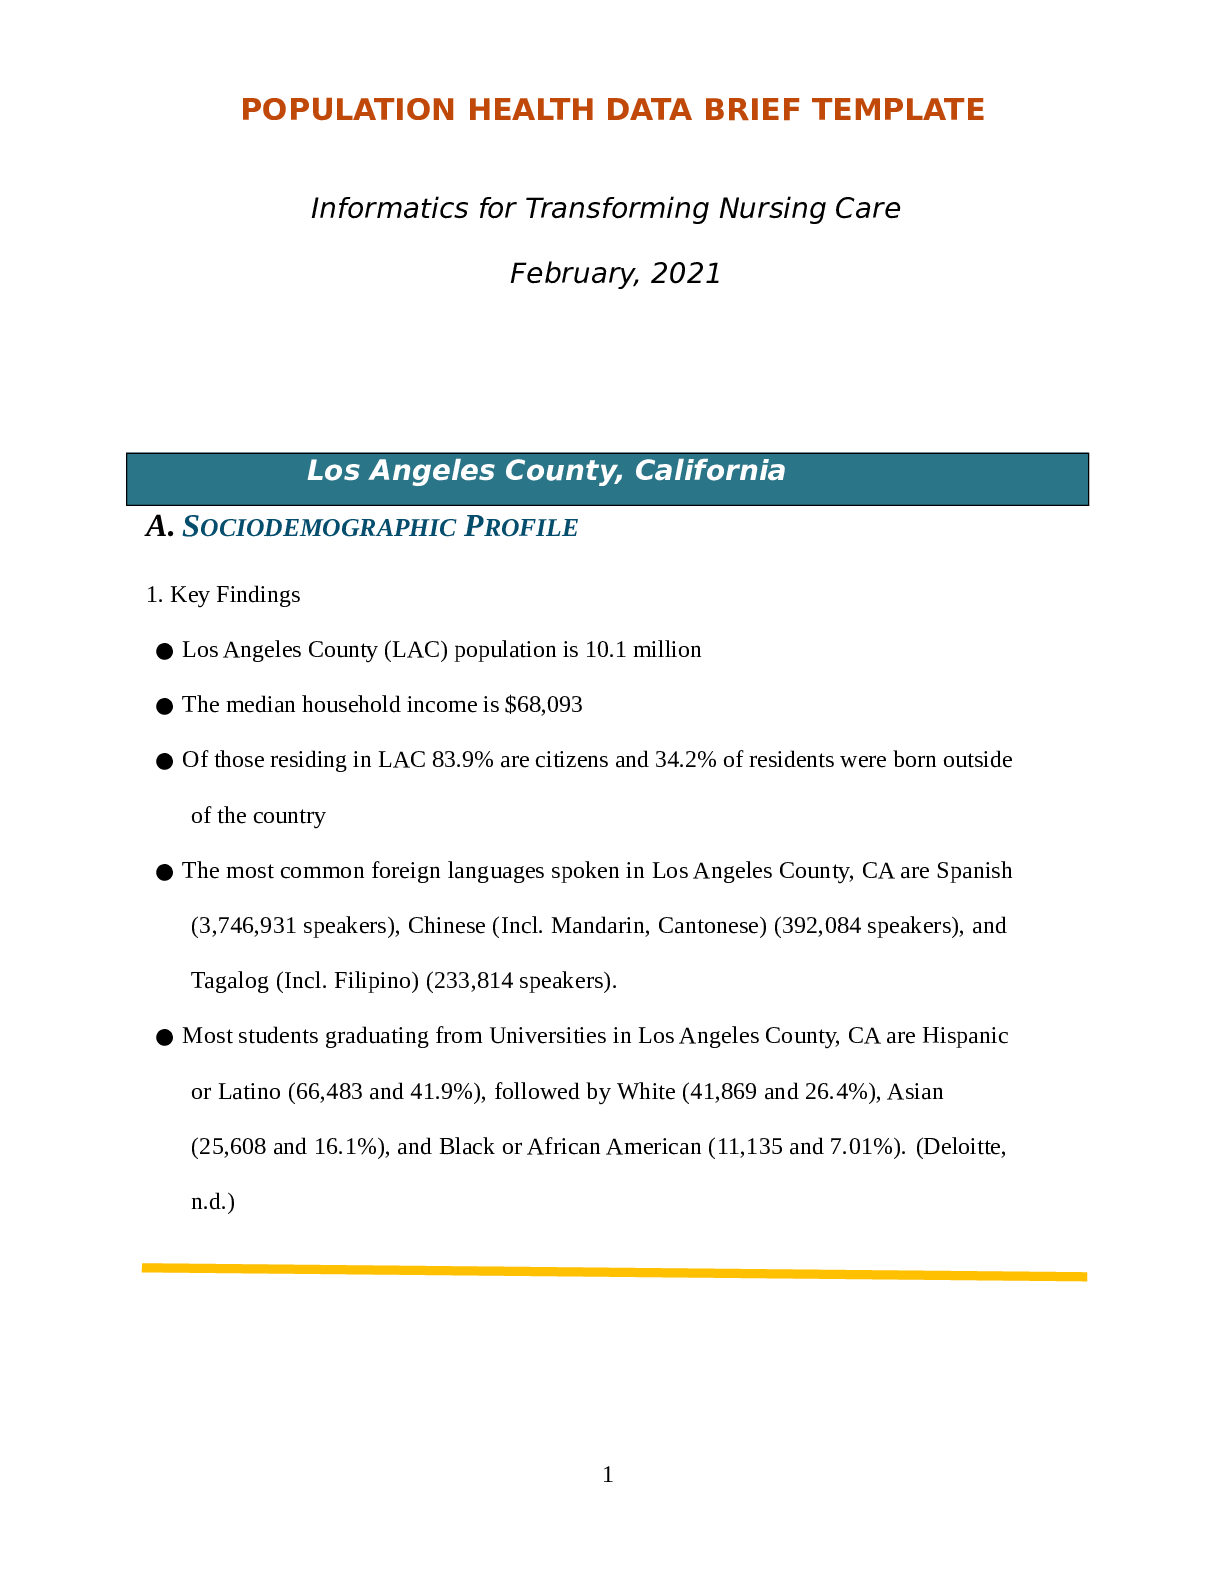
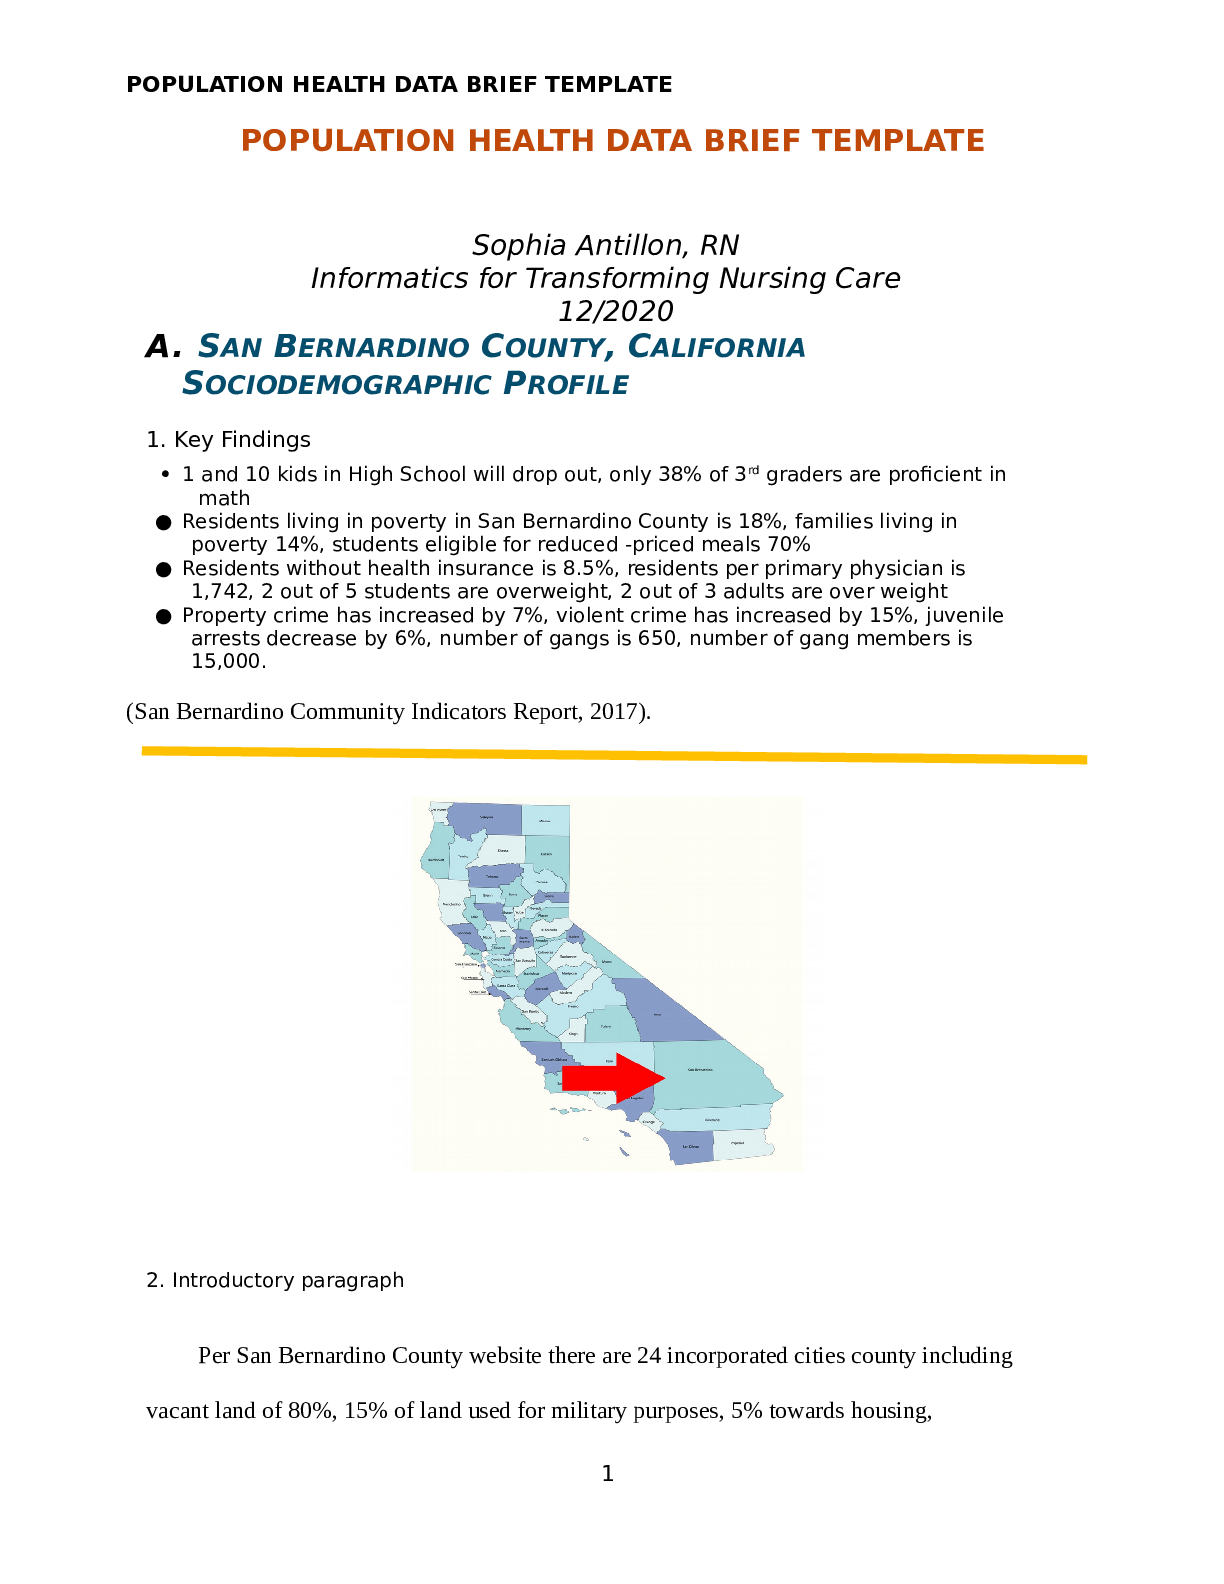
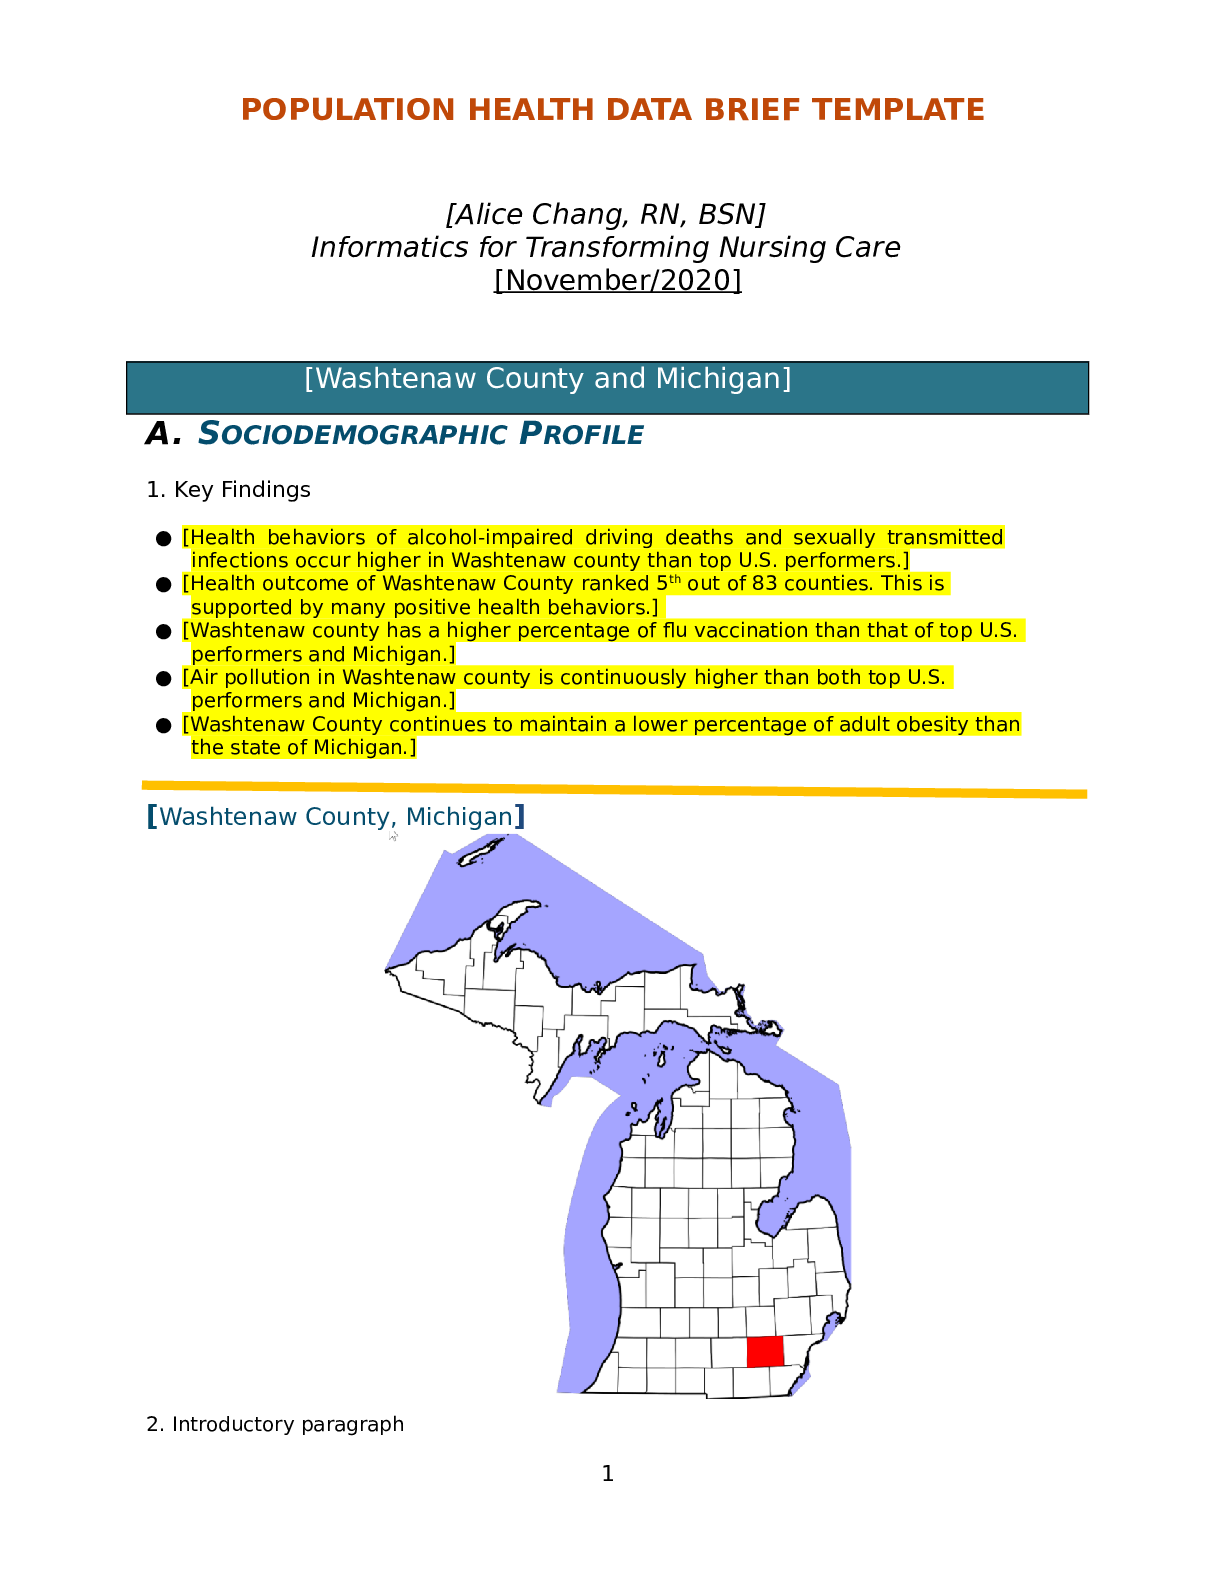
POPULATION HEALTH DATA BRIEF TEMPLATE Informatics for Transforming Nursing Care A. SOCIODEMOGRAPHIC PROFILE 1. Key Findings ● Quality of Life in San Bernardino County measure shows 2... 0% of adults report fair or poor health within the County of San Bernardino which is a higher rate than the State of California at 16.7%. ● In San Bernardino County, the rate of flu vaccinations, the rate of sexually transmitted infections, adult obesity, and instances of premature death continue to rise and show little to no improvement. ● The teen birth rate per 1000 is astonishingly higher in the county at 26.3% versus the State of California’s rate of 18.9% per 1000. ● Following a steady increase in poverty rates, the last three years have seen a decrease in poverty. ● Between 2015 and 2016, heart disease prevalence and deaths, diabetes prevalence and deaths, and high blood pressure prevalence and deaths due to stroke all increased. SAN BERNARDINO COUNTY, CALIFORNIA 2. Introductory paragraph The United States Census Bureau continues to provide statistical information and data on popular characteristics for every county, city, state, and across the nation. The San Bernardino County, the State of California and the United States (USA) population sociodemographic information taken from the Bureau’s website is discussed in Table 1 below. The population of San Bernardino county is approximately 2.18 million versus 328 million citizens in the USA respectively. The population change in San Bernardino County is 7.1% which is higher than the USA, which is 6.3%. This shows that San Bernardino County is growing quicker than the USA. The percentage of people under the age of 18 in the USA is lower than in San Bernardino County, with the national average being 22.3% versus 26.1%. In San Bernardino County, the percentage of persons 65 years and older is 11.9% which is less than the national average of 16.5%. Residents 65 years of age and under with a disability make up 7.4% versus 8.6% nationally. The civilian workforce shown at and over sixteen-year-old in San Bernardino County is 54.4% in comparison to 62.9% in the USA. There is a close margin of women San Bernardino County and the USA at 50.2% to 50.8% respectively demonstrating women make up more than 50 percent of the workforce across the country. The Hispanic population in San Bernardino County is at 54.4% versus 18.5% in the United States. The population in the county is made up of more White persons (50.2%) and in the state (50.8%). Persons born in foreign countries make up 21.0% versus 13.5% in the United States. San Bernardino County is made up of more persons who speak other languages than English at 41.6% versus 21.5% nationally. Home computer utilization use in the county and the USA is at 91.2% versus 88.8%. Unfortunately, there are less high school and higher graduates at 79.5% than the USA at 87.7%. 3. Sociodemographic Profile Table Population Characteristics County United States Population Estimates 2,180,085 328,239,5 23 Population Percent Change 7.1% 6.3% Percentage of Persons Under the Age of 18 26.1% 22.3% Percentage of Persons 65 Years and Over 11.9% 16.5% Percentage of Women 50.2% 50.8% Percentage White Alone 76.6% 76.3% Percentage Hispanic Alone 54.4% 18.5% Percentage of Foreign-Born Persons 21.0% 13.5% Percentage Language Other Than English Spoken at Home, Percent of Persons Age 5+ 41.6% 21.5% Percentage of Houses with a Computer 91.2% 88.8% Percentage with High School Graduate or Higher 79.5% 87.7% Percentage with a Disability, Under Age 65 Years 7.4% 8.6% Percentage without Health Insurance, Under Age 65 Years 9.3% 9.5% Percentage in Civilian Labor Force Age 16 Years+ 60.1%% 62.9% Percentage of Women in Labor Force Age 16 Years+ 54.4% 58.2% Total Healthcare and Social Assistance Revenue 11,199,31 5 2,040,441,2 03 Total Retail Sales Per Capita $11,714 $13,443 Per Capita Income in the Past 12 Months $23,956 $32,621 Percentage of Persons in Poverty 14.9% 10.5% Population Per Square Mile 101.5 87.4 U.S. Census Bureau QuickFacts: San Bernardino County, California; United States. (2019, July 1). B. COUNTY HEALTH TRENDS & RANKINGS 1. Introductory Paragraph First off, a healthcare analysis investigates a snapshot or moment in time which assists in the community comprehending the current state and establishes a baseline of understanding. Secondly, having the ability to trend data over time assists in understanding consistent or inconsistent trends to better apply resources in order to improve and stabilize the immediate area and region. Lastly, performing an analysis of the information helps to mitigate poor health outcomes and develops recommendations for improving the community. Data taken for San Bernardino County, California was collected from the UC Davis Institute for Population Health Improvement and Public Health County Health Rankings website for comparative analysis of county demographics, health outcomes to include physical inactivity, adult obesity, impaired driving deaths, unemployment rate, alcohol sexually transmitted infections, premature death, and children in poverty. The data was systemically compared throughout the county, state of California, and nation scores in the above categories. These seven specific health risks and trends were reviewed to determine San Bernardino County’s position of improvement, worsening, or statistical significance. The methods used to collect data is a compilation of all the counties in the nation. Thy are then ranked within states using a variety of state and national sources. The counties that are considered the healthiest are ranked high with a score of 1 or 2. 2. Discussion of Health Trends Health Trends In order to comprehend the flow of changes over a period of time, graph visualization tools and aids are ideal. Graph visualization charts can be used to summarize data which makes it easier for the user to read and appreciate the variation in scales; it allows a reader to see a clear picture of research findings for decision-making. When working with numbers, an analyst can identify a correlation or frequency, using a tree map to paint a visual picture. A visual tool simplifies the meaning of data in order to aid with the understanding of the community outcomes and whether they are improving or worsening. The data used in the 2020 health ranking is from 2016-2018. San Bernardino County is ranked 40th out of 244 counties in the nation. In San Bernardino County 20 percent of the population reported fair to poor health. In comparison to the state where 17 percent reported this measure; the top USA performers reporting 12 percent. The number of premature deaths is ranked as the years of life lost before the age of 75 per 100,000 population. The county’s length of life ranking is 33. The top U.S. performer with 5,500 is at the 10th percentile; the overall in California is 5,300; and San Bernardino County is 6,800. The life expectancy in San Bernardino County is 78.8 years, with African American’s at 74.9 (shorter life); Hispanics at 81.8; Whites at 76.6; and Asians at 86.4 (live longest). The seven health trends listed and graphed will provide a snapshot of the health of the county. Adult obesity is the first health trend in figure one. From 2004 to 2010 San Bernardino County shows an increase in county adult obesity rates of four percent as compared to the same time frame with a four percent increase in the state of California and a four percent increase nationally. All areas are increasingly worse than in 2004. In comparison of 2011 to 2016. However, in comparison of 2015 to 2016, overall, the county rate increased from 28 percent to 29 percent; the state increased from 23 percent to 24 percent and national rates remained the same at 24 percent. Obesity is a measure of diet and exercise. Recommendations such as increasing fitness (challenging with COVID-19 restrictions), competitive pricing for health foods, exercise subscriptions, and increasing walkability factors such as redesigning streets in the county. The second health trend is physical inactivity. San Bernardino County did not significantly change its rate between 2004 and 2016; both rates were at 23 percent. The state of California rate is less at 18 percent; and national rate aligns with the county; however, all rates are not significant enough to correlate whether or not initiatives improved or worsened the rate. With physical inactivity being a way to measure diet and exercise, recommendations could include all of the obesity recommendations, along with encompassing multiple components for prevention such as increased time for school recess, exercise programs at work, healthier food choices at school and work, along with encouraging the community to ride a bike or a metro train to work which could facilitate exercise via walking and bicycling. The third health trend is alcohol-impaired driving deaths. Every day, approximately 30 people in the United States die in drunk-driving crashes every 50 minutes. The years of data analyzed were from 2014-2018. San Bernardino County’s rate showed to be 30% versus the states 30% with the top U.S. Performers coming in at 11% (10th percentile) overall. In 2017, 10,564 people died in alcohol-impaired driving accidents. This accounts for 26% of all traffic-related deaths in the United States. Of the 1,198 traffic deaths among children ages 0- 14 years in 2017, 198 involved an alcohol-impaired driver. The fourth health trend is sexually transmitted infection (chlamydia). This metric uses diagnosed chlamydia cases per 100,000. The information shows three geographic populations are getting progressively worse; however, San Bernardino County shows a 68 percent of change (increase) from 2007 to 2017; 45 percent of change for the state of California; and 4 percent of change nationally. San Bernardino County is getting disproportionally worse (609.3 cases per 100,000) than both the state (553.4) and country (543). Chlamydia is contracted by having unsafe sexual activity and can be associated with an increased risk of cervical cancer, infertility, and impacts low income communities disproportionally. The fifth health trend is premature death. The data covers all persons under age 75 and under in San Bernardino County. The rate of premature death is shown to be 6,800 per 100,000 for the County of San Bernardino and 5,300 for the state. The leading causes of death by numbers were malignant neoplasms with 5582 deaths. The age-adjusted rate per 100,000 showed to be 84.6. Heart disease ranked second with 4076 deaths in the county with an age-adjusted rate per 100,000 to be at 61.9. Accidents ranked third with 1853 deaths. The age adjusted rate per 100,000 showed to be 29.7. Premature mortality includes all deaths among people under age 75 and the rates are age-adjusted to the US 2000 population. Since counties have different age make-ups, age-adjustment can help in comparing health measures between counties. The sixth health trend is the recent unemployment rate percentages. The percentage of the population ages 16 and older who were unemployed but seeking work were ranked by percentages across the nation. The five-year trend shows up to a 5 percent decline which does not indicate significance in the county, state, nor national rates. From 2012 to 2017, San Bernardino County and California state increased by two percent; and the country increased by one percent. Post coronavirus, the unemployment rate has increased to 8% at the state level. In the County of San Bernardino, the current unemployment rate sits at 4.0%. The top U.S. Performers in 2018 ranked at 2.6% (10th percentile). The seventh health trend is the number of children under age 18 living in poverty. Low income households have been found to have higher risks of abuse, chronic health and dental issues, as well as negative behavioral condition. In 2018, the census reported the poverty income threshold to be $25,926 for two adults and two children. This data shows that over the last ten years (2008 to 2018), San Bernardino County has increased the percentage of children in poverty by five percent; whereas both the state decreased by two percent and nation rate did not change. San Bernardino County’s highest children in poverty rate in 2018 was 21% meaning 21 of 100 children were within the poverty level. Recommendations include but are not limited to federal government subsidy for poverty level households, an increase in minimum wage rates, specific thresholds and time limitations based upon the degree program for parents who are in college with financial aid, credit education via community resources, expanding subsidies for households with children until high school graduation, rendering full amounts of child support rather than the state retaining some of the funds, and improve the wait time of assistance approvals with reforming family assistance programs in order to meet milestones for increased support. 3. Health Trends (Visual Graphs) • health trend 1 [Figure 1: Adult Obesity in San Bernardino, CA] [Figure 1: Obesity trend over time, comparing the county, state, and national rates. This graph indicates an increase in county adult obesity rates from 2004 to 2016 of 5% as compared to a 3% increase in the state of California and a 5% increase nationally.] • health trend 2 [Figure 2: Physical Inactivity in San Bernardino, CA] [Figure 2: Physical Inactivity trend over time, comparing the county, state, and national rates. This graph indicates the physical inactivity rates of the county from 2004 to 2016 stayed the same at 23% as compared to a 1% decrease in the state of California and a 1% decrease nationally.] • health trend 3 [Figure 3: Alcohol-impaired driving deaths in San Bernardino, CA] [Figure 3: Alcohol-impaired driving deaths trend over time, comparing the county, state, and national rates. This graph indicates the alcohol-impaired driving deaths rates of the county from 2008 to 2018 decreased 8% as compared to a 7% decrease in the state of California and an 8% decrease nationally.] • health trend 4 [Figure 4: Sexually transmitted infections in San Bernardino, CA] [Figure 4: Sexually transmitted infections trend over time, comparing the county, state, and national rates. This graph indicates the sexually transmitted infections rates of the county from 2007 to 2017 increased by 203 cases as compared to an increase in 164 cases in the state of California and a 55 increase in cases nationally.] • health trend 5 [Figure 5: Premature death in San Bernardino, CA] [Figure 5: Premature death trend over time, comparing the county, state, and national rates. This graph indicates the 3-year Average of premature death rates of the county from 1997 to 2017 decreased by 1310 as compared to a 1565 decrease in the state of California and a 1310 decrease nationally.] • health trend 6 [Figure 6: Unemployment rate in San Bernardino, CA] [Figure 6: Unemployment rate trend over time, comparing the county, state, and national rates. This graph indicates the unemployment rates of the county from 2002 to 2018 decreased by 2% as compared to a 3% decrease in the state of California and a 2% decrease nationally.] • health trend 7 [Figure 7: Child in Poverty in San Bernardino, CA] [Figure 7: Children in poverty trend over time, comparing the county, state, and national rates. This graph indicates the children in poverty rates of the county from 2002 to 2018 decreased 1% as compared to a 2% decrease in the state of California and a 1% increase nationally.] 4. Health Trends Discussion Health Trends Discussion Health trends associated with diet and exercise (figure 1 and 2) demonstrate San Bernardino County residents have shown to have a higher rate of persons not willing to engage or have increased their physical activity. Obesity rates are trending up whereas physical inactivity rates are stagnant or insignificant. However, unsafe sexual activity is on the rise as well. Sexually transmitted infections from 2007 to 2017, such as chlamydia cases, have significantly increased to 68 percent (406 cases per 100,000). These numbers are worse for the county as more resources could be used to promote curative treatments. Sexually transmitted infections do trend over time, state, comparing the county, and national rates. This graph shows the sexually transmitted infections rates of the county from 2007 to 2017 increased by 203 cases as compared to an increase in the 164 cases in the state of California and a 55 increase in cases nationally. Alcohol-impaired deaths as well as premature deaths in at the county and state levels has also decreased. This shows the premature death trend over time, comparing the county, state, and national rates. This graph indicates the 3-year average of premature death rates of the county from 1997 to 2017 decreased by 1310 as compared to a 1565 decrease in the state of California and a 1310 decrease nationally. Alcohol-impaired driving deaths trend over time, comparing the county, state, and national rates. This graph indicates the alcohol- impaired driving deaths rates of the county from 2008 to 2018 decreased 8% as compared to a 7% decrease in the state of California and an 8% decrease nationally. Over time, the unemployment rate trend is shown to compare the county, state, and national rates. The unemployment rates of the county from 2002 to 2018 decreased by 2% as compared to a 3% decrease in the state of California as well as a 2% decrease nationally. Children less than 18 in poverty began to trend down in San Bernardino County from 2012- 2017, however, in 2018, the rate improved at a one percent increase, whereas the state and country remained the same. The population in San Bernardino County sits at 43.7% Hispanic, the rate of children in poverty for them is 31% or three of ten Hispanic children. Correlating with income and access to care, although children are in lower income residents, they are not uninsured. Based on the graph trends, San Bernardino County should prioritize strategic plans for decreasing obesity numbers, promoting sexual education and resources, increasing physical activities, and targeting minority children in the poverty levels. C. Health Factors 1. Health Factors Table Factors Influencing Health County Data Top U.S. Performer State Data Percentage Adult Smoking 13% 14% 11% Percentage with Access to Exercise Opportunities 84% 91% 93% Percentage Excessive Drinking 19% 13% 19% Primary Care Physicians (Ratio of Population to 1 Physician) 1,710:1 1,030: 1 1,260 :1 Percentage with High School Graduation 83% 96% 83% Percentage with Some College 55% 73% 65% Percentage with Unemployment 4.0% 2.6% 4.2% Percentage of Children in Single-Parent Households 36% 20% 31% Social Associations (Number of Associations Per 10,000) 4.5 18.4 5.9 Violent Crime (Number of Violent Crimes Per 100,000) 442 63 421 Injury Deaths (Number of Injury Deaths Per 10,000) 48 58 50 Percentage of Children Eligible for Free or Reduced-Price Lunch 72% 32% 60% Air Pollution (Average Daily Density of Air Pollutants) 14.9 6.1 9.5 Percentage with Severe Housing Problems 27% 9% 27% U.S. Census Bureau QuickFacts: San Bernardino County, California; United States. (2019, July 1). 2. Comparison of Data It is essential to compare analysis of data in order to benchmark local performances in order to open up and increase the opportunity for improvement and successful across the community/region. The data highlights gaps, barriers, disparities, and resource challenges in San Bernardino County. The percentage of children with severe housing problems, in single- parent homes, who are eligible for free or reduced lunches, and are exposed to air pollution is approximately 20% higher than that of top performers. In comparison of the adults who smoked, had access to exercise opportunities, and have primary care physicians in San Bernardino County are leading the way and are consistent with positive influences on health in relation to the state and top USA performers. However, San Bernardino County and the state of California have a moderate opportunity for improvement in the following areas: excessive drinking (19% for both) versus 13% for high performers; some college education (55%, 65% respectively) versus 73% for top performers; high school graduation (83%, 83%) versus 96% for top performers; and unemployment (4.0%, 4.2%) versus 2.6%. The worse factors for San Bernardino County related to the state of California and top performers are social associations and violent crimes. The county violent crime per 100,000 is 442 cases whereas the state is 421cases and top performers at 63 which correlates to San Bernardino County having seven times more violent cases. Social association in the County of San Bernardino is another area that is significantly lower than top performers. The county number per 10,000 (5.5) and the state (5.9) is 2-3 times lower than USA top performers. A community safety measure that should be a priority target is violent crimes. This is another community safety measure which can impact or influence other important areas such as graduation, smoking, drinking, unemployment and deaths within the community. D. SUMMARY 1. Significant Finding(s) Sexually transmitted infections (STIs), specifically chlamydia has increased by 72 percent between 2007 and 2017. 2007 to 2017 increased by 206 cases as compared to an increase in 164 cases in the state of California and a 55 increase in cases nationally. Currently, there are 609 cases of chlamydia per 100,000 people in San Bernardino County, which is 0.59% of the population that have been diagnosed with chlamydia. Per the Center for Disease Control (CDC) Social Determinants of Health report for year 2017, congenital syphilis has doubled from 33.6 per 100,000 in 2014 to 73.2 per 100,000 in 2017; and gonorrhea increased from 160 cases per 100,000 in 2014 to 189.7 cases per 100,000 (CDC, 2019). If untreated, all STI’s can lead to serious healthcare consequences. The CDC reports there are many elements contributing to the spread and prevalence of STI’s. A woman’s probability of complications is much more serious than in men. Men are known to be silent carriers of STI’s. Individuals can also be asymptomatic. Medical treatment is not always sought out because there can be no symptoms therefore, the unprotected sexual behavioral patterns of the carrier continues. Sexually transmitted infections are prevalent in vulnerable communities which are low income or poverty stricken. Single parent homes in the County of San Bernardino are close to double that of the top performers (36% versus 20% respectively; social associations in the community are extremely low at 4.5 per 10,000 whereas the data shows that the top performers are at 18.4 per 10,000. Data shows the severe housing problems again are at an alarming 27% in the county versus 9% of those top performers. This can correlate to low opportunities for community recreational activities and resources. It is noted that within the community, social support networks are strong predictors of health behaviors. This may suggest that communities that lack a robust social network are less likely to make healthy lifestyle decisions. The preceding challenges negatively impact the sexually transmitted infections proliferation; however, the San Bernardino County uninsured percentage rate for residents less than age 65 has improved since the implication of the Affordable Care Act, 2010. In 2008, San Bernardino County’s uninsured rate was 28%. In 2017 this rate had improved to 22% which shows a nine-year trend of a six percent decrease. 2. Action Plan(s) A key plan of action to target the sexually transmitted infection rates include sexual education with issuance of free condoms in schools, community forums, and recreation settings. There needs to be programs who will make public announcements, allow treatment for infected persons and partners. Allow provider visits to the uninsured. The use of social networking can be used to deliver health education to the younger population. Recreation and resource departments must show an improvement in afterschool and educational options for the community. As the uninsured rate continues to improve, it appears access to care will also increase in the county. The CDC recommends annual testing for sexually active individuals between age 15-24 years old, pregnant women, and HIV infected persons between the ages of 13-64 years (CDC, 2019). Sexual education including testing options, preventative devices, and other forms of treatment can all be advertised via public service announcements, local health departments, schools, retail drug chains, and all healthcare forums. These action plans should be rendered for public dissemination as a way to improve and stop the spread of sexually transmitted infections. a. Services or Programs As discussed above, essential programs such as an increase in education, testing sites, free condoms, and community resource/recreation centers needs to be included in the plan of action for change. As with COVID-19, free testing is available and should be part of the enhanced improvement process. Along with constant education, revering self-discipline, advocating for safe sex practices by use of condoms, and placing notoriety on saying “no”, the use of celebrities and renown members of society could also be used to pass along the message. b. Raise Public Awareness and Promote Public Engagement In order to engage the community in decreasing sexually transmitted infections, technology is key and can be used to raise public awareness and promote change. The first example to raise awareness is to encourage healthcare providers to spread the option of free testing and expedited in-clinic therapy if positive. The second example or opportunity for informatics engagement would be to utilize celebrity advocates in order to promote safe lifestyle behaviors via video/commercials. Public Service announcements can be seen around the state and country. Social media outlets such as Facebook, Twitter, Instagram, and You Tube are used by a high percentage of people in the USA. Allowing celebrity posts and mini-videos regarding sexually transmitted infections on any of these platforms can highlight low or no-testing cost, free condoms, prevention, and treatment/therapy options that are discrete. This option can normalize the stigma of STI’s and promotes prevention as well as treatment to stop the spread. At some point an app can be created to assist in scheduling appointments for STI testing at local sites. Access to treatment, testing, and prevention can become a convenient one-stop shop. In order to mitigate wait times and privacy, individuals would be able to check in to their appointment using the app without having to walk into the clinic. c. Monitoring and Evaluating Action Plan In the first example, the increase in awareness allows the advanced nurse to track and monitor the data based on the denominator of those requesting sexually transmitted infection testing. When the positive results are shown, the data could trend to determine the positives and the number who were treated. When trending the data over a certain timeframe, the outcome could suggest the need for additional preventative education and management. In the second example, the advanced nursing role would provide accurate information on options for treatment and testing. Computer applications such as Excel or Tableau can be used to develop local STI dashboards. This information could be shared with public community recreation centers and used as visual representation of comprehensive data. In the last example, tracking the progress of the clinics can be achieved by using a mechanism to determine efficiency, appointment and check-in times, as well as testing times. Additionally, following appointments, patient surveys could be tracked and trended for satisfaction. E. DATA SOURCES & METHODS In the data brief, all of the data was collected using the San Bernardino County Health Rankings website. The organization is responsible for collecting healthcare measurements on every county in the USA and ranks the data by states. The data is then put together using a variety of state and national sources. With a confidence interval of 95%, the information provided is extremely reliable and valid. The rankings are based on a population health conceptual framework. That framework renders what factors influence health and what can be done about those factors to improve outcomes. In order to calculate the ranking scores, the measures are standardized and weighed within each state. The sum is then rendered for a composite score. After this, a determination is made based on the lowest and highest scores within that state. The website used to collect the data is at: https://www.countyhealthrankings.org/app/california/2020/rankings/san- bernardino/county/outcomes/overall/snapshot. References Healthy People 2020. (2019). Sexually Transmitted Diseases. https://www.healthypeople.gov/2020/topics-objectives/topic/sexually-transmitted-diseases. How Healthy is your County? | County Health Rankings. (2020). County Health Rankings & Roadmaps. https://www.countyhealthrankings.org/ [Show More]
Last updated: 2 years ago
Preview 1 out of 26 pages
Buy this document to get the full access instantly
Instant Download Access after purchase
Buy NowInstant download
We Accept:

Also available in bundle (1)

NURSING D029 - Population Health Data Brief (BUNDLE) containing all the COUNTIES | Download For Best Study.
NURSING D029 - Population Health Data Brief (BUNDLE) containing all the COUNTIES | Download For Best Study.
By Goodluck Academia 4 years ago
$14.5
9
Reviews( 0 )
$15.00
Can't find what you want? Try our AI powered Search
Document information
Connected school, study & course
About the document
Uploaded On
Aug 01, 2021
Number of pages
26
Written in
Additional information
This document has been written for:
Uploaded
Aug 01, 2021
Downloads
0
Views
224


