YOUR NAME:________________
Final Exam Strategic Tools for Marketers –Vermillion
Take Home Exam Due via dropbox on5/30 by 9:15pm
You MUST have questions on exam - simply fill in your answers in a different color th
...
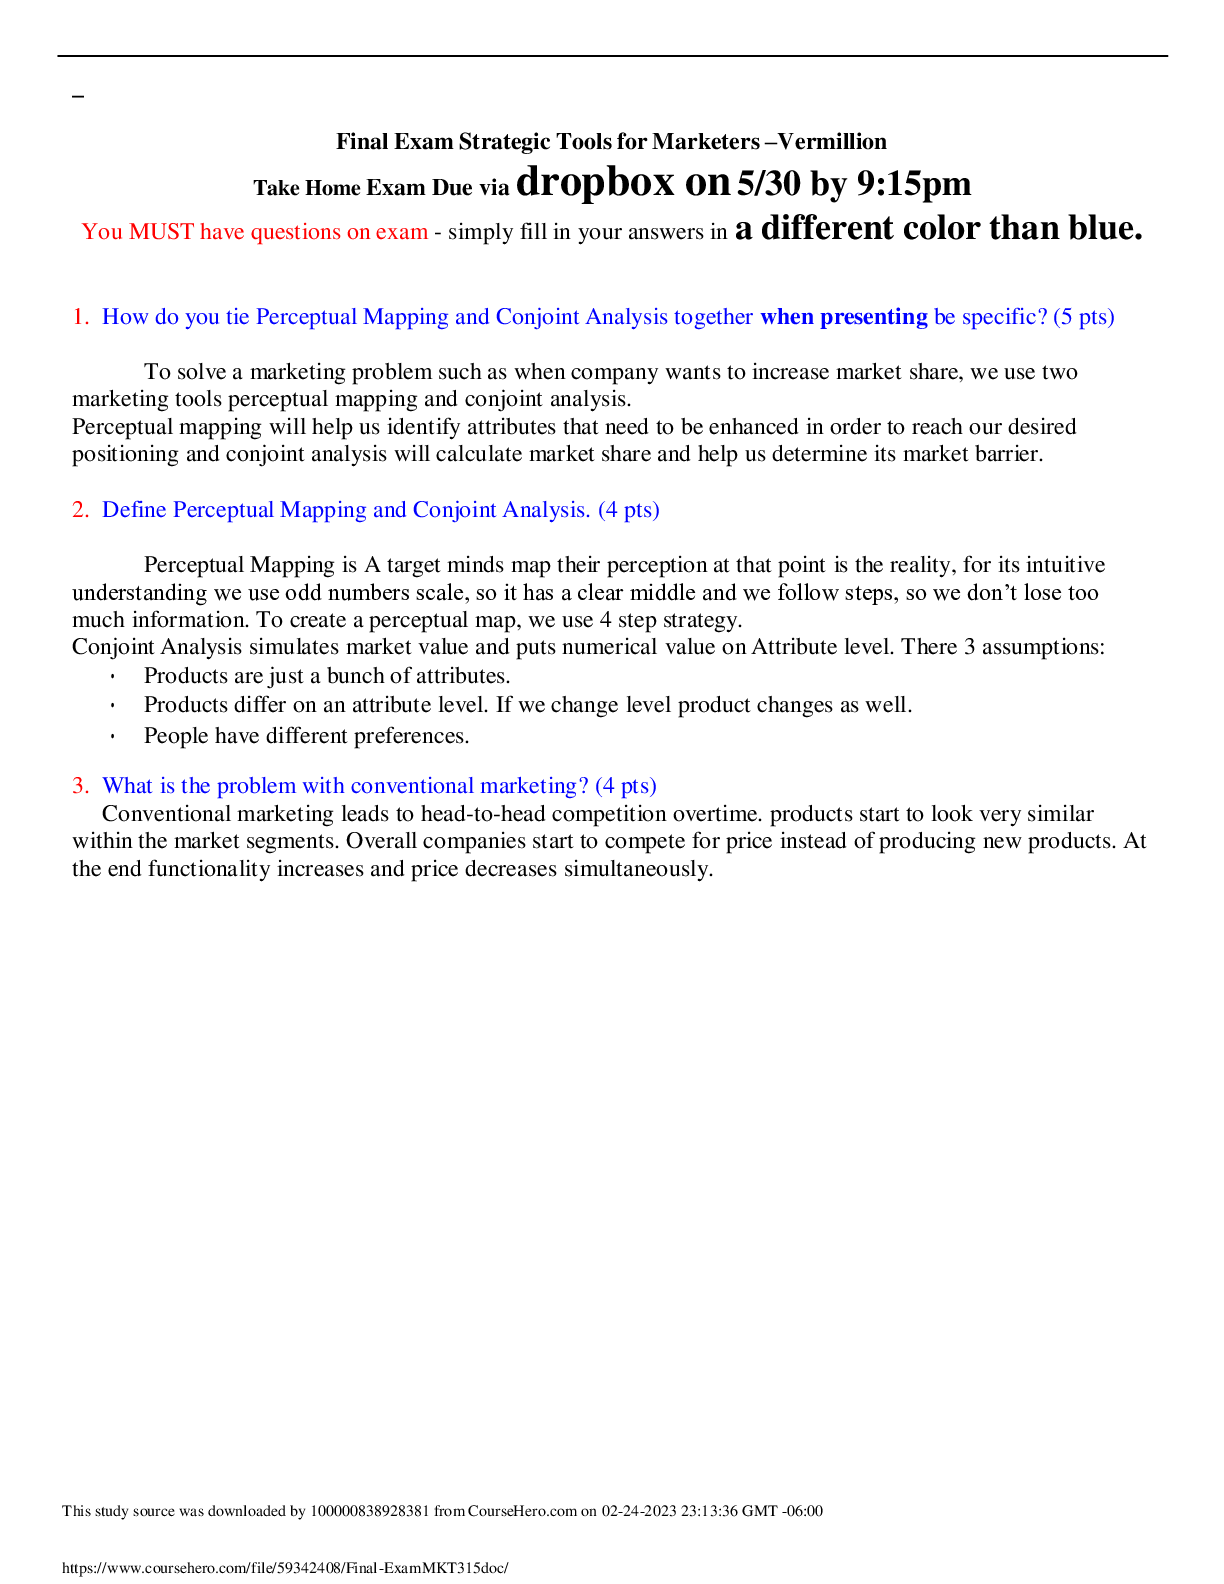
YOUR NAME:________________
Final Exam Strategic Tools for Marketers –Vermillion
Take Home Exam Due via dropbox on5/30 by 9:15pm
You MUST have questions on exam - simply fill in your answers in a different color than blue.
1. How do you tie Perceptual Mapping and Conjoint Analysis together when presenting be specific? (5 pts)
To solve a marketing problem such as when company wants to increase market share, we use two
marketing tools perceptual mapping and conjoint analysis.
Perceptual mapping will help us identify attributes that need to be enhanced in order to reach our desired
positioning and conjoint analysis will calculate market share and help us determine its market barrier.
2. Define Perceptual Mapping and Conjoint Analysis. (4 pts)
Perceptual Mapping is A target minds map their perception at that point is the reality, for its intuitive
understanding we use odd numbers scale, so it has a clear middle and we follow steps, so we don’t lose too
much information. To create a perceptual map, we use 4 step strategy.
Conjoint Analysis simulates market value and puts numerical value on Attribute level. There 3 assumptions:
• Products are just a bunch of attributes.
• Products differ on an attribute level. If we change level product changes as well.
• People have different preferences.
3. What is the problem with conventional marketing? (4 pts)
Conventional marketing leads to head-to-head competition overtime. products start to look very similar
within the market segments. Overall companies start to compete for price instead of producing new products. At
the end functionality increases and price decreases simultaneously.
Legend for Graph above
Use the chart below to answer questions 4-8
Price: $30,000 utility.45 $40,000 utility .25 $50,000 utility .45
Style: Small SUV utility .15 Midsize SUV utility .25 Large SUV utility .35
Material: Vinyl utility .11 Fabric utility .24 Leather utility .11
Brand: Chevy utility .11 Ford utility .03 Dodge utility .05
4. If I was a marketing manager - what is the ideal or best TPU product for chart – be sure to list feature level
and utility? (4 pts)
Price: $50,000 utility .45
Style: Large SUV utility .35
Material: Fabric utility .24
Brand: Chevy utility .11
Total Product Utility =TPU 1.25
5. Tell me why I am crying if I am the Ford, Chevy or Dodge brand manager? (3 pts)
Because based on this chart these brands aren’t popular brands and their utility numbers are very low.
Since intercept represents market intrigued barrier and, on this example, its 1, and of the brands are lower than
that.
6. What can you tell me about price, style and material? Explain your answer! (10pts)
(Make assumptions about numerical value of style and material. Hint: the SUVs cost consumers as follows:
Small SUV $10,000, Midsize $20,000, and Large $30,000, consumer pays following for each material –
Vinyl $200, Fabric $300, and Leather $400)
I would say that they correlate with each other. Price grows by $10,000 and based on material it grows by $100.
Other than that, if we were to calculate overall feature importance
Price range: .45-.25=.2 .2/.53= 37.74%
Style range: .35-.15=.2 .2/.53= 37.74%
Material range: .24-.11=.13 .13/.53= 24.53%
Sum of range = .53
We can see that price and style are equally important features for this brands which makes them “hot buttons”
and material is somewhat less important.
7. What is the most important thing you can tell me about a $40,000, Large SUV, Vinyl, Ford? (2 pts)
Its TPU is .74 which makes it worst possible product.
8. Calculate Market Share for the following SUVs. (15pts) You MUST show your work!
Product A: 30,000, Midsize, Leather, Ford
Product B: 30,000, Midsize, Vinyl, Chevy
Product C: 50,000, Large, Fabric, Dodge
Product A Product B Product C
30,000 .45 30,000 .45 50,000 .45
Midsize .25 Midsize .25 Large .35
Leather .11 Vinyl .11 Fabric .34
Ford .03 Chevy .11 Dodge .05
TPU .84 .92 1.18
Product A = exp(.84)/[exp(.84)+exp(1.18)+exp(.92)]=2.34/(2.34+3.25+2.51)=28.8%
Product B= exp(.92)/[exp(.92)+exp(1.18)+exp(.84)]=2.51/(2.51+3.25+2.34)= 30.99%
Product C= exp(1.18)/[exp(1.18)+exp(.92)+exp(.84)]= 3.25/(3.25+2.51+2.34)=40.12%
9. How many total profiles would the following features and levels create – (only give one number!!!)? (3 pts)
Material: linen cotton denim
Color: blue red white
Style: hip square classic
Sleeves: long short 3/4
Neck: V polo button down
3*3*3*3*3=243
Use the perceptual maps posted on Blackboard under Course Documents and named “Final
Exam Maps” as a guide for the following two questions:
10. List the order of Brand Preference for drinks on the perceptual maps. Explain. (5 pts)
From the most preferred (being closest to the right side of preference line on the second map) to the list.
Pepsi, Coke, Dr. Pepper, 7-Up, Red Bull, Sierra Mist, Mountain Dew, Fresca, Adrenline Rush, Crush.
11. If you were the marketing team for Fresca and wanted to reposition Fresca to be a preferred soft drink
competing with 7-Up and Sierra Mist what would you do? Be specific. (15pts)
I would move fresca in a desirable space.
1. Identify primary attributes
Good reputation, classy, sweet, original flavor
2. Identify secondary attributes
Bold packages, intense carbonation, refreshing, easy to find
Looking at the competitive clusters Fresca would be in the same cluster as 7-Up and Sierra Mist. Would become
easy to find, non-energy refreshing drink.
12. Where are the coordinates for attributes on the SPSS output? (2 pts)
Rotated component matrix - plots points for attribute. Last page of SPSS
13. Where are the coordinates for brands on SPSS? (3 pts)
Plot point of brand is the first page of SPSS data.
Brands are under the variable name (which is vertical) and the variable type is “String”
14. How do you know what recommendations should be considered strong recommendations when doing a
Perceptual Mapping and Conjoint Analysis project for a company? (10 pts)
Perceptual mapping gives us understanding of competitive marketplace, define need attributes and alternatives,
factor analysis with mapping software. Then with conjoint analysis we were able to utilities of cereal features
finding the best and the worst PTU value. After simulating market share, we determine what features need to be
changed in order to have better TPU and only after that we know what to recommend.
[Show More]