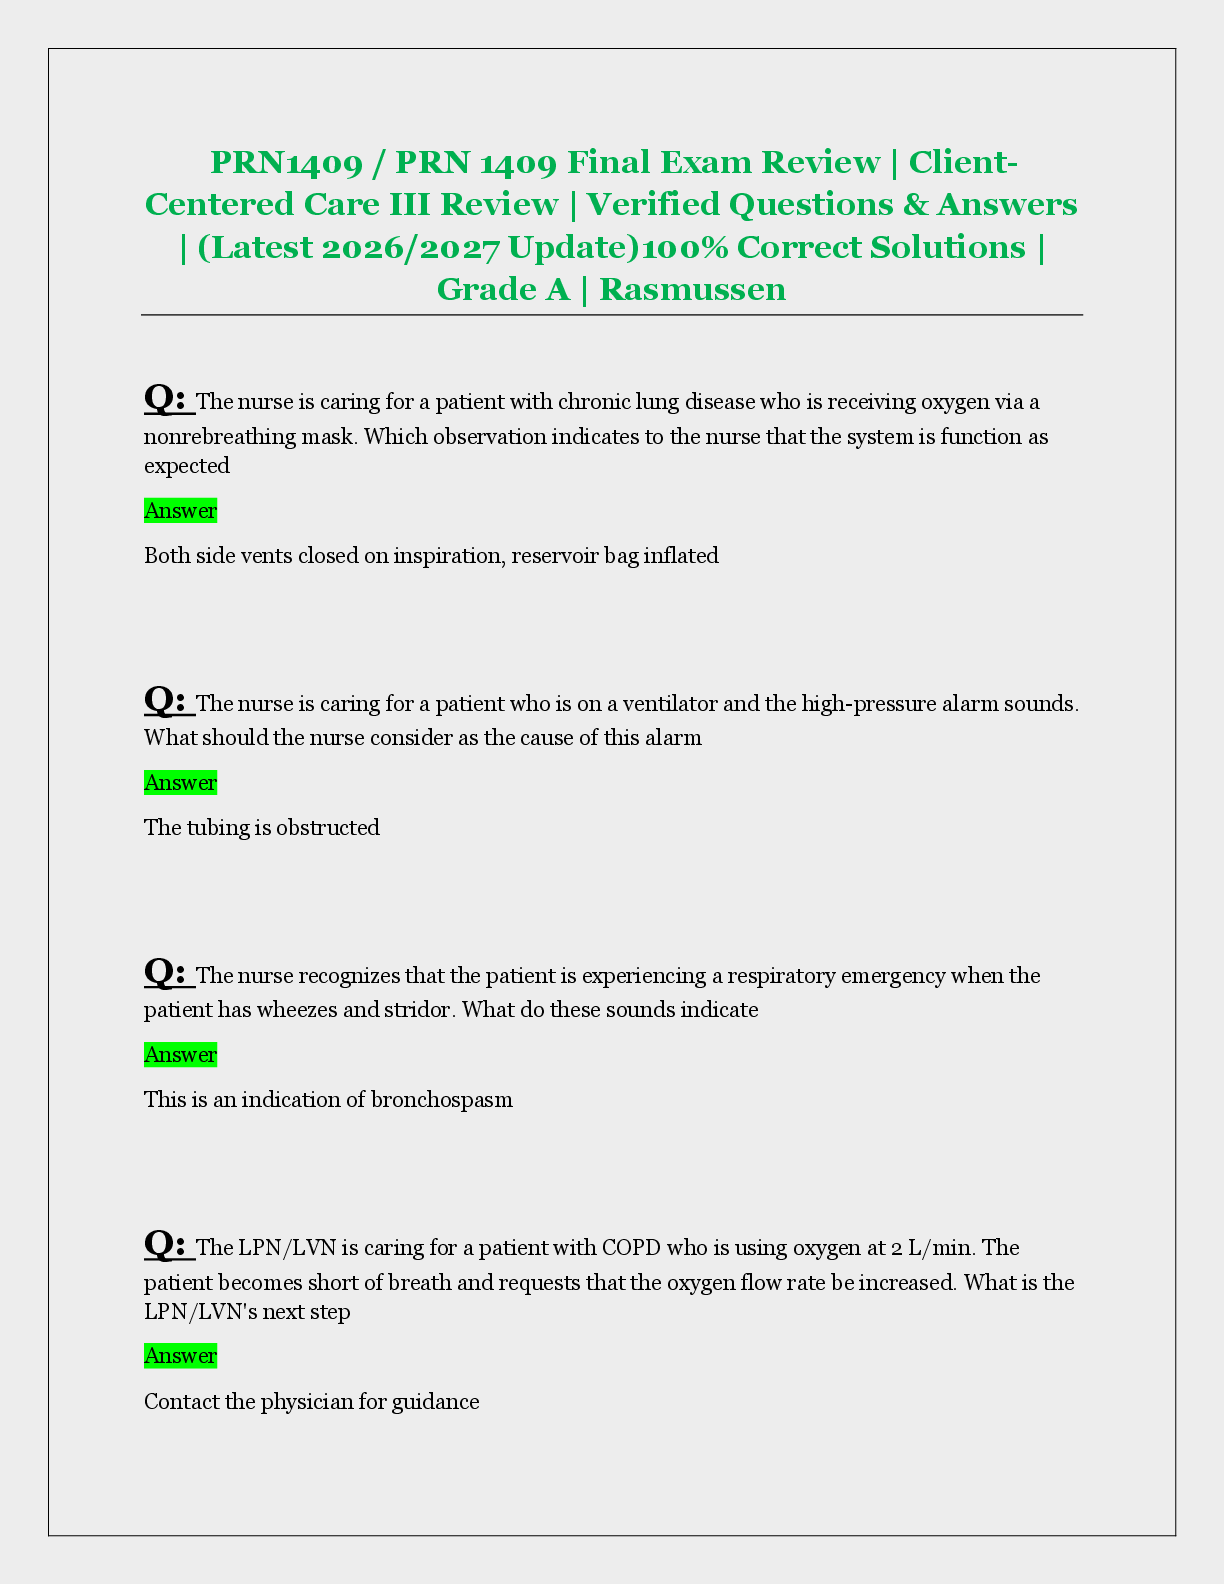
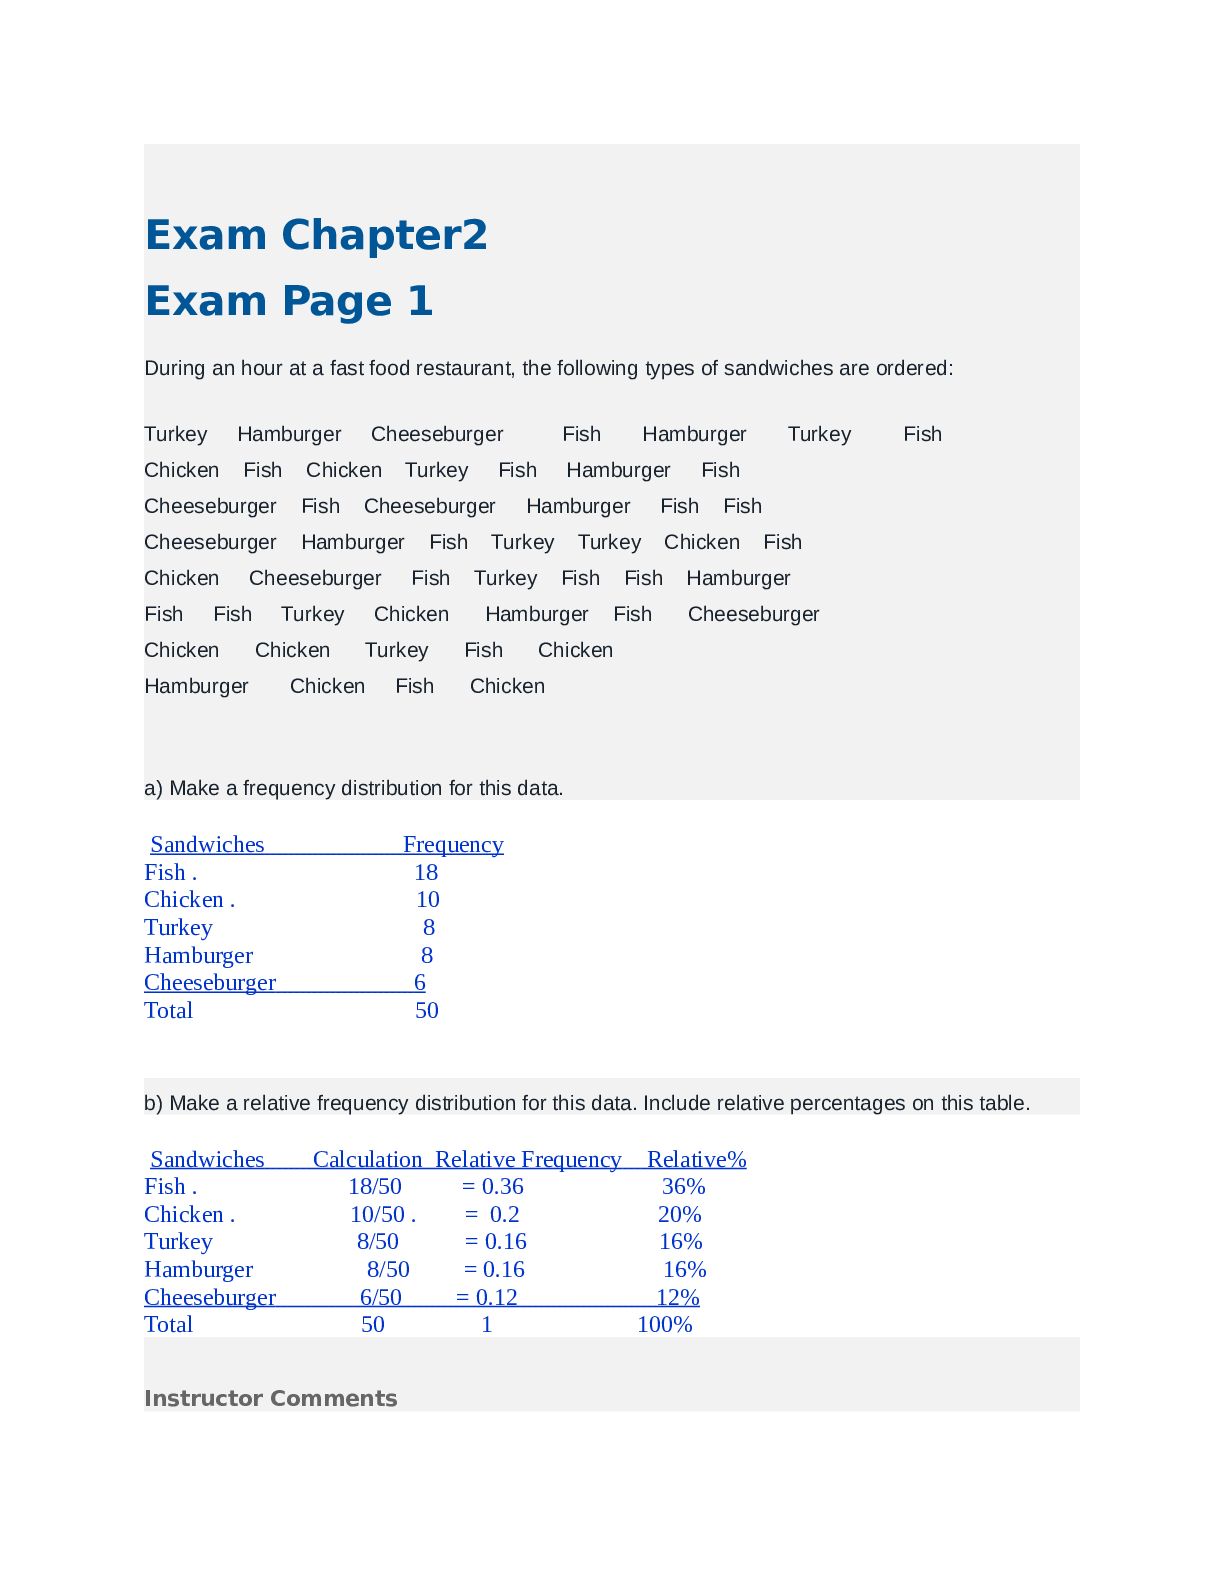
Module 4 Problem Set 1-4 Answers
Problem Set 4.1 Solutions.
1. Solution.
The expected value is given by
So, the convenience store can expect to sell 8.48 boxes of sugar per week.
The variance is given
...
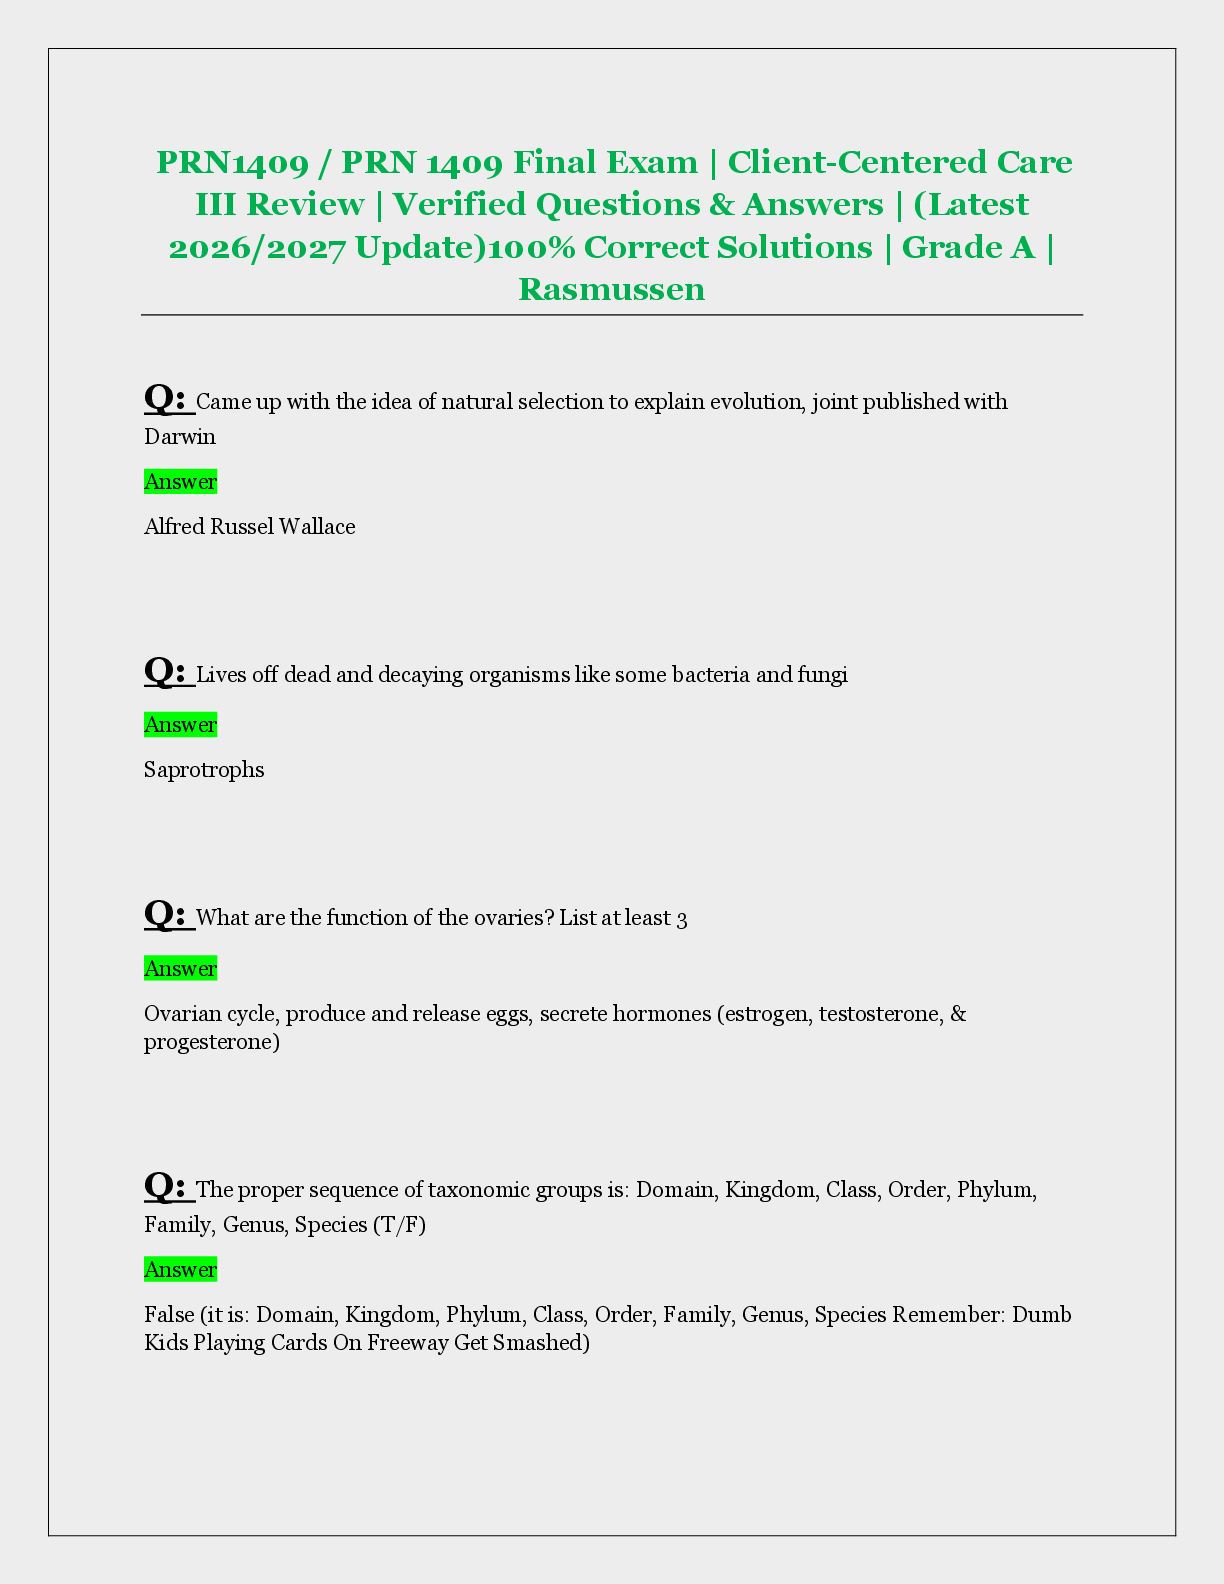
Module 4 Problem Set 1-4 Answers
Problem Set 4.1 Solutions.
1. Solution.
The expected value is given by
So, the convenience store can expect to sell 8.48 boxes of sugar per week.
The variance is given by
The standard deviation is given by:
2. Solution.
The expected value is given by
So, the barber can expect 2.46 customers per hour. The variance is given by
The standard deviation is given by:
3. Solution.
The expected value is given by
So, we can expect 1.7 broken bulbs per box.
Problem Set 4.2 Solutions
1 . Solution.
Here we have n=9, x=7, and p=.75.
2. Solution.
Here we have n=13, x=4, and p=.211.
3. Solution.
For two or less, we must calculate the probability of getting two defective, one defective, and zero defective, then add the probabilities.
For two defective, we have n=6, x=2, and p=.17.
For one defective, we have n=6, x=1, and p=.17.
For zero defective, we have n=6, x=0, and p=.17.
So, the probability of two, one, or zero defective:
.2057+.40178+.3269=.93438.
4. Solution.
The factory will be in danger if more than four safety systems fail. This means that the factory will be in danger if five, six, or seven safety systems fail.
For five failures:
Here we have n=7, x=5, and p=.06.
For six failures:
Here we have n=7, x=6, and p=.06.
For seven failures:
Here we have n=7, x=7, and p=.06.
The probability is given by:
.00001443+.000000307+.0000000028=.00001474.
Problem Set 4.3 Solutions
1. Find P(Z ≤ .35). This is asking for the probability that the standard normal random variable, Z, is less than .35.
Recall that the standard normal distribution table gives us values to the left of the z value, so that is exactly what we want. From the table, we get P(Z ≤ .35) = .63683.
2. Find P(Z ≤ 1.04) . This is asking for the probability that the standard normal random variable, Z, is less than 1.04.
The standard normal distribution table gives us values to the left of the z value, so that is exactly what we want. From the table, we get P(Z ≤ 1.04) = .85083.
3. Find P(Z ≤ - .85). This is similar to the previous two problems. From the table, we get P(Z ≤ - .85)
= .19766.
4. Find P(Z ≤ 1.93). This is similar to the previous three problems. From the table, we get P(Z ≤ 1.93) = .97320.
5. Find P(Z ≤ - .05). This is similar to the previous four problems. From the table, we get P(Z ≤ - .05)
= .48006.
6. Find P(Z ≥ .63) . This is asking for the area to the right of z=.63 (see the shaded area in the diagram below) but if we look up z=.63 in the table, we will get the area to the left of z=.63. Since the total area under the curve is 1, we can use:
P(Z ≥ .63) = 1 - P(Z ≤ .63)
Of course, P(Z ≤ .63) is given directly in the standard normal table and is found to be .73565. So,
P(Z ≥ .63) = 1 - P(Z ≤ .63) = 1 - .73565 = .26435.
7. Find P(Z ≥ - 1.07). P(Z ≤ - 1.07) is given directly in the standard normal table and is found to be . 14231. So,
P(Z ≥ - 1.07) = 1 - P(Z ≤ - 1.07) =1 - .14231 = .85769
8. Find P(Z ≥ .36). P(Z ≤ .36). is given directly in the standard normal table and is found to be . 64058. So,
P(Z ≥ .36) = 1 - P(Z ≤ .36) = 1 - .64058 = .35942
9. Find P(Z ≥ 2.06). P(Z ≤ 2.06). is given directly in the standard normal table and is found to be . 98030. So,
P(Z ≥2.06) = 1 - P (Z ≤ 2.06) = 1 -.98030 =.0197
10. Find P(Z ≥ -.78). P(Z≤ -.78). is given directly in the standard normal table and is found to be . 21770. So,
P(Z ≥ - .78) = 1 - P(Z ≤ - .78) = 1 - .21770 = .7823.
11. Find P(-1.20≤ Z ≤ .50). This is asking for the area shown in the diagram below.
We can think of the area shown in the diagram as the area to the left of z=.50 (which can be read directly from the standard normal table) minus the area to the left of z=-1.20 (which can also be read directly from the standard normal table). So,
P(-1.20 ≤ Z ≤ .50) = P(Z ≤ .50) - P(Z≤ -1.20).
Reading the values in the table:
P(-1.20 ≤ Z ≤ .50) = .69146 - 11507 = .57639.
12. Find Again, we have:
P(.22 ≤ Z ≤ 1.17) = P(Z≤ 1.17) - P(Z ≤ .22)
Reading the values in the table:
P(.22 ≤ Z ≤ 1.17) = .879 - .58706 = .29194
13. Find P(-2.20 ≤ Z ≤ -.63). Again, we have:
P(-2.20 ≤ Z ≤ -.63) = P(Z ≤ -.63) - P(Z ≤ -2.20).
Reading the values in the table:
P(-2.20 ≤ Z ≤ -.63) = .26435 - .01390 = .25045
14. Find P(3.12≤ Z ≤3.33). Again, we have: P(3.12 ≤ Z ≤ 3.33) = P(Z ≤ 3.33) - P(Z ≤ 3.12). Reading the values in the table:
P(3.12 ≤ Z ≤ 3.33) = .99957 - .99910 = .00047
Problem Set 4.4 Solutions.
1. We have µ=10 and σ=3.
a) We must find the z-score for x=13:
So, we want P(Z ≤ 1.0). From the table, we find. P(Z ≤ 1.0). = .84134.
b) We must find the z-score for x=8:
So, we want P(Z ≤ .67). From the table, we find. P(Z ≤ -.67) = .25143.
c) We must find the z-score for x=12:
So, we want P(Z ≥ .67) Since this is greater than, we must use:
d) We must find the z-score for x=6:
So, we want P(Z ≥ -1.33). Since this is greater than, we must use:
e) We must find the z-score for x=17:
and the z-score for x=3:
So, we want
f) We must find the z-score for x=14:
and the z-score for x=8:
So, we want
2. We have µ=2.2 and σ=.55.
a) We must find the z-score for x=2:
So, we want P(Z ≤ -.36) From the table, we find. P(Z ≤ -.36) = .35942.
b) We must find the z-score for x=2.5:
So, we want P(Z ≥ -.55). Since this is greater than, we must use:
c) We must find the z-score for x=2.7:
and the z-score for x=1.8:
So, we want
3. We have µ=565 and σ=113.
Finding percentages in this context is handled in much the same way as finding probabilities.
a) We must find the z-score for x=450:
So, we want P(Z ≤ -1.02). From the table, we find. P(Z ≤ -1.02) = .15386
This means that 100*.15386 or 15.4 % of the scores on the history test were less than 450.
b) We must find the z-score for x=500:
So, we want P(Z ≥ -.58). Since this is greater than, we must use:
This means that 100*.71904 or 71.9 % of the scores on the history test were more than 500.
c) We must find the z-score for x=600:
and the z-score for x=550:
So, we want
This means that 100*.17344 or 17.3 % of the scores on the history test were between 550 and 600.
d) We must find the z-score for x=625:
and the z-score for x=575:
So, we want
4. We have µ=130 and σ=25.
a) We must find the z-score for x=150:
So, we want P(Z ≥ .80) Since this is greater than, we must use:
b) We must find the z-score for x=120:
So, we want P(Z ≤ -.4). From the table, we find. P(Z ≤ -.4) = .34458.
c) We must find the z-score for x=150:
and the z-score for x=110:
So, we want
[Show More]


.png)
 2e Peter Olver, Chehrzad Shakiban.png)