You passed this Milestone
16 questions were answered correctly.
4 questions were answered incorrectly.
1
On a recent news report, Taylor heard that, on average, most Americans get
six hours of sleep each night. The
...
You passed this Milestone
16 questions were answered correctly.
4 questions were answered incorrectly.
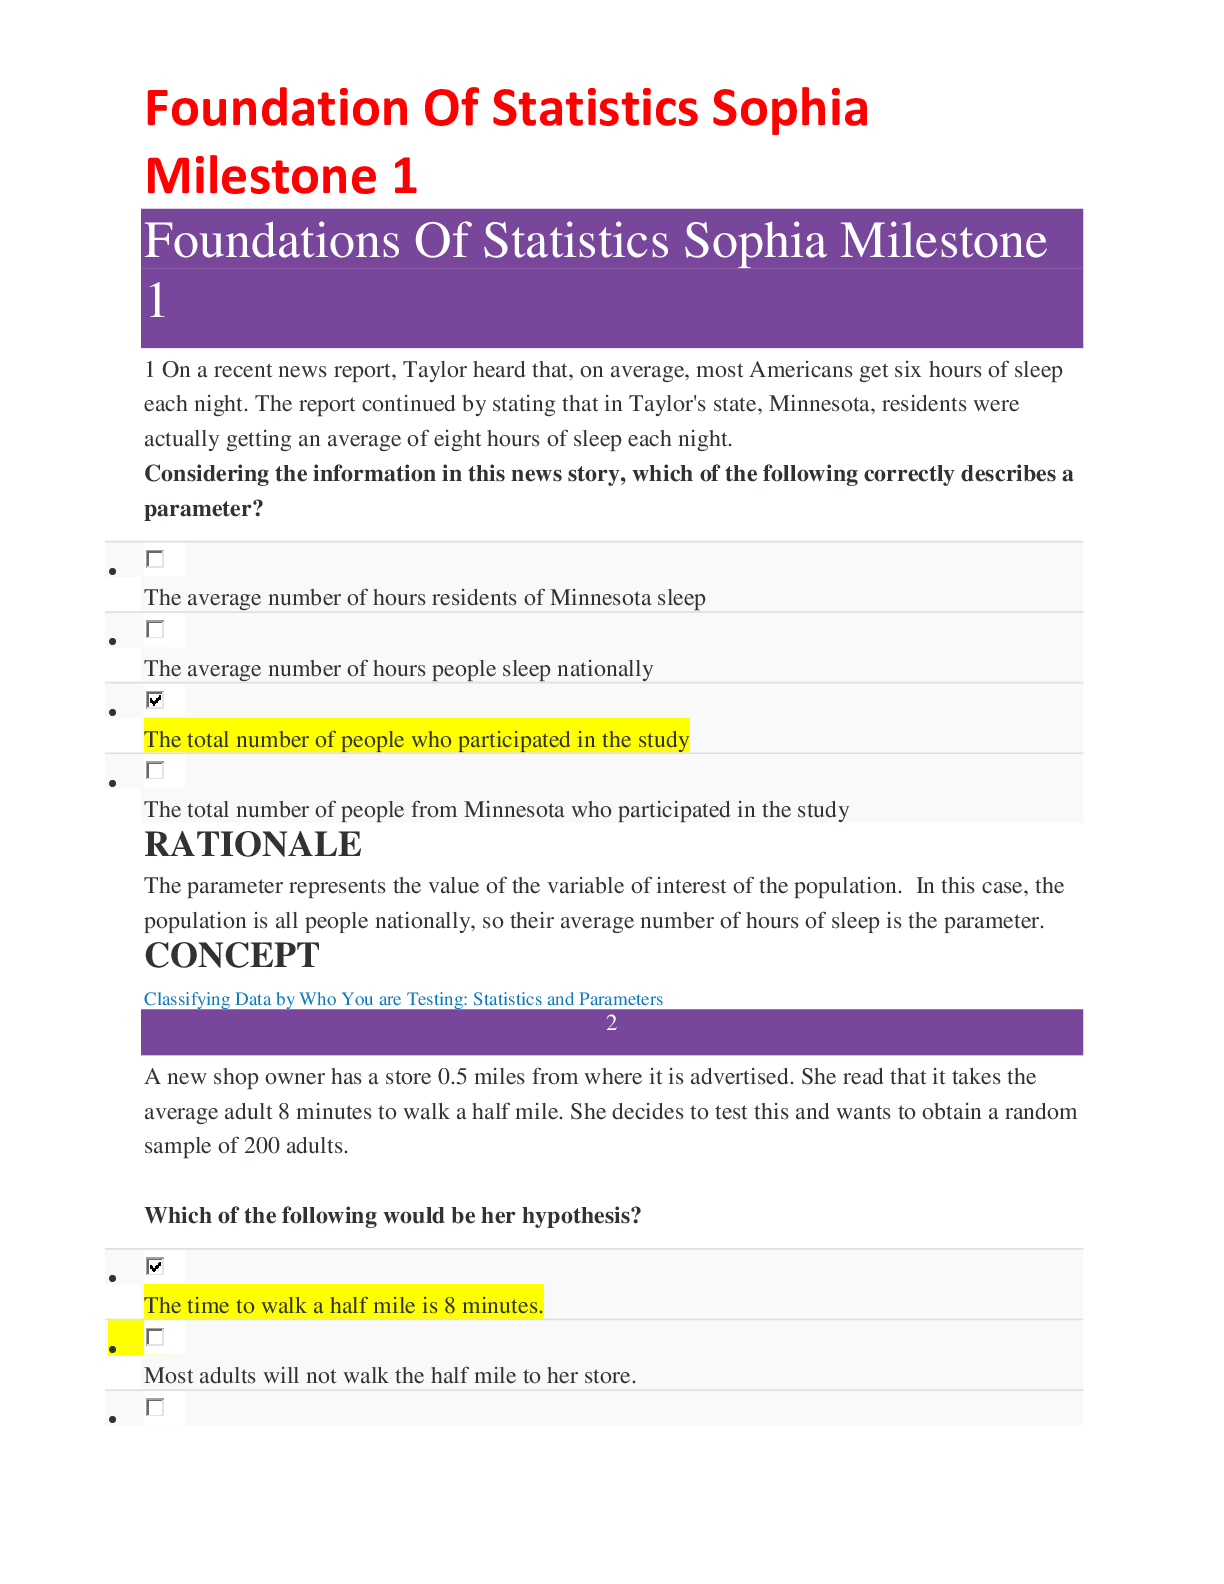
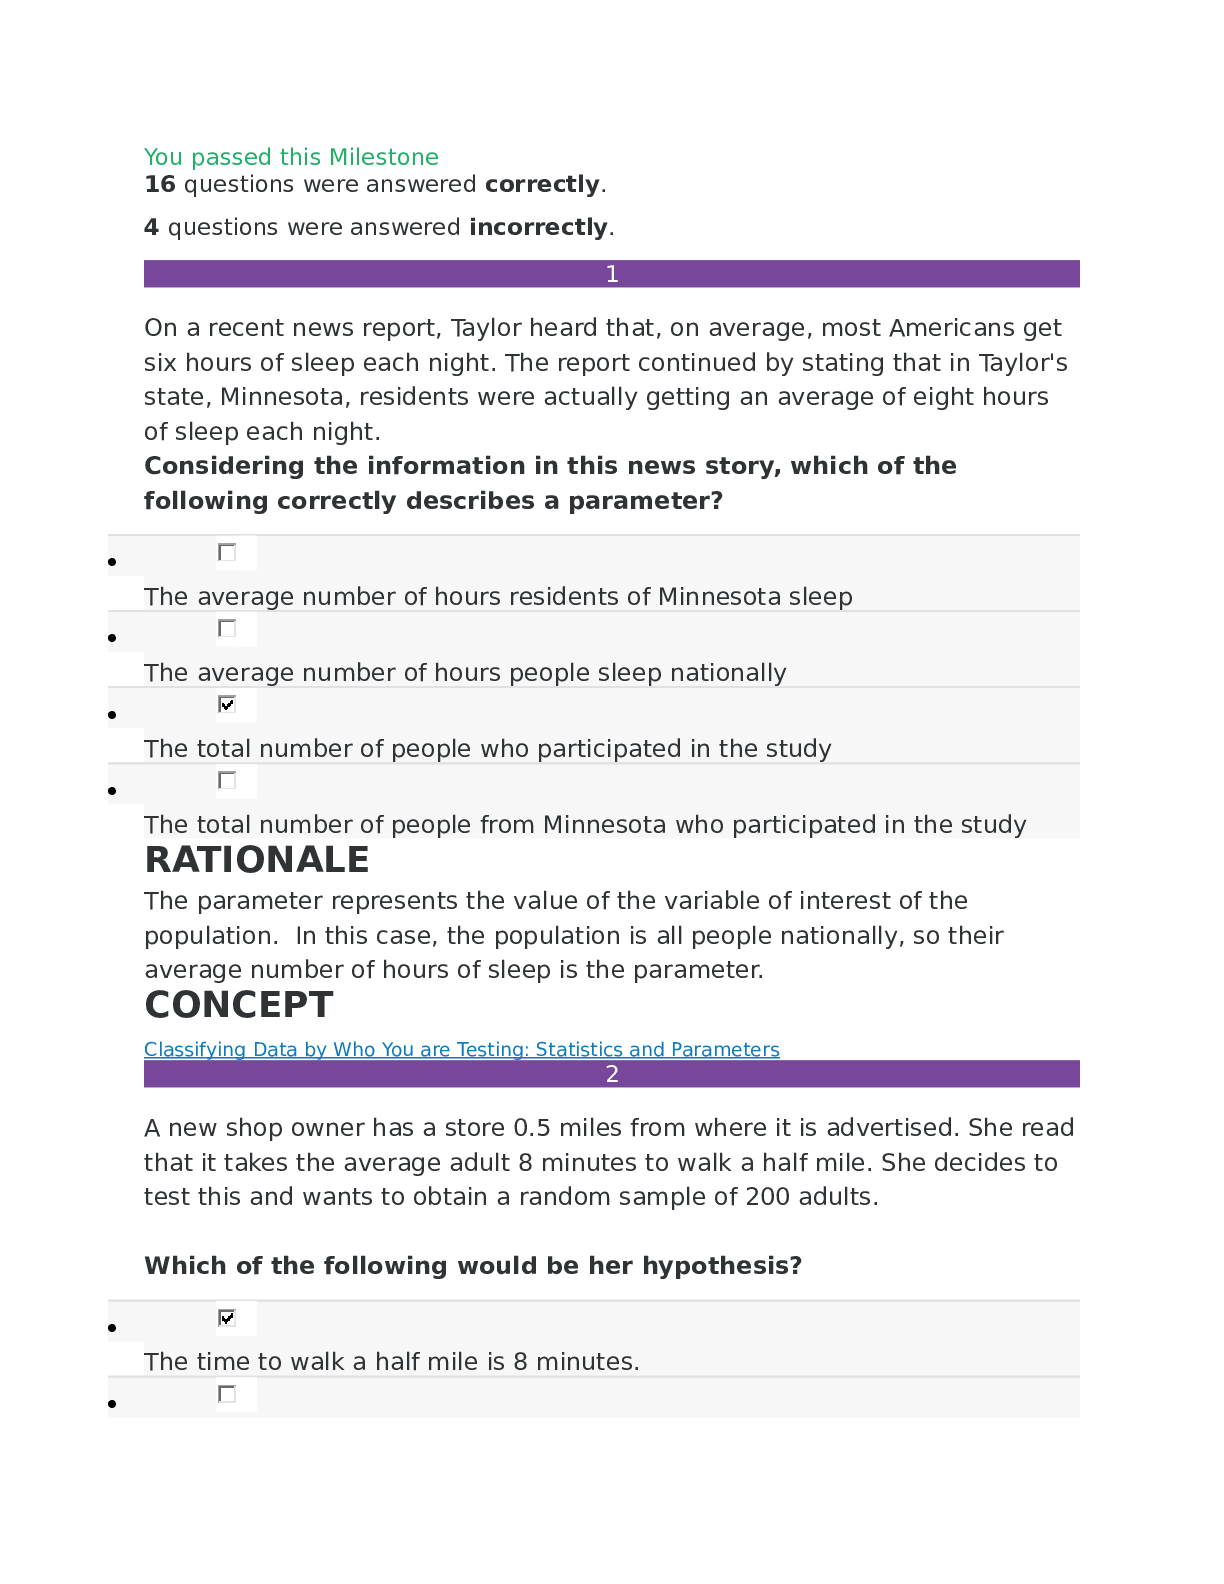
1
On a recent news report, Taylor heard that, on average, most Americans get
six hours of sleep each night. The report continued by stating that in Taylor's
state, Minnesota, residents were actually getting an average of eight hours
of sleep each night.
Considering the information in this news story, which of the
following correctly describes a parameter?
The average number of hours residents of Minnesota sleep
The average number of hours people sleep nationally
The total number of people who participated in the study
The total number of people from Minnesota who participated in the study
RATIONALE
The parameter represents the value of the variable of interest of the
population. In this case, the population is all people nationally, so their
average number of hours of sleep is the parameter.
CONCEPT
Classifying Data by Who You are Testing: Statistics and Parameters
2
A new shop owner has a store 0.5 miles from where it is advertised. She read
that it takes the average adult 8 minutes to walk a half mile. She decides to
test this and wants to obtain a random sample of 200 adults.
Which of the following would be her hypothesis?
The time to walk a half mile is 8 minutes.
Most adults will not walk the half mile to her store.
The time to walk a half mile is greater than 8 minutes.
The time to walk a half mile is less than 8 minutes.
RATIONALE
Since we are only testing whether or not the average time is 8 minutes or
not, that is our null hypothesis.
CONCEPT
Setting up an Experiment
3
You want to figure out if the amount of sleep you get at night helps increase
the grade you get on an exam the following day. You decide to record how
many hours of sleep you and your friends got before an exam along with the
grade you received on that exam. You then plot the results on a scatterplot
and find that as the number of hours of sleep goes up, so do the exam
grades. You then conclude that increased sleep causes higher exam scores.
Is your conclusion necessarily true?
No, because the apparent correlation between sleep and exam scores might
be caused by another variable.
Yes, because sleep and exam scores are highly correlated.
Yes, because as the number of hours of sleep increases, so do exam scores.
No, because the number of hours of sleep and exam scores are not
necessarily correlated.
RATIONALE
Recall that just because two variables show a correlation on a graph, it does
not mean they are correlated in practicality. It's very possible that other
factors cause the increase in grades such as the amount of studying that is
done.
CONCEPT
Cautions About Correlations and Causation
4
As project manager for an online-course design company, Rachel had data
that applied to several different course-development methods. When the
company began preparing the next course set, Rachel was interested in how
development time varied with each method.
Determine which graph would have the largest standard deviation.
RATIONALE
Standard deviation is a measure of spread of the data so the one with the
largest standard deviation would be the widest looking graph.
CONCEPT
Representing How Data Can Vary
5
Derek recently started a new diet and exercise program. He was curious to
know what exercise would help him burn the greatest amount of calories. He
asked his friend Mike, who is a personal trainer, for help. During each
exercise, Mike recorded the time Derek spent doing an exercise while Derek
kept his intensity relatively constant, and they tracked how many calories
each exercise burned.
Derek and Mike are in effect performing an experiment that
contains explanatory and response variables. Which statement best
describes the explanatory and response variables involved in this
experiment?
Calories burnt is the explanatory variable and exercise is the response
variable, because the calories burnt manipulates the type of exercise.
Exercise type is the explanatory variable and calories burnt is the response
variable, since each exercise causes Derek to burn calories differently.
Exercise type is the response variable and calories burnt is the explanatory
variable, since different exercises will cause more calories to be burnt.
Calories burnt is the response variable and exercise type is the explanatory
variable, because Mike measures exercises as he records calories burnt.
RATIONALE
Derek is assuming that the number calories burned is dependent upon the
type of exercise he is performing. Therefore, calories is the response or
dependent variable and exercise type is the independent or explanatory
variable since it explains the amount of calories Derek burned.
CONCEPT
Importance of Experiments
6
In a normal distribution, which statement best describes the
relationship between mean, median, and mode?
The mean will always be the smallest value, while the mode and median will
be the same.
The mean and median will fall in the center of the distribution and the
mode will be larger than both.
The mean, median, and mode always are equal to one another and lie in the
center of the distribution.
The mode will be in the center of t
[Show More]


.png)