Week 8 Assignment: Correlation and Causation
Understand the difference between correlation and causation
Question
True or False: The more samples taken in a scientific study, the longer the amount
of time it will tak
...
Week 8 Assignment: Correlation and Causation
Understand the difference between correlation and causation
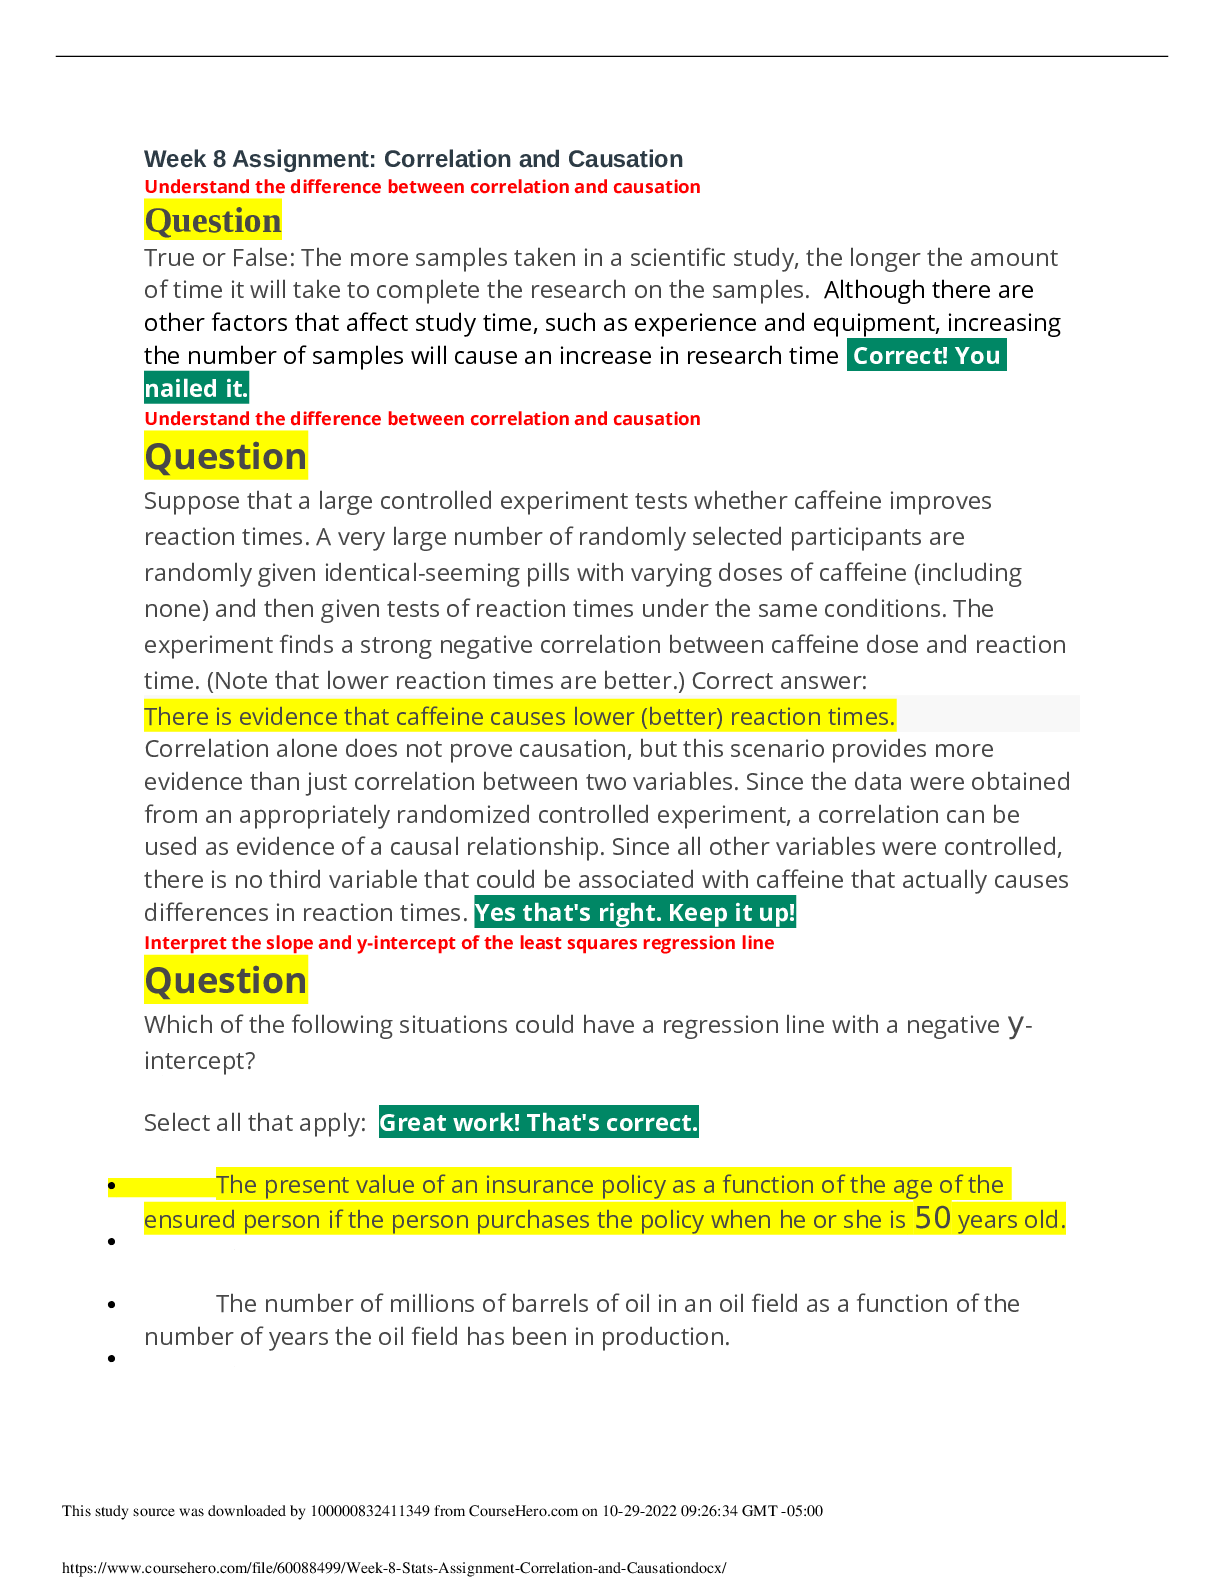
Question
True or False: The more samples taken in a scientific study, the longer the amount
of time it will take to complete the research on the samples. Although there are
other factors that affect study time, such as experience and equipment, increasing
the number of samples will cause an increase in research time. Correct! You
nailed it.
Understand the difference between correlation and causation
Question
Suppose that a large controlled experiment tests whether caffeine improves
reaction times. A very large number of randomly selected participants are
randomly given identical-seeming pills with varying doses of caffeine (including
none) and then given tests of reaction times under the same conditions. The
experiment finds a strong negative correlation between caffeine dose and reaction
time. (Note that lower reaction times are better.) Correct answer:
There is evidence that caffeine causes lower (better) reaction times.
Correlation alone does not prove causation, but this scenario provides more
evidence than just correlation between two variables. Since the data were obtained
from an appropriately randomized controlled experiment, a correlation can be
used as evidence of a causal relationship. Since all other variables were controlled,
there is no third variable that could be associated with caffeine that actually causes
differences in reaction times. Yes that's right. Keep it up!
Interpret the slope and y-intercept of the least squares regression line
Question
Which of the following situations could have a regression line with a negative yintercept?
Select all that apply: Great work! That's correct.
The present value of an insurance policy as a function of the age of the
ensured person if the person purchases the policy when he or she is 50 years old.
The number of millions of barrels of oil in an oil field as a function of the
number of years the oil field has been in production.
This study source was downloaded by 100000831988016 from CourseHero.com on 01-07-2022 03:17:55 GMT -06:00
https://www.coursehero.com/file/60088499/Week-8-Stats-Assignment-Correlation-and-Causationdocx/
The value of a Fortune-500 company, founded in the year 1990, as a
function of the number of years after the year 2010.
The value of a rail locomotive as a function of the number of years since it
was put into service.
Interpret the slope and y-intercept of the least squares regression line
Question
Which of the following data sets or plots could have a regression line with a
negative slope? Select all that apply. Perfect. Your hard work is paying off �
The number of tons of trash in a landfill as a function of the number of years
since the landfill was built.
The number of loads of trash a dump truck hauls per month as a function of
the number of years since the dump truck was built.
The number of tons of trash produced in a city as a function of the
population.
The number of minutes you will wait to drop off your trash at a landfill as a
function of the number of dump trucks at the landfill
Correct answer: The slope is related to the increase or decrease of the dependent
variable as a function of the independent variable. If the dependent variable can
decrease, then the slope can be negative.
Understand the difference between correlation and causation
Question
Suppose that data collected from police reports of motor vehicle crashes show a
moderate positive correlation between the speed of the motor vehicle at the time
of the crash and the severity of injuries to the driver. Answer the following question
based only on this information.
True or false: It can be concluded that the faster a motor vehicle is traveling at the
time of a crash, the more severe the injuries to the driver are.
Well done! You got it right.Correlation does not prove causation. The provided
information shows that there is a positive association between speed and severity
of injuries, but that information alone is not sufficient to conclude that greater
This study source was downloaded by 100000831988016 from CourseHero.com on 01-07-2022 03:17:55 GMT -06:00
https://www.coursehero.com/file/60088499/Week-8-Stats-Assignment-Correlation-and-Causationdocx/
speed causes more severe injuries. Based only on this information, there could be a
third variable associated with speed that causes more severe injuries in crashes.
That said, the statement "the faster a motor vehicle is traveling at the time of a
crash, the more severe the injuries to the driver are" does not imply a causal
relationship between speed and severity of injuries.
Understand the difference between correlation and causation
Question
An experiment finds that runners with the longest legs complete a mile run in less
time. Identify the relation between leg length and time of a mile run. Leg length
and time of a mile run are negatively correlated.
A longer leg length is associated with a lower time of a mile run, which implies a
negative relationship. There would need to be more evidence to prove
causation.Yes that's right. Keep it up!
Interpret the slope and y-intercept of the least squares regression line
Question
Which of the following situations would have data sets or plots that could have a
regression line with a positive slope? Select all that apply. Great work! That's
correct.
Correct answer:
The cumulative number of ships launched by ship builders as a function of the
number of months since the start of the year
The number of cars produced as a function of the number of days since the end of
the last strike.
The total shipping orders that are backlogged as a function of the number of ships
in drydock.
The slope is related to the increase or decrease of the dependent variable as a
function of the independent variable. If the dependent variable can increase, then
the slope can be positive, such as with the cumulative number of ships launched.
Interpret the slope and y-intercept o
[Show More]











![Preview of [SOLVED] EDCO 740 / EDCO740 Quiz 1 (LATES 2021/2022 Graded A)](https://scholarfriends.com/storage/EDCO_740_Quiz_1.png)

