Statistics > SOPHIA Milestone > Sophia Statistics Final Milestone Course Hero.pdf. QUESTIONS WITH ACCURATE ANSWERS. GRADED A+ (All)
Sophia Statistics Final Milestone Course Hero.pdf. QUESTIONS WITH ACCURATE ANSWERS. GRADED A+
Document Content and Description Below
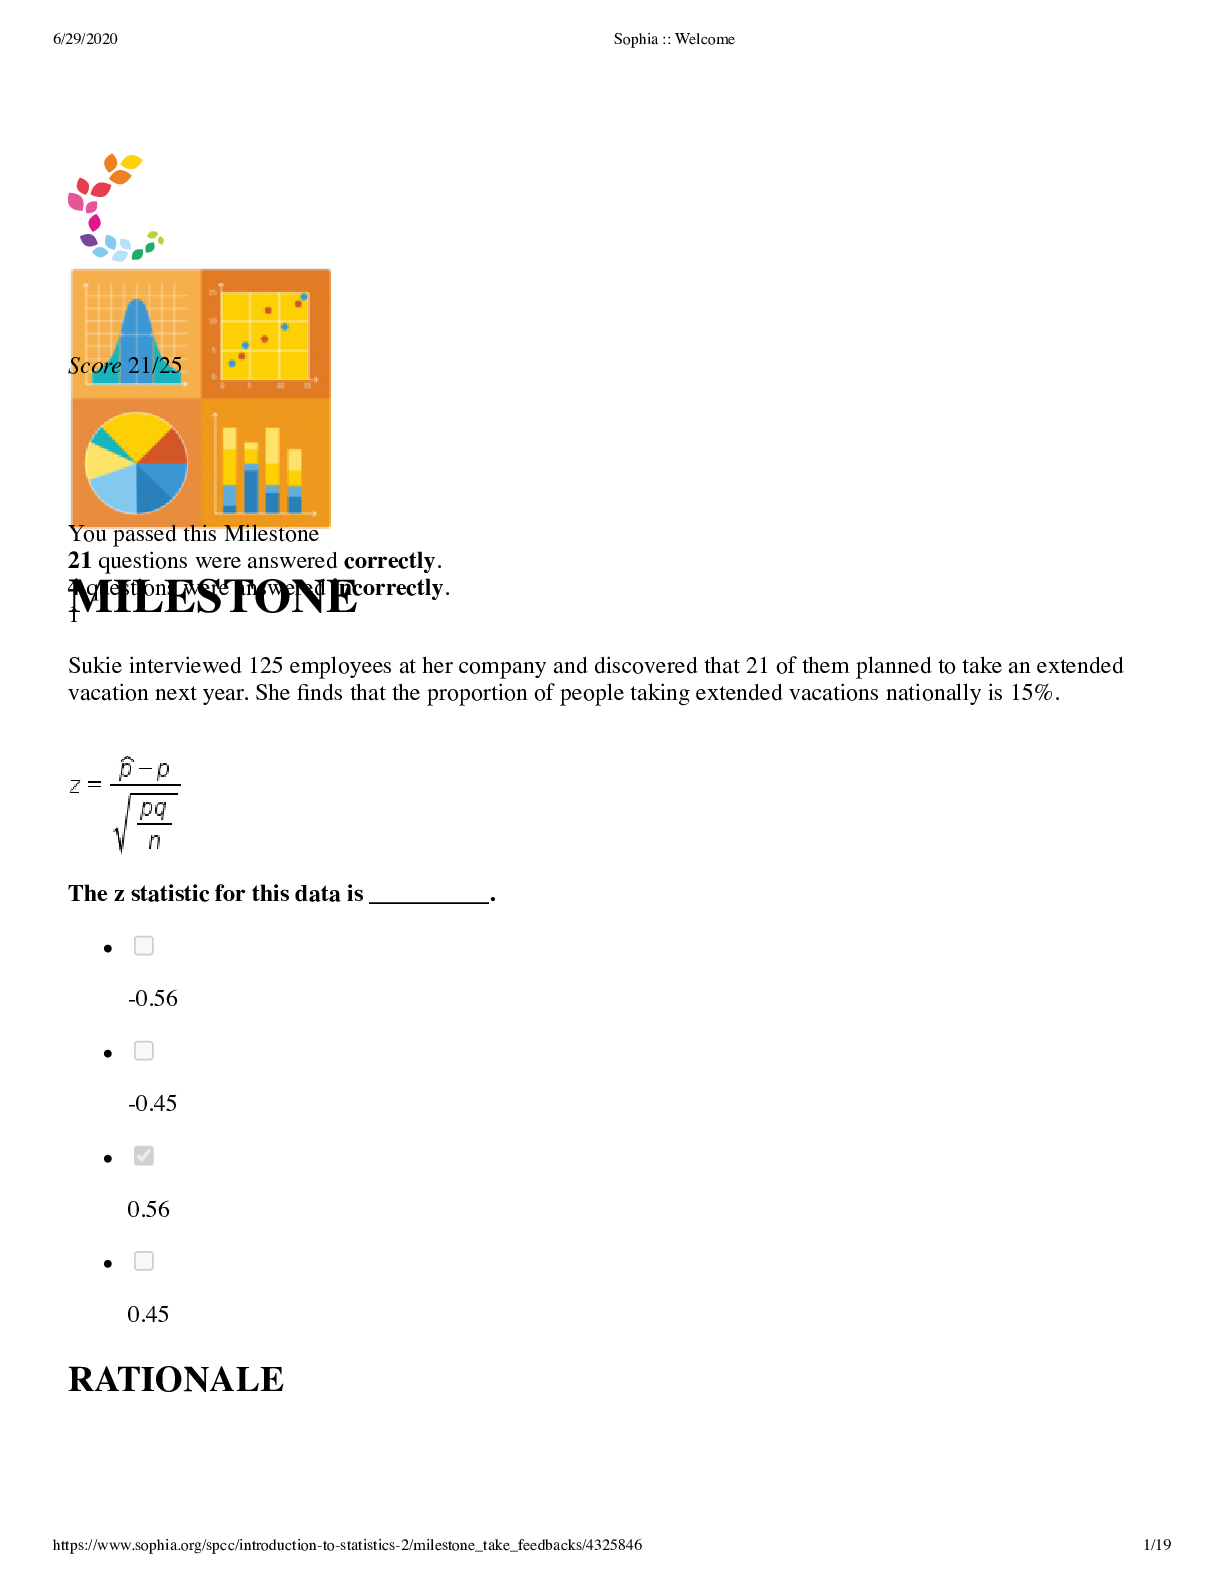
You passed this Milestone 21 questions were answered correctly. 4 questions were answered incorrectly. 1 Sukie interviewed 125 employees at her company and discovered that 21 of them planned to ta... ke an extended vacation next year. She finds that the proportion of people taking extended vacations nationally is 15%. The z statistic for this data is __________. -0.56 -0.45 0.56 0.45 RATIONALE 6/29/2020 Sophia :: Welcome https://www.sophia.org/spcc/introduction-to-statistics-2/milestone_take_feedbacks/4325846 2/19 To make things a little easier, let's first note the denominator We can now note that Finally, subbing all in we find CONCEPT Z-Test for Population Proportions 2 Jesse takes two data points from the weight and feed cost data set to calculate a slope, or average rate of change. A rat weighs 3.5 pounds and costs $4.50 per week to feed, while a Beagle weighs 30 pounds and costs $9.20 per week to feed. Using weight as the explanatory variable, what is the slope of the line between these two points? Answer choices are rounded to the nearest hundredth. $0.31 / lb. $1.60 / lb. $5.64 / lb. $0.18 / lb. RATIONALE In order to get slope, we can use the formula: . Using the information provided, the two points are: (3.5 lb., $4.50) and (30 lb., $9.20). We can note that: CONCEPT 6/29/2020 Sophia :: Welcome https://www.sophia.org/spcc/introduction-to-statistics-2/milestone_take_feedbacks/4325846 3/19 Linear Equation Algebra Review 3 A research team conducts a survey to determine the area of land used for farming in Iowa. The team randomly selects house addresses and sends the survey by mail. Which type of sampling method is the research team using? Simple random sampling Systematic random sampling Multi-stage sampling Cluster sampling RATIONALE By choosing randomly from the house addresses all households should have an equal chance of being chosen. This would make it a simple random sample. CONCEPT Simple Random and Systematic Random Sampling 4 Katherine, Jonathan, and Ryan went bowling. Afterwards, two of them decided to make bar graphs to plot their scores. Who made Graph 2, and why? Jonathan, because he wanted to make the scores appear reasonably close. 6/29/2020 Sophia :: Welcome https://www.sophia.org/spcc/introduction-to-statistics-2/milestone_take_feedbacks/4325846 4/19 Katherine, because she wanted to make the scores appear reasonably close. Katherine, because she wanted to accurately show each person's score. Jonathan, because he wanted to make the scores appear very different. RATIONALE Since there was a competition, the person who most likely made this graph would want to represent themselves favorably. Jonathan appears to be the lowest scorer in both graphs, but in graph 2 it looks like he scored about the same as Ryan and Katherine. Jonathan probably made this graph to make it appear as if his score was close to the others. CONCEPT Misleading Graphical Displays 5 Which of the following is an example of a false positive? Test results indicate that a patient has cancer when, in fact, he does not. [Show More]
Last updated: 2 years ago
Preview 1 out of 19 pages
Buy this document to get the full access instantly
Instant Download Access after purchase
Buy NowInstant download
We Accept:

Reviews( 0 )
$7.00
Can't find what you want? Try our AI powered Search
Document information
Connected school, study & course
About the document
Uploaded On
Mar 30, 2022
Number of pages
19
Written in

Additional information
This document has been written for:
Uploaded
Mar 30, 2022
Downloads
0
Views
128