BioChemistry > Lab Report > Biochemistry Lab Report - Spectrophotometry, Quantification of Protein Concentration, Chromatography (All)
Biochemistry Lab Report - Spectrophotometry, Quantification of Protein Concentration, Chromatography, Gel Electrophoresis, Gel Electrophoresis of Proteins
Document Content and Description Below
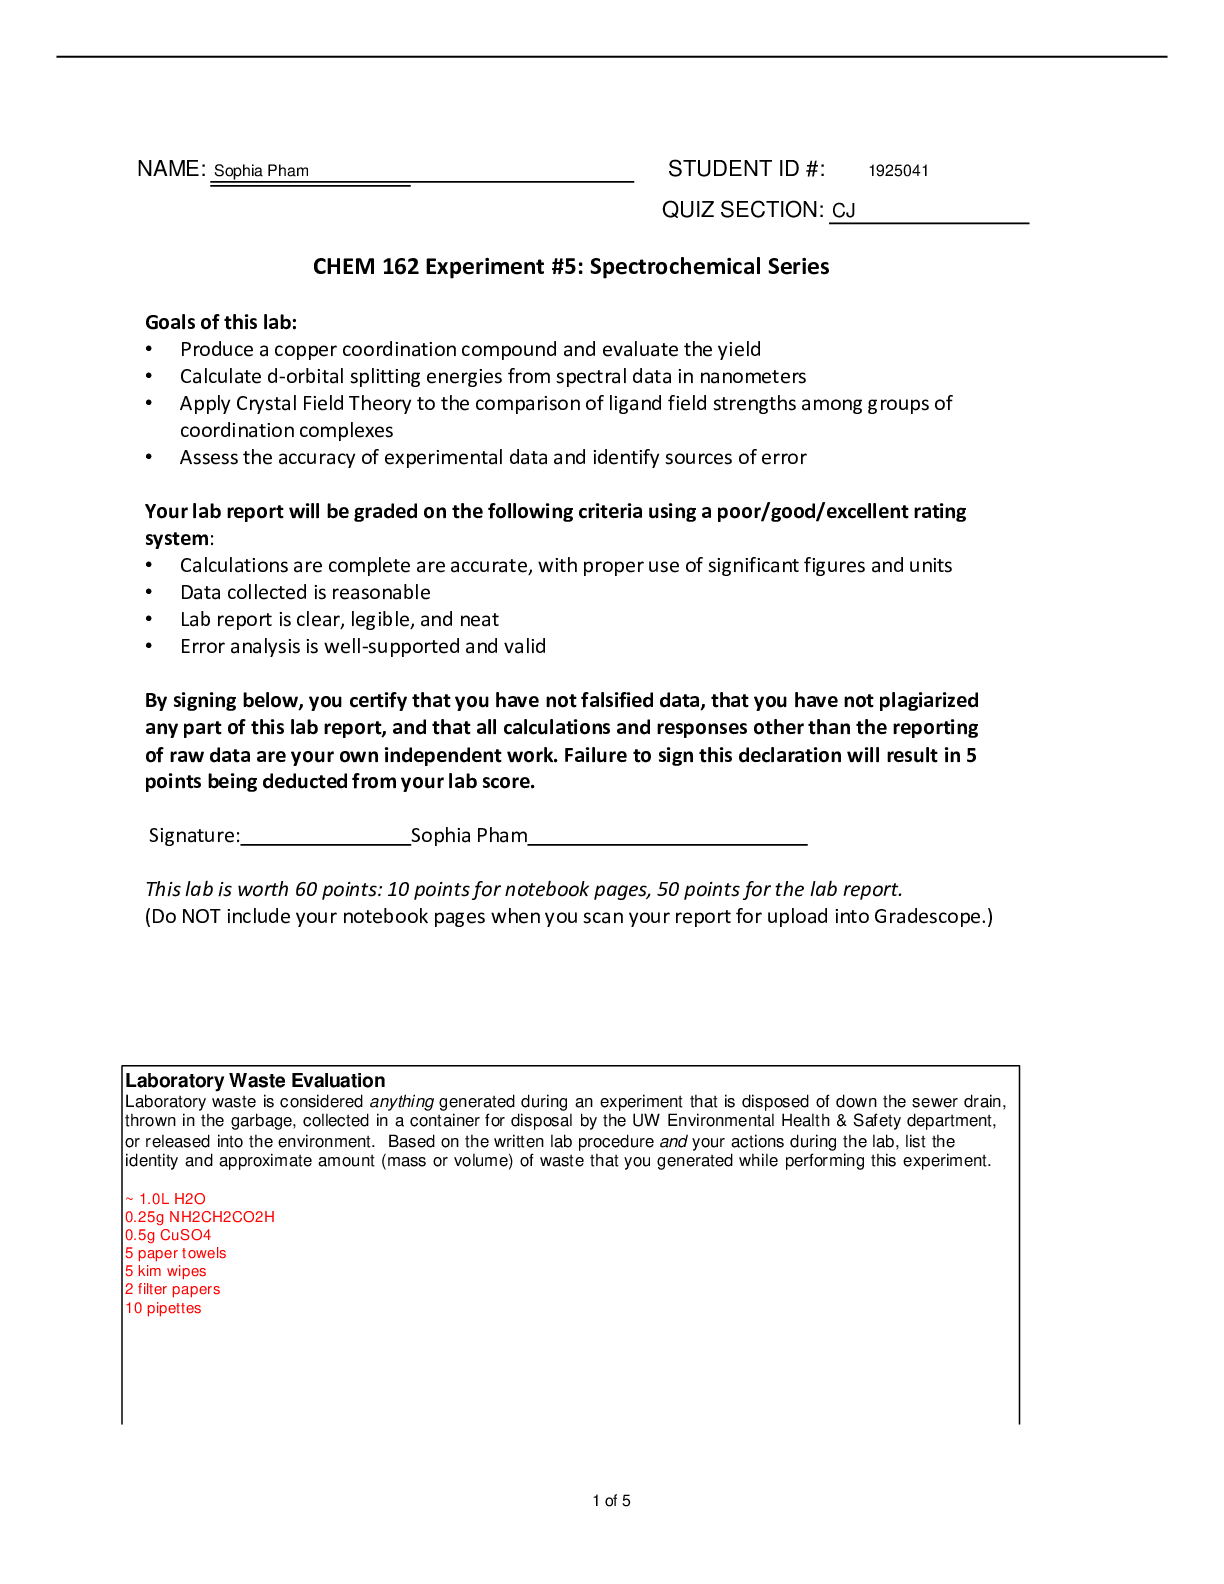
Biochemistry Lab Report 1 Spectrophotometry, Quantification of Protein Concentration, Chromatography, Gel Electrophoresis, Gel Electrophoresis of Proteins Abstract Over the course of three lab per ... iods, many experiments were performed in order to set up a stable base for this class of Biochemistry lab. To do this, we made many measurements to create many standard graphs so that we have them in our arsenal for future experiments. In order to perform detailed studies on the structure and function of specific biomolecules, we must first be able to purify the biomolecule of interest. Some methods of purification include Affinity Chromatography and Size Exclusion Chromatography. After, we must perform qualitative and quantitative tests on these compounds of interest to understand how much of it is present and what are some of its features. A range of methods and devices can be utilized to preform these tests. Quantitative tests are especially important because they tell us how well we have purified the compound of interest. A great device used to perform these tests is the spectrophotometer. We can also use a gel electrophoresis to determine whether multiple proteins are present after our attempts to purify proteins. Introduction Throughout many lab periods, multiple new techniques were used in order to perform both qualitative and quantitative analyses of a few different compounds of interest. These important laboratory techniques enable us to attain valuable information about our desired compound such as absorbance, concentration, pH, and activity. One of the most important techniques used was the purification of a specific compound. The first technique that was used was Spectrophotometry. The purpose of this technique is to determine the amount of light that is absorbed by a specific compound at a specific wavelength or over a range of wavelengths. In order to properly measure the amount of light absorbed by a specific compound, a “blank” is usually tested first. The blank contains everything that the cuvette with the compound has (buffer, etc.) except it lacks the compound. By lacking the compound, it can account for the absorption of light that takes place due to other compoundsBiochemistry Lab Report 1 2 in the cuvette, thus providing us the precise absorption of the compound of interest within the cuvette. There are different types of spectrophotometers but the one that we used is known as “Spectronic-20”. This type of spectrophotometer can only test in a range of 340 nm – 650 nm wavelengths. Within compounds, there exist many different bonds and electrons that absorb light at specific wavelengths. A very specific amount of light of the right energy will excite the compound. The light that the spectrophotometer shoots out is known as the “incident light” (Io). This light is then split into “transmitted light” (I), which is read by the spectrophotometer and the absorbed light. These important numbers are part of an equation known as “Beer’s Law”. Qualitatively, this law simply means that the amount of light absorbed by the compound is proportional to the concentration of a colored compound. Quantitatively however, this law is written as A = Ecl. Where E is the absorption coefficient, c is the concentration, l is the path length, and A is the absorption. In our lab, our compound of interest was p-nitrophenol (PNP). The first thing we did, Experiment 2.1, was test a known concentration of basic and acidic forms of PNP at different wavelengths on the spectrophotometer in order to find the where its absorption was highest, also known as maximum absorption. By finding this critical wavelength, we were able to use it in Experiment 2.2 as a constant when testing PNP at different pHs. After testing the absorption at different pHs, we are able to make a pH vs. Absorption graph and to find the pKa of PNP. The pKa of a compound is the pH where there are equal concentrations of basic and acidic forms of the compound. The maximum absorption was also used in Experiment 2.3 to test the absorption of PNP at different concentrations (but constant pH) in order to form a concentration vs. Absorption graph. Using this graph, we could find the concentration of an unknown amount of PNP from its absorption. In experiment 2.4, we will use the graph from experiment 2.2 (pH vs. Absorbance) in order to find the pH of a solution that PNP is mixed with. The whole point of quantifying the concentration of proteins is to determine how well we purified a protein. If the protein we are looking for is an enzyme, we could also test its activity to see how concentrated it is. One method of protein quantification is known as the Bradford Method. This was utilized in experiment 3.1, in order to determine the concentration of an unknown amount of Bovine Serum Albumen (BSA). A dye known as “Coomasie Brilliant Blue” is used, and although it normally has absorption of 465 nm, when it is mixed with proteins, it forms non-covalent bonds that bump its absorption up to 595 nm. This phenomenon is known as3 “Red Shift.” Some of these non-covalent bonds include Van Der Waals and electrostatic interactions. In order to find the concentration of the unknown BSA, the absorbance must be taken at 595 nm and compared to the standard curve of known concentrations of BSA vs. Absorbance. An important method in purifying proteins is Chromatography. Using this method, you can separate molecules based on the molecular weight, their charge, or even their affinities to other molecules. There are two phases in chromatography: a stationary phase and a mobile phase. In the stationary phase, the column is filled with a gel or bead-like mixture specific to the type of chromatography you want to perform or molecule you want to purify. In the mobile phase, a solvent passes through the column [Show More]
Last updated: 3 years ago
Preview 1 out of 24 pages
 (1).png)
Buy this document to get the full access instantly
Instant Download Access after purchase
Buy NowInstant download
We Accept:

Reviews( 0 )
$14.00
Can't find what you want? Try our AI powered Search
Document information
Connected school, study & course
About the document
Uploaded On
Apr 19, 2022
Number of pages
24
Written in
All
Additional information
This document has been written for:
Uploaded
Apr 19, 2022
Downloads
0
Views
256


.png)





.png)



.png)

