Statistics > QUESTIONS & ANSWERS > MATH 534 Week 7 Course Project Part C: Regression and Correlation Analysis. (All)
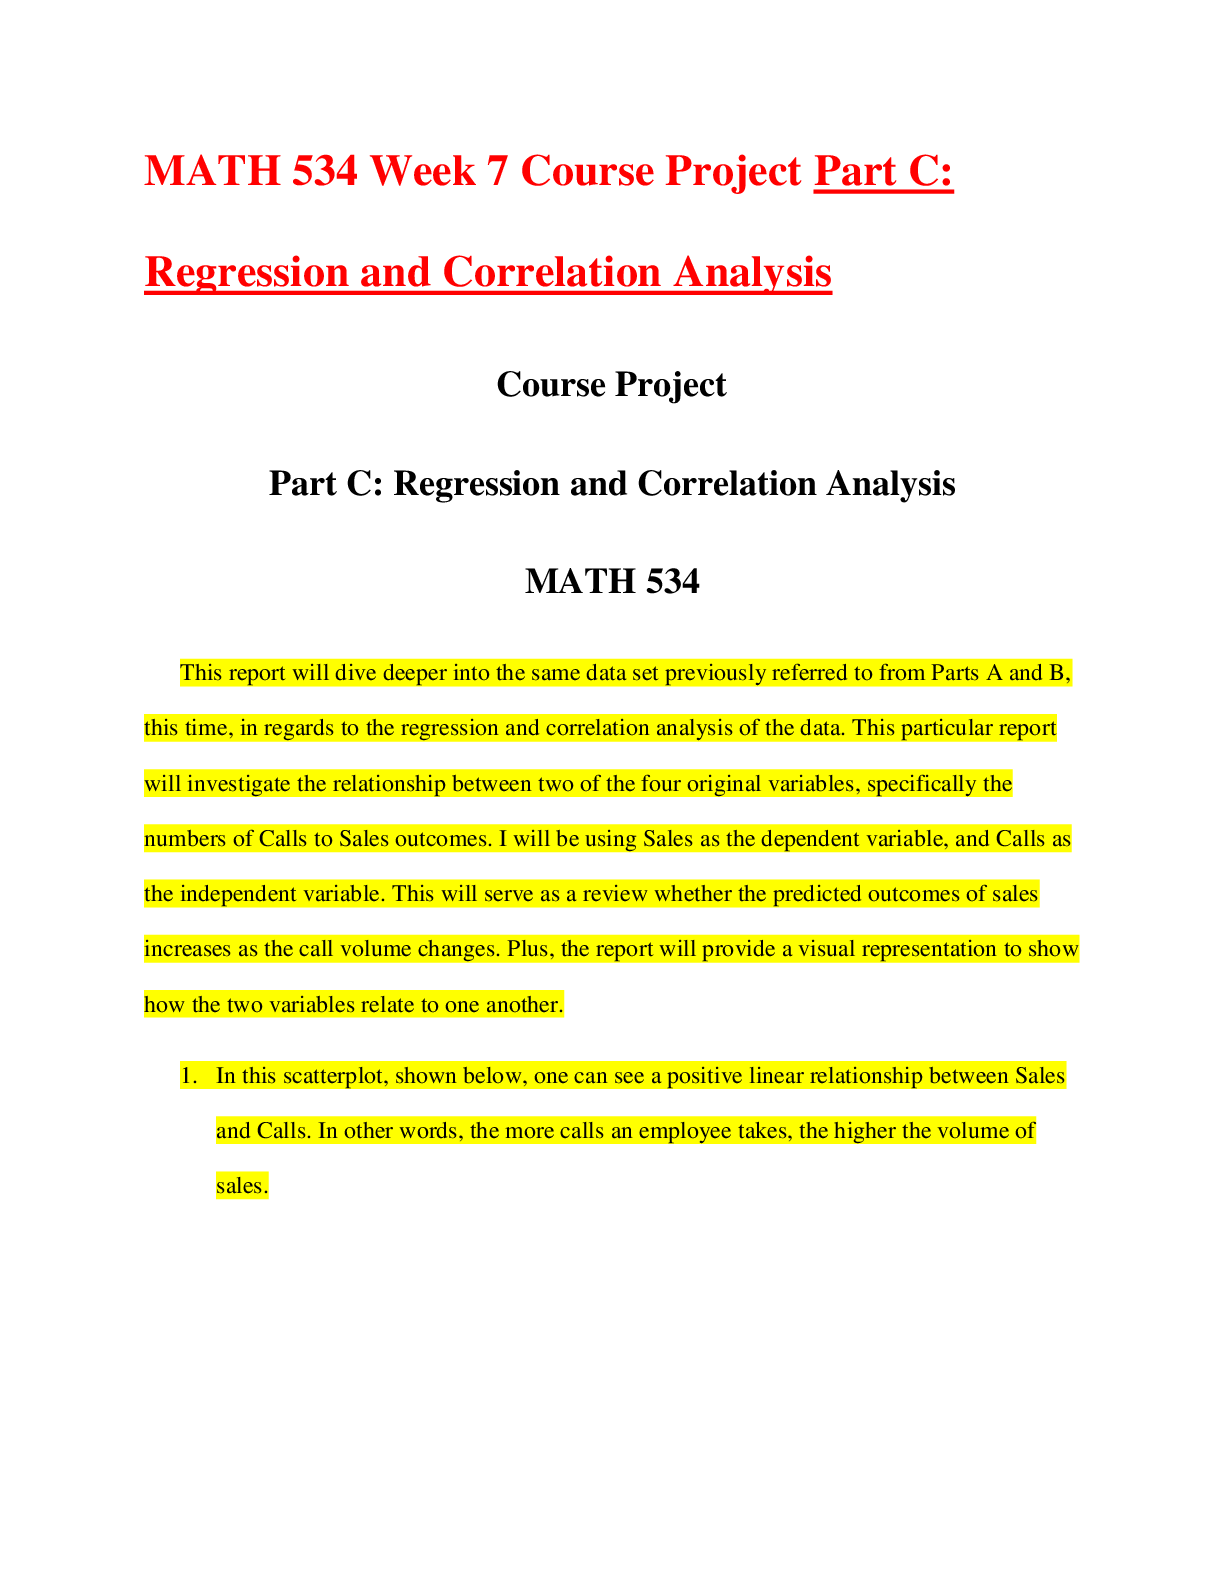
MATH 534 Week 7 Course Project Part C: Regression and Correlation Analysis.
Document Content and Description Below
Last updated: 3 years ago
Preview 1 out of 10 pages
Instant download


Buy this Document to get the Full Access Instantly
Provided by Students Who Aced it
We Verify Document Content to Gurantee Accuracy
Reviews( 0 )
Document information
Connected school, study & course
About the document
Uploaded On
May 07, 2022
Number of pages
10
Written in
All

Additional information
This document has been written for:
Uploaded
May 07, 2022
Downloads
0
Views
119
Document Keyword Tags
Recommended For You
Get more on QUESTIONS & ANSWERS »
MATH 534 Week 7 Course Project Part C: Regression and Correlat...

MATH 534 Week 7 Course Project Part C: Regression and Correlat...
MATH 534 Week 7 Course Project Part C: Regression and Correlat...
MATH 534 Week 7 Course Project Part C: Regression and Correlat...

MATH 534 Week 7 Course Project Part C: Regression and Correlat...
MATH 534 Week 7 Course Project Part C: Regression and Correlat...
MATH 534 Week 7 Course Project Part C: Regression and Correlat...

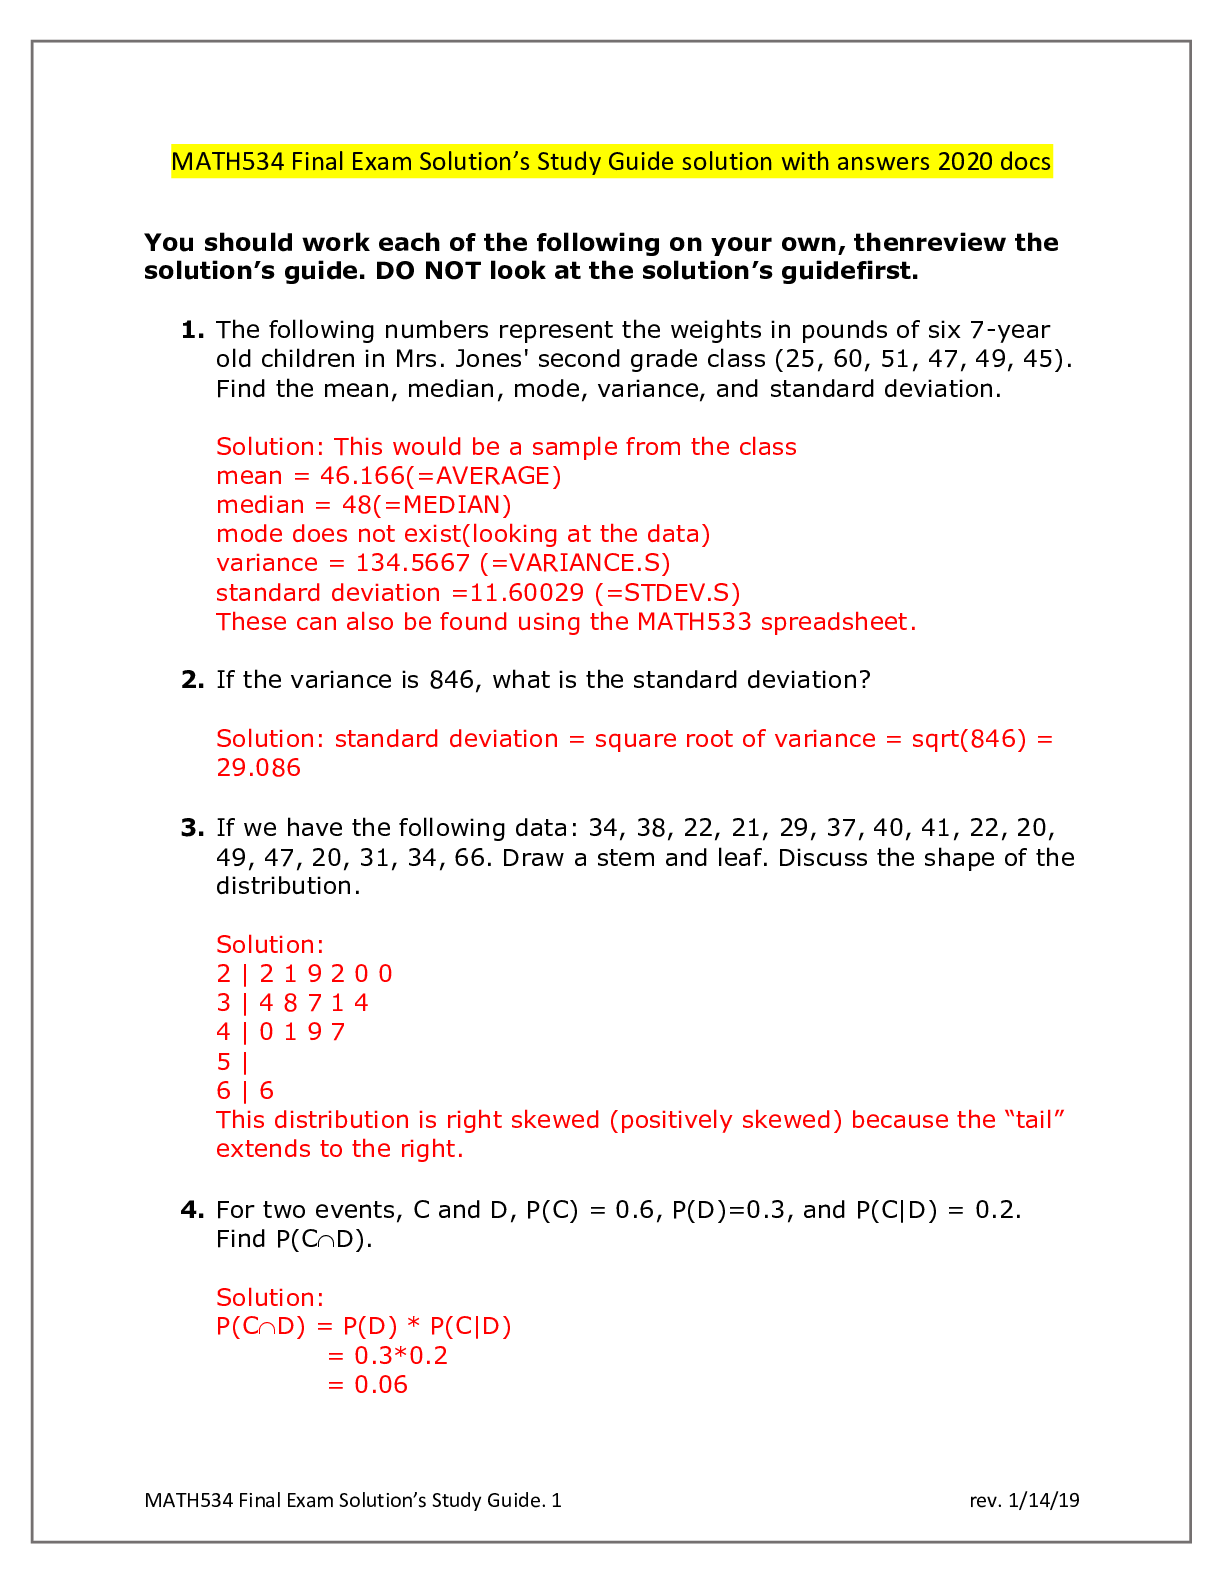
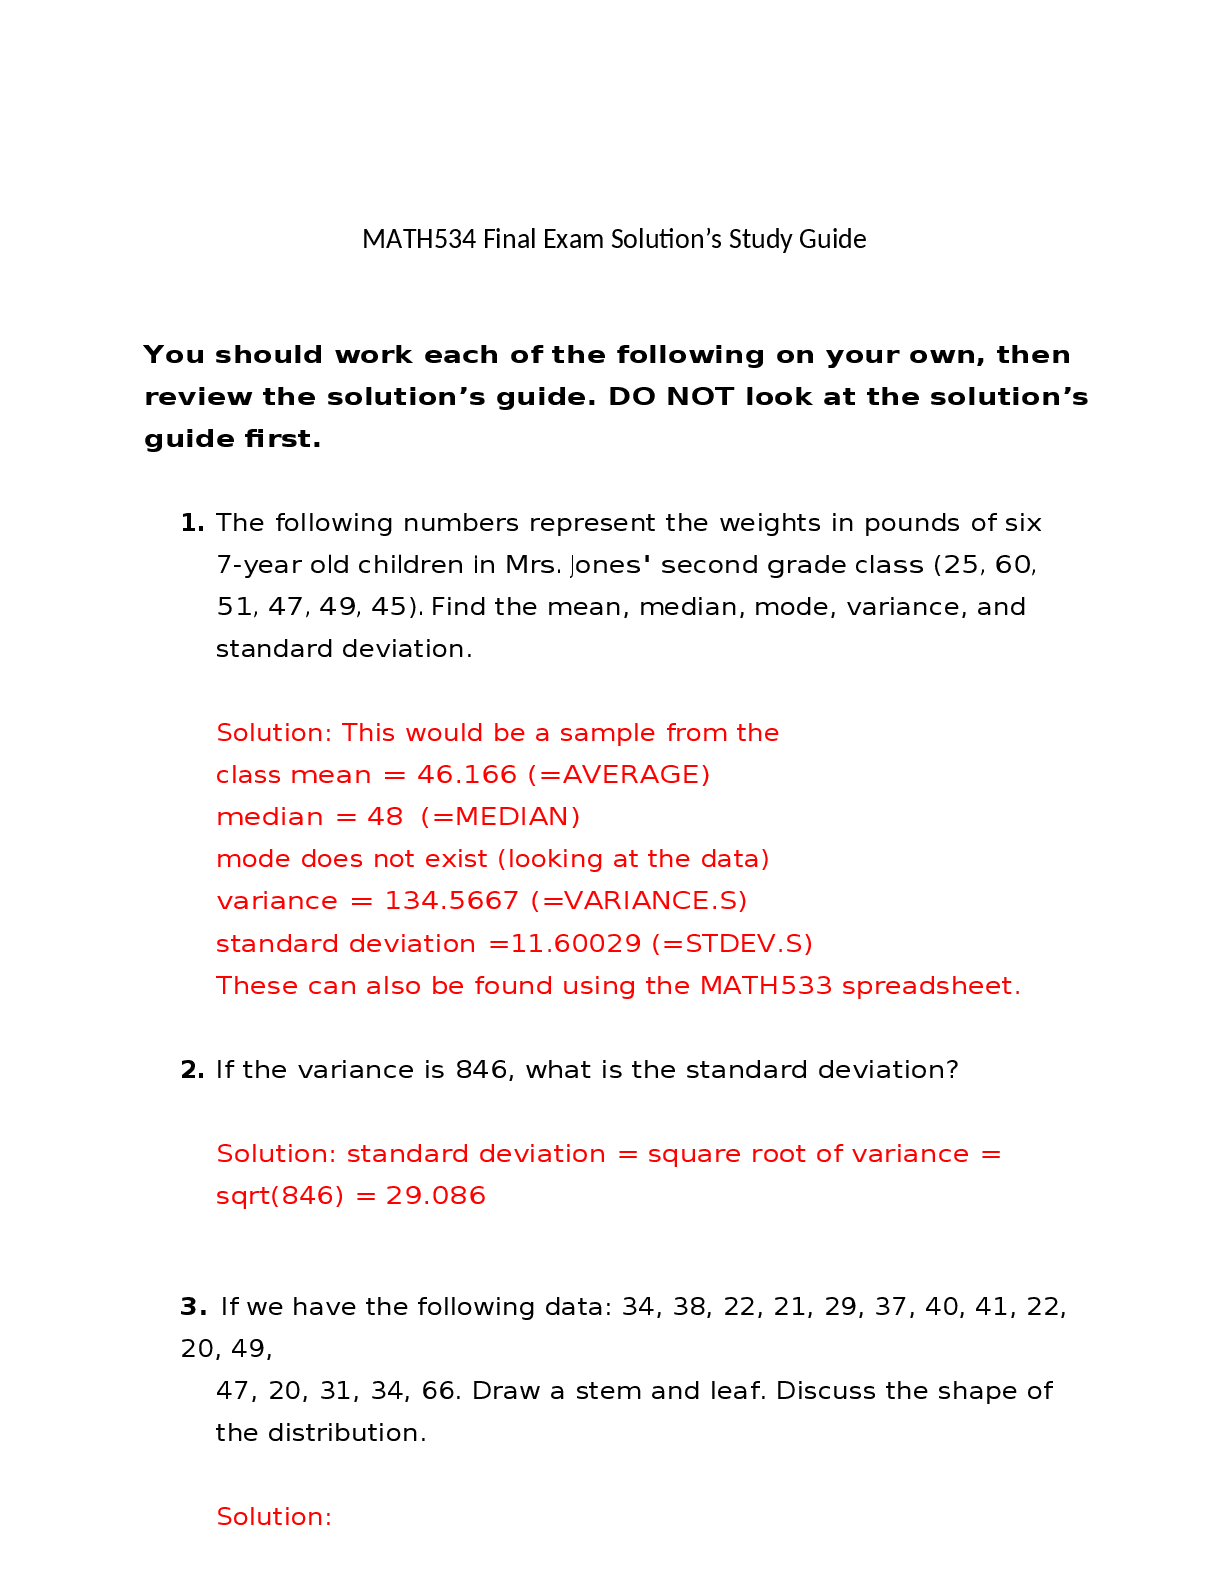
MATH534 Final Exam Solution’s Study Guide solution with answer...
MATH534 Final Exam Solution’s Study Guide solution with answer...
MATH534 Final Exam Solution’s Study Guide solution with answer...

MATH 534 Week 8 Final Exam 2024 | Already Graded A | MATH 534...
MATH 534 Week 8 Final Exam Solution’s Guide (Summer 2019)


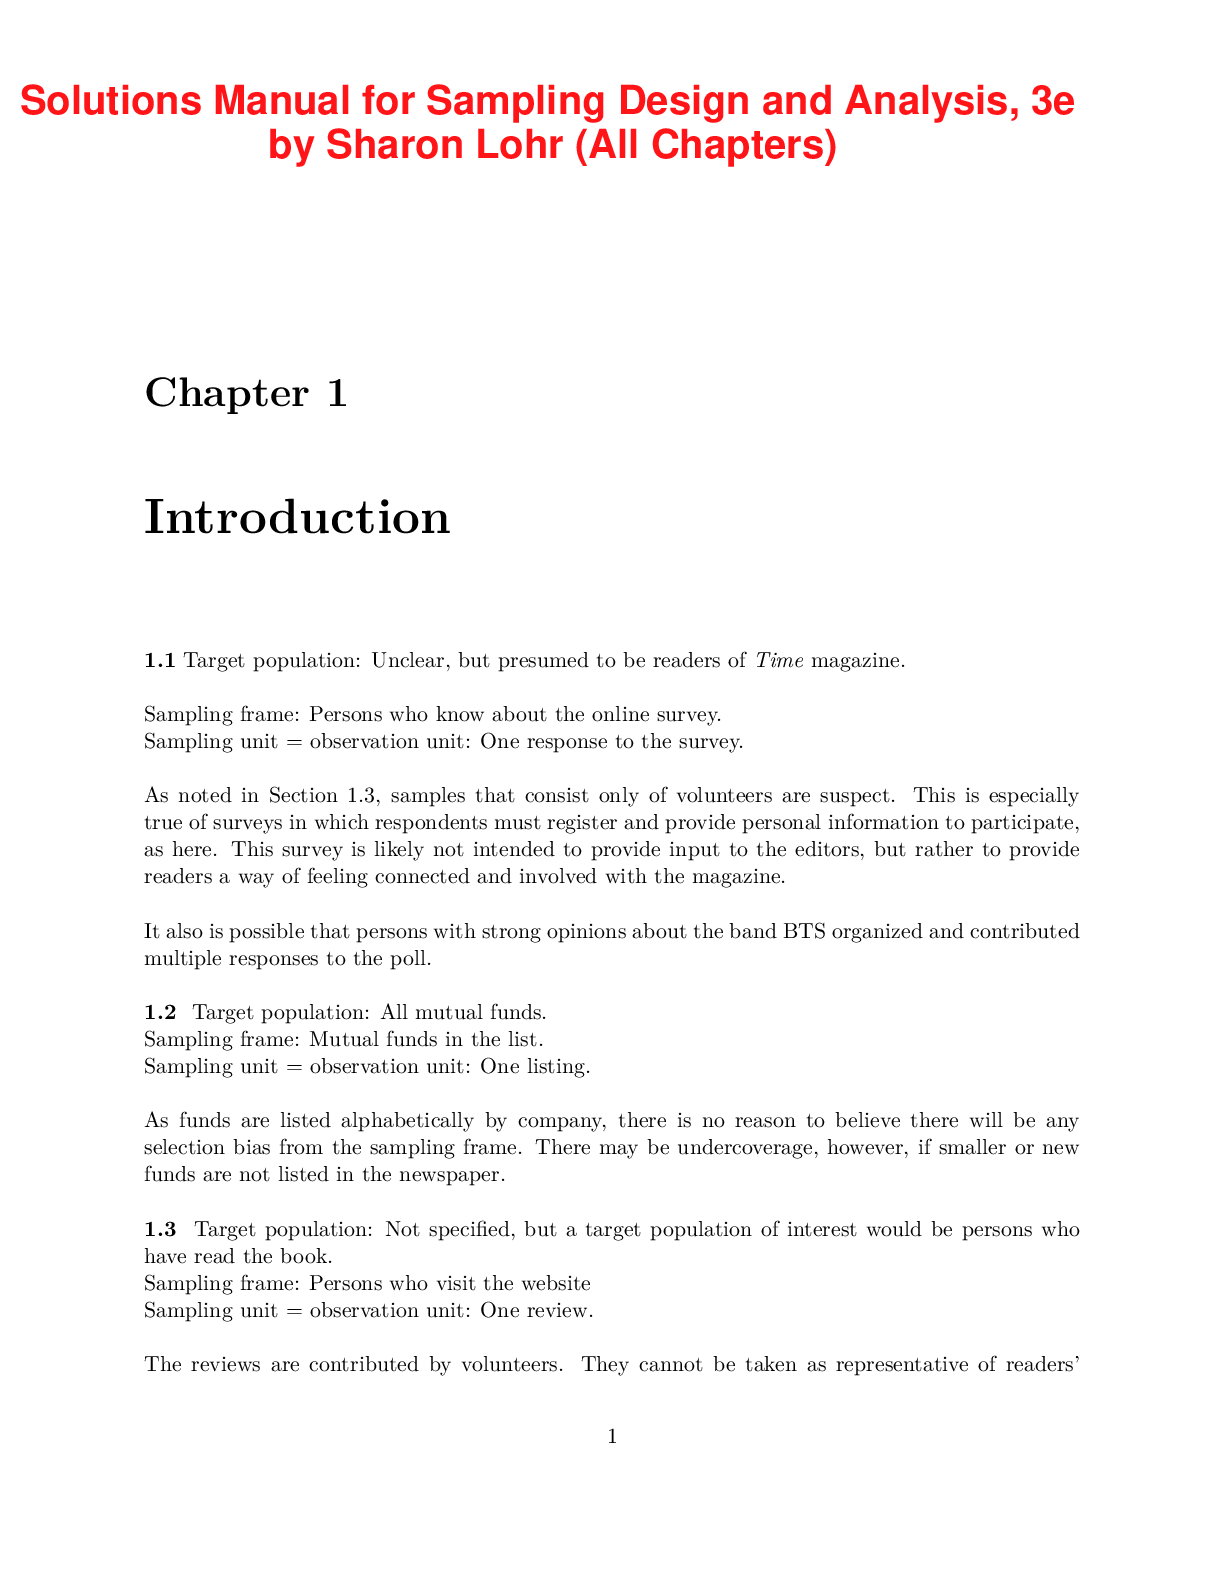
Sampling Design and Analysis, 3e by Sharon Lohr (Solutions Man...
.png)


![Preview of [SOLVED] EDCO 740 / EDCO740 Quiz 1 (LATES 2021/2022 Graded A)](https://scholarfriends.com/storage/EDCO_740_Quiz_1.png)