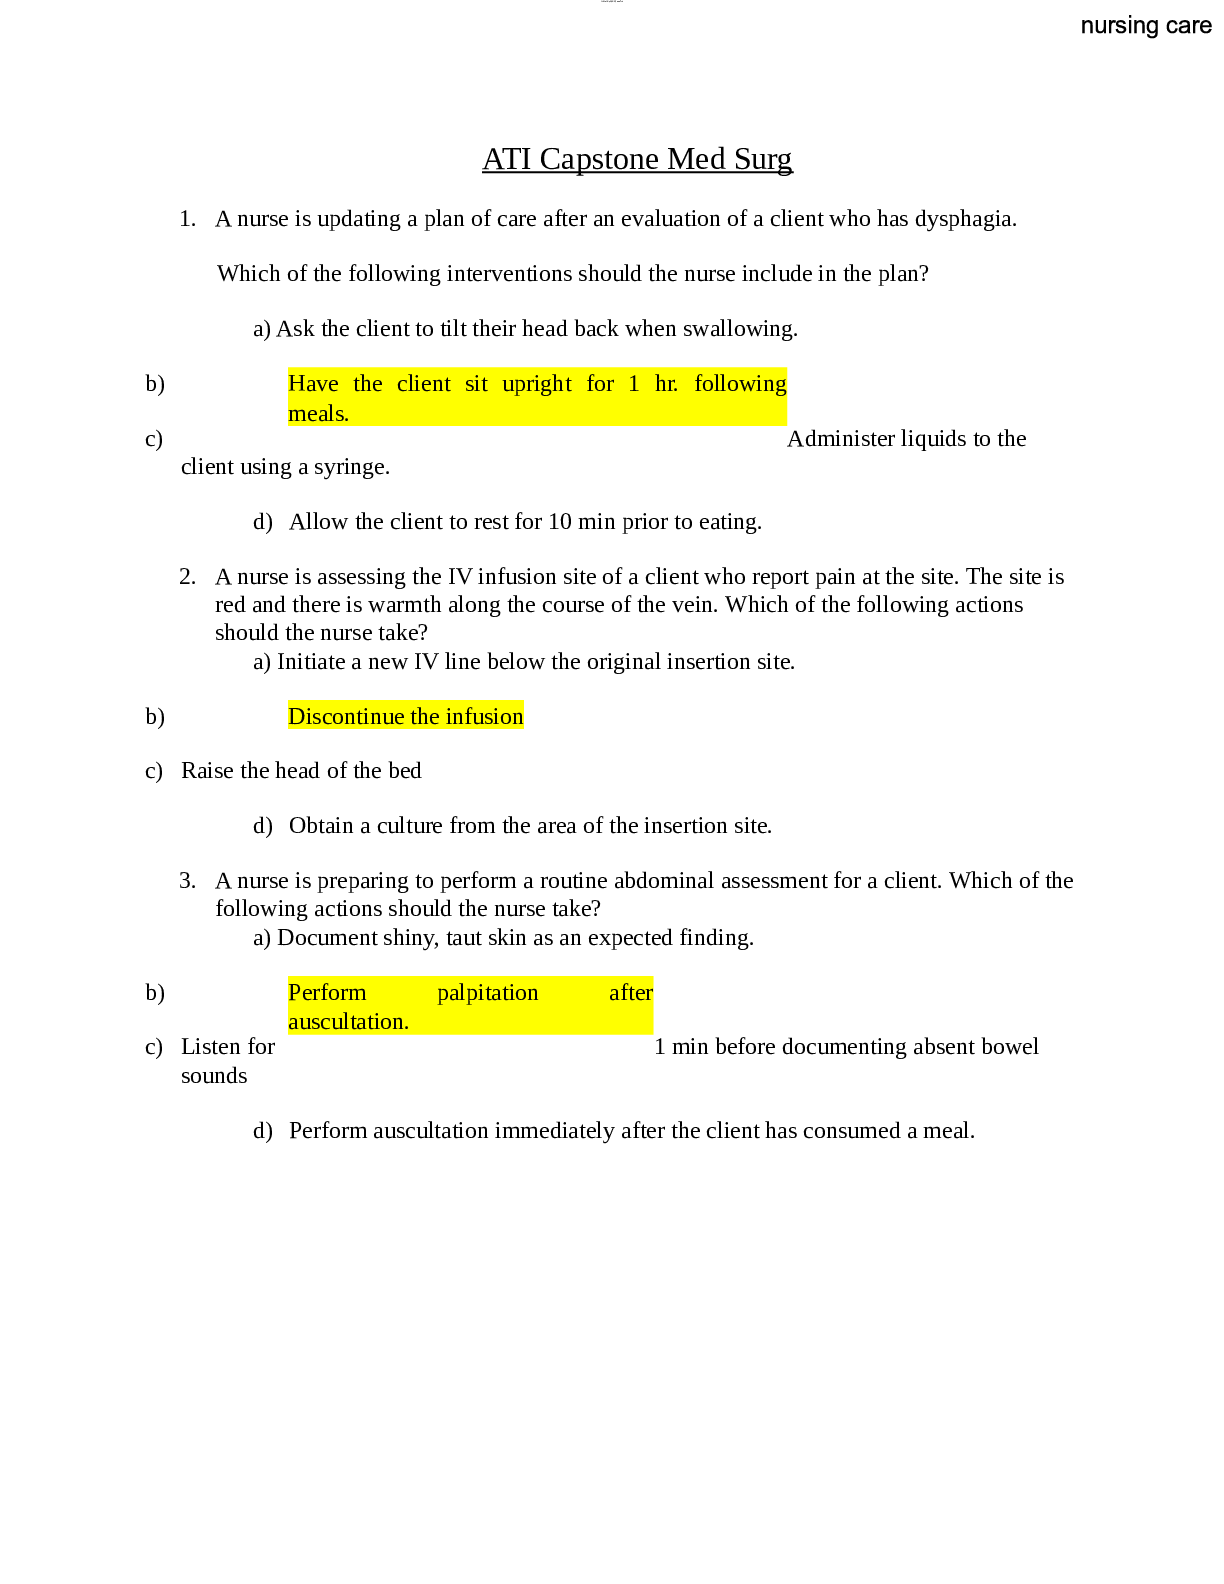
ATI Capstone Med Surg Asessment Test Questions With Correct Answers
Mathematics > Solutions Guide > MATH 534 FINAL EXAM REVISION GUIDE (All)
The following numbers represent the weights in pounds of six 7-year old children in Mrs. Jones' second grade class (25, 60, 51, 47, 49, 45). Find the mean, median, mode, variance, and standard deviati ... on. 2. If the variance is 846, what is the standard deviation? If we have the following data: 34, 38, 22, 21, 29, 37, 40, 41, 22, 20, 49, 47, 20, 31, 34, 66. Draw a stem and leaf. Discuss the shape of the distribution. 4. For two events, C and D, P(C) = 0.6, P(D)=0.3, and P(C|D) = 0.2. Find P(C 2. If the variance is 846, what is the standard deviation? If we have the following data: 34, 38, 22, 21, 29, 37, 40, 41, 22, 20, 49, 47, 20, 31, 34, 66. Draw a stem and leaf. Discuss the shape of the distribution. 4. For two events, C and D, P(C) = 0.6, P(D)=0.3, and P(C|D) = 0.2. Find P(C?D). 5. If a binomial variable has n=34 and p=0.30, find the mean, variance, and standard deviation 6. A company claims that 61% of consumers know about their product. If the company asks 18 consumers, what is the probability that (a) exactly 10 will say yes, that (b) between 10 and 12 will say yes. 7. If the population has a mean of 58 and a standard deviation of 23.4, what would be the mean and standard deviation of a sampling distribution with a sample size of 22? 8. A restaurant asks 40 customers about their service times. If the population mean service time is 28 minutes with a standard deviation of 5.1 minutes, what is the probability that the mean of the sample service times would be less than 26 minutes? 9. On a dry surface, the braking distance (in meters) of a certain car is a normal distribution with mu = μ = 45.1 m and sigma = σ = 0.5. a. Find the braking distance that represents the 91st percentile. b. Find the probability that the braking distance is less than or equal to 45 m. c. Find the probability that the braking distance is greater than 46.8 m. d. Find the probability that the braking distance is between 45 m and 46.8 m. 10. A sample of 58 days of gas prices has a mean of $2.75 and a standard deviation of $0.86. Construct the 95% confidence interval. [Show More]
Last updated: 3 years ago
Preview 1 out of 7 pages

Buy this document to get the full access instantly
Instant Download Access after purchase
Buy NowInstant download
We Accept:

Can't find what you want? Try our AI powered Search
Connected school, study & course
About the document
Uploaded On
Jun 04, 2021
Number of pages
7
Written in
All
This document has been written for:
Uploaded
Jun 04, 2021
Downloads
0
Views
145
Scholarfriends.com Online Platform by Browsegrades Inc. 651N South Broad St, Middletown DE. United States.
We're available through e-mail, Twitter, Facebook, and live chat.
FAQ
Questions? Leave a message!
Copyright © Scholarfriends · High quality services·