Statistics > EXAM > MATH 110 EXAM 8 PORTAGE LEARNING STATISTICS (All)
MATH 110 EXAM 8 PORTAGE LEARNING STATISTICS
Document Content and Description Below
Last updated: 3 years ago
Preview 1 out of 16 pages
Instant download

Buy this Document to get the Full Access Instantly
Provided by Students Who Aced it
We Verify Document Content to Gurantee Accuracy
Reviews( 0 )
Document information
Connected school, study & course
About the document
Uploaded On
Jun 07, 2022
Number of pages
16
Written in
All

Additional information
This document has been written for:
Uploaded
Jun 07, 2022
Downloads
0
Views
131
Document Keyword Tags
Recommended For You
Get more on EXAM »
MATH 110 Exam 8 Statistics - Questions With Verified Answers...
.png)
MATH 110 Exam 8 Statistics - Questions With Correct Answers -...
MATH 110 Exam 8 Statistics (Questions and Answers) - Portage...

MATH 110 exam Portage Learning Statistics combined exams(Grade...
.png)
Portage Learning MATH 110 Solutions to Problem Set 4 (All Answ...

MATH 110 Final Exam Questions and Answers- Portage Learning.

Portage Learning MATH 110 Module 4 Problem Sets 1-4 Answers (A...
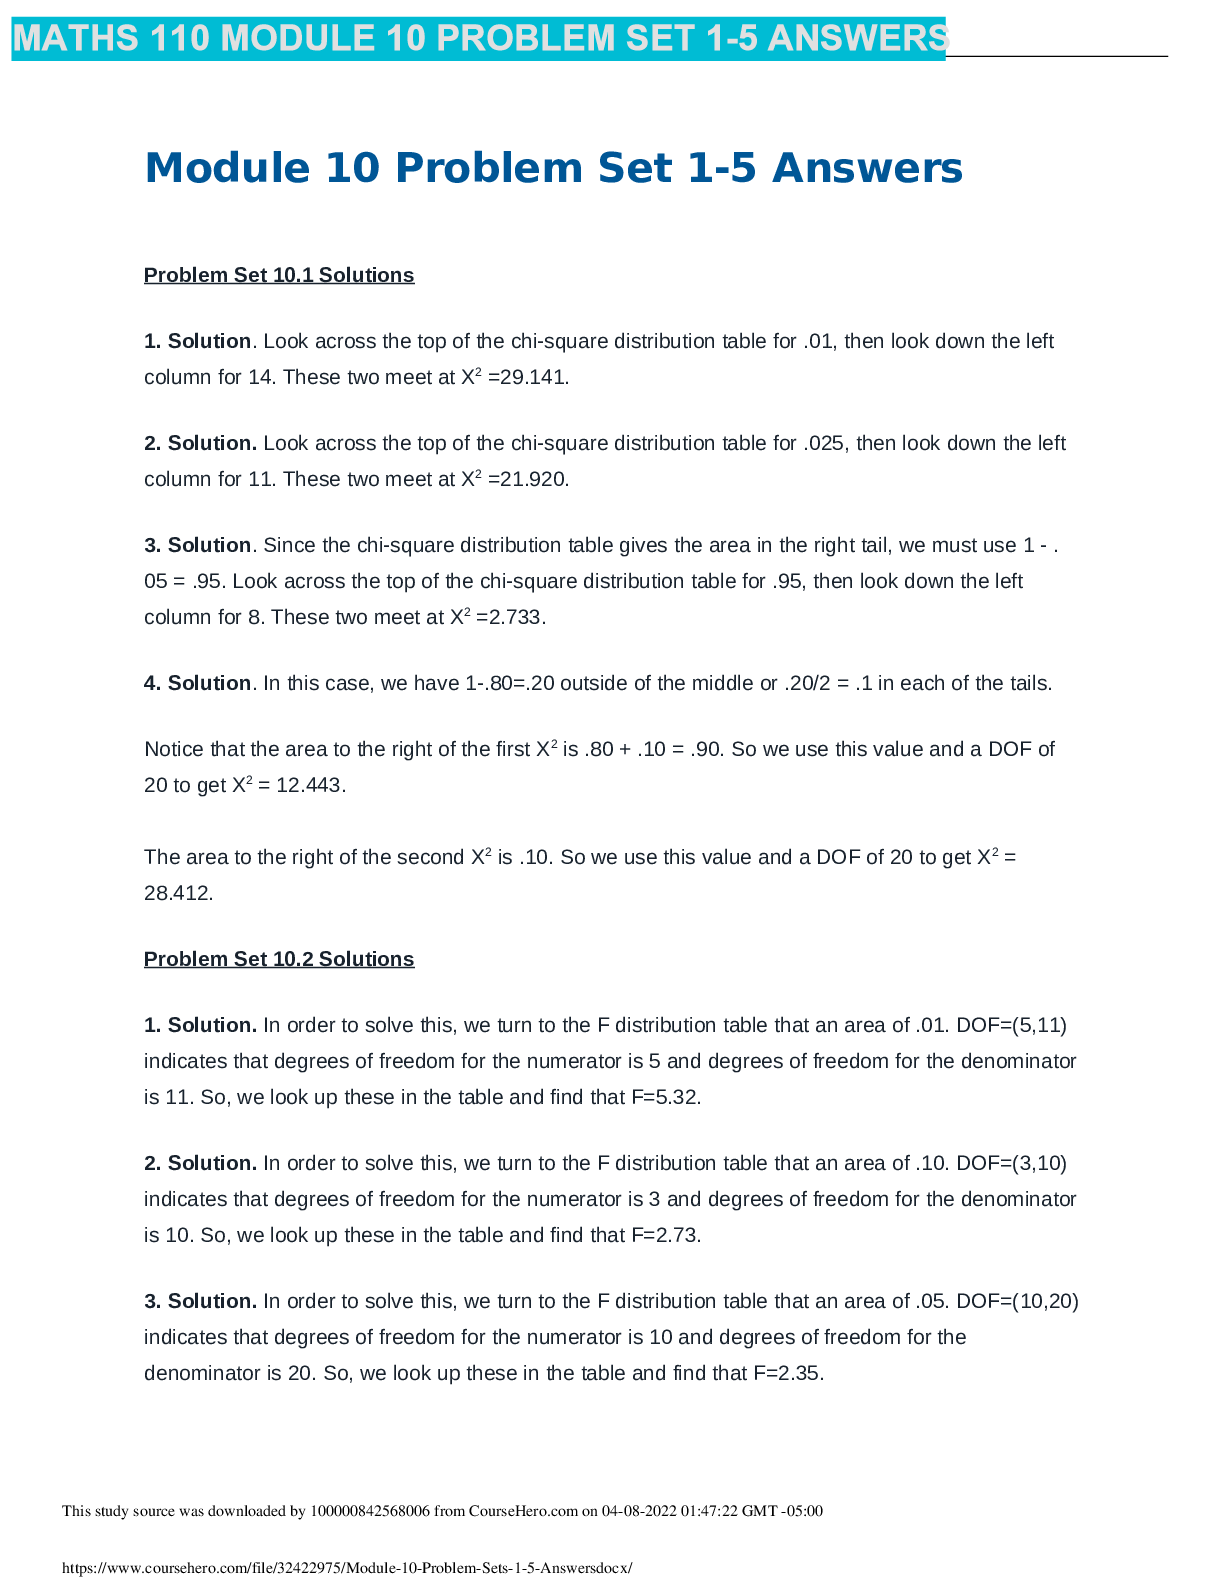
MATH 110 Module 10 Problem Set 1-5 Answers - Portage Learning...
Sampling Design and Analysis, 3e by Sharon Lohr (Solutions Man...
.png)
Business Statistics, 4e Norean Sharpe, Richard Veaux, Paul Vel...


.png)