Final Exam- Requires Respondus LockDown Browser
Due No due date
Points 100
Questions 10
Time Limit 120 Minutes
Requires Respondus LockDown Browser
This quiz is currently locked.
Attempt History
Attempt
...
Final Exam- Requires Respondus LockDown Browser
Due No due date
Points 100
Questions 10
Time Limit 120 Minutes
Requires Respondus LockDown Browser
This quiz is currently locked.
Attempt History
Attempt Time Score
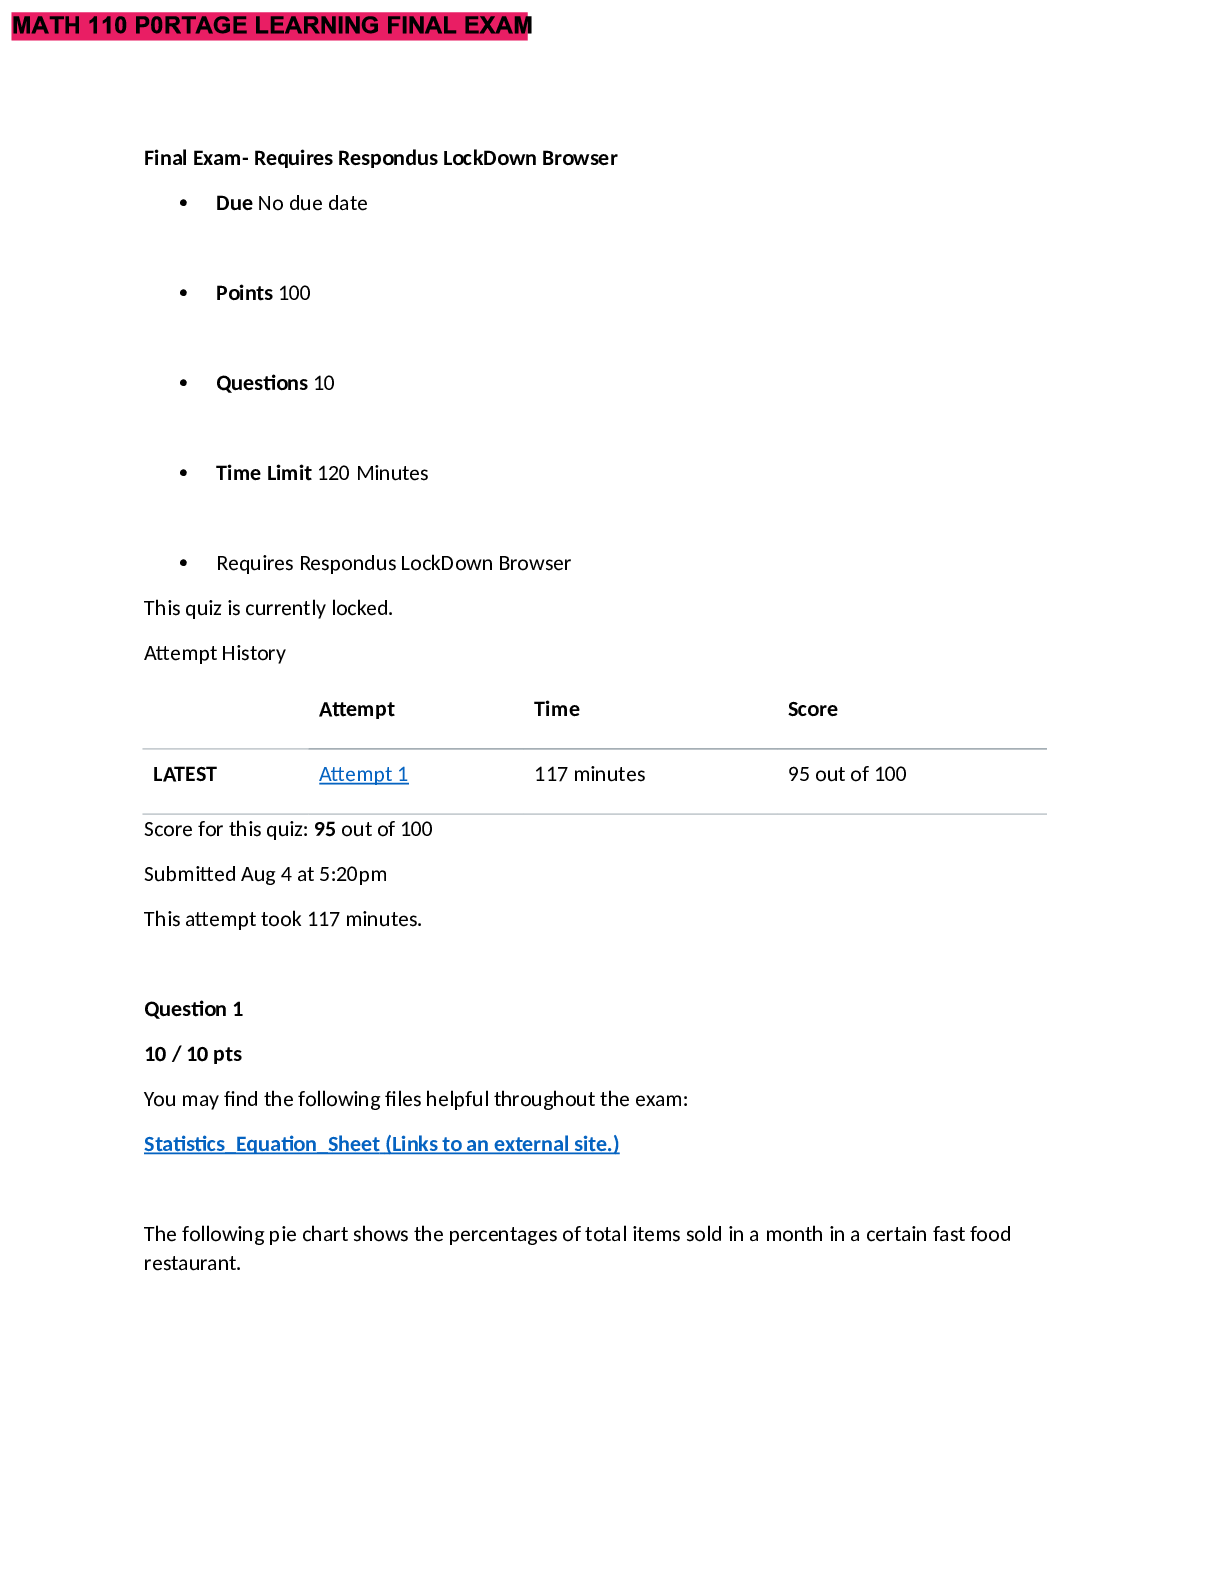
LATEST Attempt 1 117 minutes 95 out of 100
Score for this quiz: 95 out of 100
Submitted Aug 4 at 5:20pm
This attempt took 117 minutes.
Question 1
10 / 10 pts
You may find the following files helpful throughout the exam:
Statistics_Equation_Sheet (Links to an external site.)
The following pie chart shows the percentages of total items sold in a month in a certain fast food
restaurant.
MATH 110 P0RTAGE LEARNING FINAL EXAM
A total of 4700 fast food items were sold during the month.
a.) How many were fish?
b.) How many were french fries?
Your Answer:
For this problem:
a. For Fish there were: 4700 ( .28)=1316, hovewer for Franch Fries they were: 4700 (.40)=1880
a.) Fish : 4700(.28) = 1316
b.) French Fries: 4700(.40) = 1880
Question 2
10 / 10 pts
You may find the following files helpful throughout the exam:
Statistics_Equation_Sheet (Links to an external site.)
Consider the following data:
19 46 74 40 44 65 33 76 50 58 31 37 70 41 61 51 56 73 48 55
Find the 40th percentile of this data.
Your Answer:
For this problem:
n= 20, since there are 20 numbers.
The numbers in order are: 19 31 33 37 40 41 44 46 48 50 51 55 56 58 61 65 70 74 76
Since we are looking for 40th percentile I must calculate:
Finally, 40 th percentile is the 8th abservation, where the 8th abservation is number 46.
There are a total of twenty numbers, so n= 20. In order to find the percentiles, we must put the
numbers in ascending order:
19 31 33 37 40 41 44 46 48 50 51 55 56 58 61 65 70 73 74 76
For the 40th percentile:
Therefore, the 40th percentile index for this data set is the 8th observation. In the list above, the 8th
observation is 46.
Question 3
10 / 10 pts
You may find the following files helpful throughout the exam:
Statistics_Equation_Sheet (Links to an external site.)
In a tri-state conference, 40% attendees are from California, 10% from Oregon, and 50% from
Washington. As it turns out 8 % of the attendees from California, 11% of the attendees from Oregon, and
13% of the attendees from Washington came to the conference by train. If an attendee is selected at
random and found to have arrived by train, what is the probability that the person is from California?
Your Answer:
For this problem:
P(TrainICA)=.08
P(TrainIOR)=.11
P(Train)IWA)=.13
Wheras: P(CA)=.40; P(OR)=.10 and P(WA)=.50. The question is What is the probability that the person is
from CA( California)?
P(Train│C)=.08.. P(Train│O)=.11..
P(Train│W)=.13..
P(C)=.40,P(O)=.10,P(W)=.50.
We want to find P(C│Train), so use:
Question 4
5 / 10 pts
You may find the following files helpful throughout the exam:
Statistics_Equation_Sheet (Links to an external site.)
Standard Normal Table (Links to an external site.)
Find each of the following probabilities:
a. Find P(Z ≤ .17).
b. Find P(Z ≥ -.34) .
c. Find P(-1.14 ≤ Z ≤ 0.55).
Your Answer:
For this problem:
While using a normal table for all of the problem mentined:
a. The answer is: 0.5675
b. The answer is:
c. The answer is:
a.
P(Z ≤ .17)=.56749.
b.
P(Z ≥ -.34)=1- .36693= .63307.
c.
P(-1.14 ≤ Z ≤ 0.55)= .70884- .12714=.5817 .
As noted in earlier exams, you should use the values as they are given in the charts and tables provided.
Question 5
10 / 10 pts
You may find the following files helpful throughout the exam:
Statistics_Equation_Sheet (Links to an external site.)
Standard Normal Table (Links to an external site.)
Suppose that you are attempting to estimate the annual income of 1200 families. In order to use the
infinite standard deviation formula, what sample size, n, should you use?
Your Answer:
For this problem:
I must have :
Therefore the smaple size, less/eaqual than 60
In order to use infinite standard deviation formula, we should have:
n≤0.05(1200)
n≤60
So, the sample size should be less than 60.
Question 6
10 / 10 pts
You may find the following files helpful throughout the exam:
Statistics_Equation_Sheet (Links to an external site.)
Standard Normal Table (Links to an external site.)
T Table (Links to an external site.)
A shipment of 350 new blood pressure monitors have arrived. Tests are done on 60 of the new monitors
and it is found that 8 of the 60 give incorrect blood pressure readings. Find the 80% confidence interval
for the proportion of all the monitors that give incorrect readings.
Answer the following questions:
1. Multiple choice: Which equation would you use to solve this problem?
A.
B.
C.
D.
E.
2. List the values you would insert into that equation.
3. State the final answer to the problem
Your Answer:
1. The answer is: E
2. I must calculate samples that are defective:
, meaning P=.1333, while estimatin: p=.1333; n=60 (monitors tested);z=1.28, based on
80% confidence and N=350
3. As asked to state the final asnwer to the problem is: While calculating the problem using formula (E)
the answer is:
.1333 .0512, therefore the defective proportion is between (.0821 and .1845)
We have a finite population, so we will use Case 2:
E.
The proportion of the sample that are defective is 8/60 = .1333 so we set P=.1333. As we mentioned
previously, we estimate p by P. So, p=.1333. A total of 60 monitors were tested, so n=60. Based on a
confidence limit of 80 %, we find in table 6.1 that z=1.28. The total number of monitors is 350, so set
N=350. Now, we can substitute all of these values into our equation:
.1333± .0512
So the proportion of the total that are defective is between .0821 and .1845.
Question 7
10 / 10 pts
You may find the following files helpful through
[Show More]


.png)
.png)

.png)


.png)
.png)


.png)


.png)