Engineering > Lab Report > MSE 235 Fracture Toughness report 2020 – Purdue University | MSE235 Fracture Toughness report 2020 (All)
MSE 235 Fracture Toughness report 2020 – Purdue University | MSE235 Fracture Toughness report 2020
Document Content and Description Below
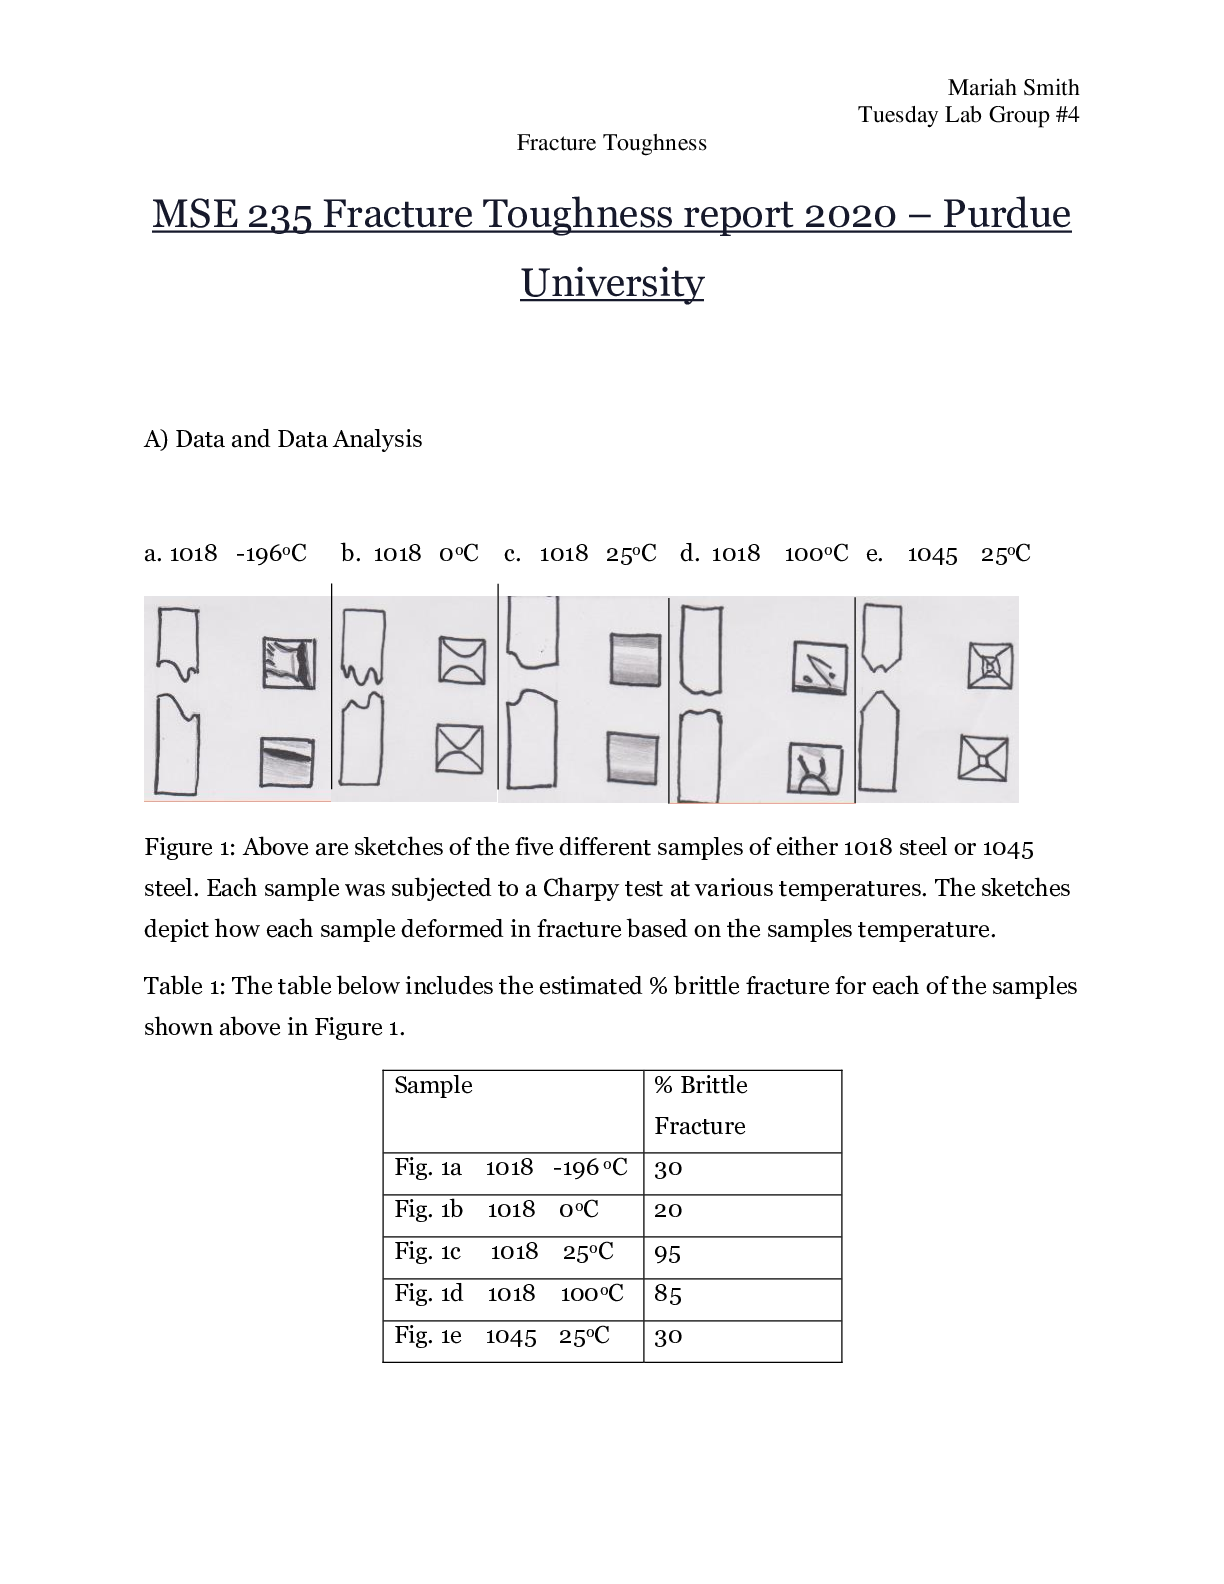
MSE 235 Fracture Toughness report 2020 – Purdue University A) Data and Data Analysis a. 1018 -196oC b. 1018 0oC c. 1018 25oC d. 1018 100oC e. 1045 25oC F... igure 1: Above are sketches of the five different samples of either 1018 steel or 1045 steel. Each sample was subjected to a Charpy test at various temperatures. The sketches depict how each sample deformed in fracture based on the samples temperature. Table 1: The table below includes the estimated % brittle fracture for each of the samples shown above in Figure 1. Sample % Brittle Fracture Fig. 1a 1018 -196 oC 30 Fig. 1b 1018 0oC 20 Fig. 1c 1018 25oC 95 Fig. 1d 1018 100oC 85 Fig. 1e 1045 25oC 30 Fig. 1a: I estimated that sample 1a has a 30% Brittle Fracture because during fracture a great amount of deformation occurred but it did not deform as much as sample 1b. Fig. 1b: I estimated that sample 1a has a 20% Brittle Fracture because during fracture a great amount of deformation occurred making it look like a ductile fracture. Fig. 1c: I estimated that sample 1a has a 95% Brittle Fracture because it was almost a clean fracture, but it still deformed. Fig. 1d: I estimated that sample 1a has an 85% Brittle Fracture because it appears to be a clean fracture but if you look closely you can see it still deformed and it deformed more than sample 1c did. Fig. 1e: I estimated that sample 1a has a 30% Brittle Fracture because during facture a great amount of deformation occurred causing a cup and cone fracture which is known for being a ductile fracture. - - - - - - - - - - - - - - - - - - - - - 4) Refer to Table B.5 in Callister and write down the values of fracture toughness and strength of soda lime glass and sintered silicon nitride (when a range of values are provided just write down the average). Sketch a Weibull plot similar to the plot in 4c of part-A comparing what you would expect to observe from these two materials. Briefly explain your plot. Figure 6: Above is a sketch of the predicted Weibull plot of soda-lime glass and sintered silicon nitride. Soda-lime glass has a steeper slope or greater Weibull modulus than sintered silicon nitride because silicon nitride is much stronger than soda-lime glass. [Show More]
Last updated: 2 years ago
Preview 1 out of 6 pages
Buy this document to get the full access instantly
Instant Download Access after purchase
Buy NowInstant download
We Accept:

Reviews( 0 )
$11.00
Can't find what you want? Try our AI powered Search
Document information
Connected school, study & course
About the document
Uploaded On
Nov 22, 2020
Number of pages
6
Written in

Additional information
This document has been written for:
Uploaded
Nov 22, 2020
Downloads
0
Views
126