Mathematics > EXAM > MATH 221 Week 1 Homework: Statistics for Decision-Making | VERSION 2 | Already GRADED A+ (All)
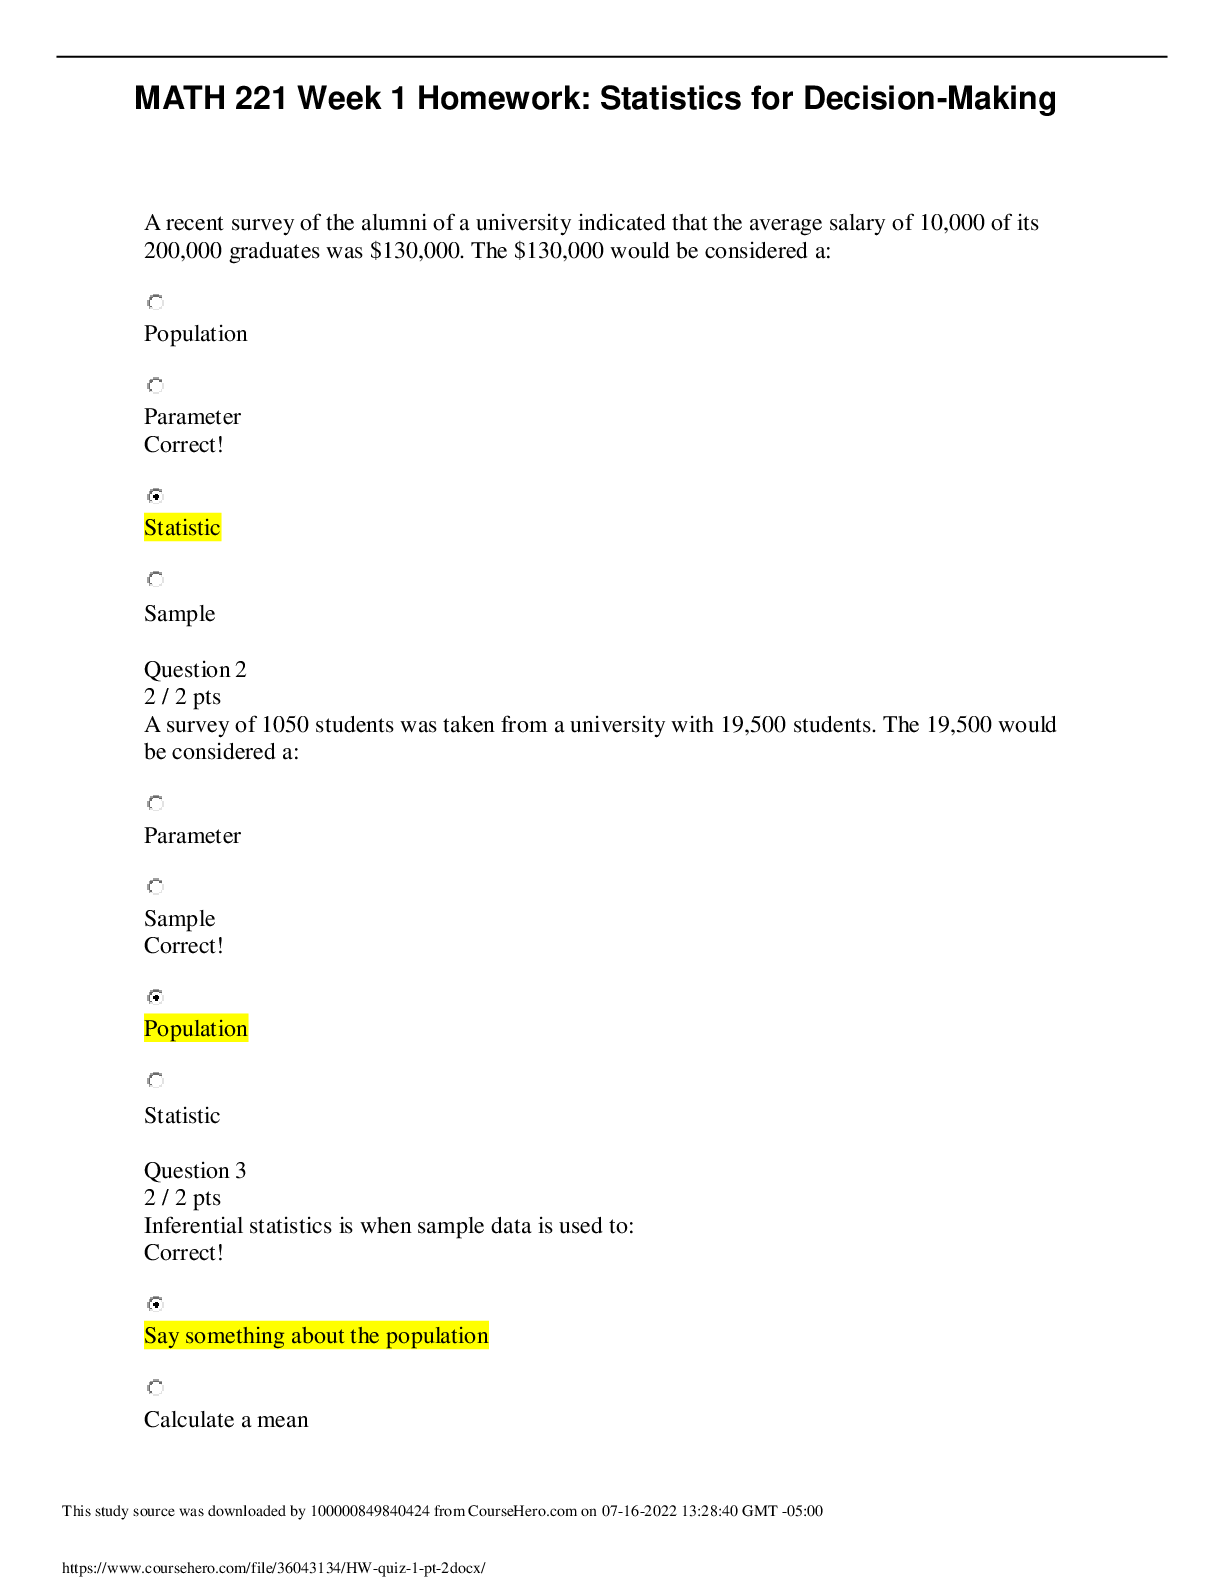
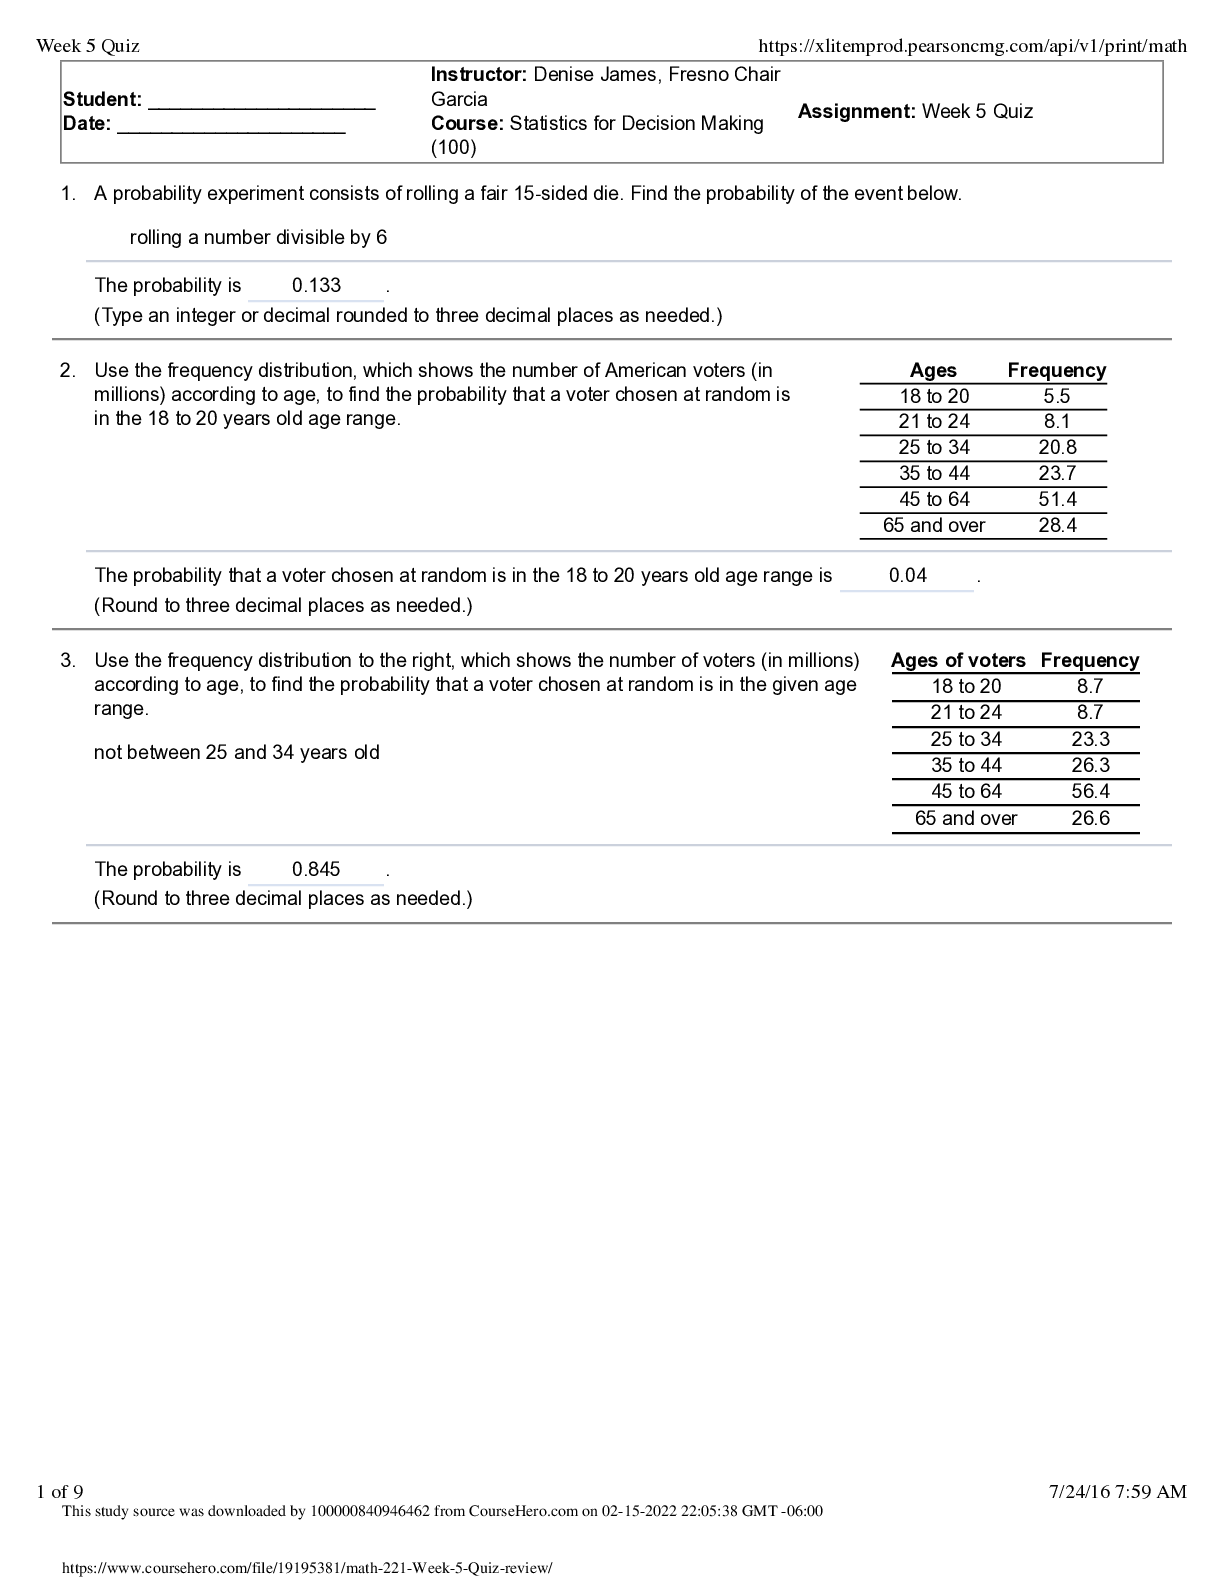
MATH 221 Week 1 Homework: Statistics for Decision-Making | VERSION 2 | Already GRADED A+
Document Content and Description Below
Last updated: 3 years ago
Preview 1 out of 9 pages
Instant download
Buy this Document to get the Full Access Instantly
Provided by Students Who Aced it
We Verify Document Content to Gurantee Accuracy
Also available in bundle (1)
Click Below to Access Bundle(s)

MATH 221 Statistics For Decision Making [Entire Course Week 1 – 8] BUNDLED | 100% CORRECT SOLUTIONS | LATEST UPDATE
MATH 221 Week 1 Homework (Collection) MATH-221 Week 1 Quiz (100% Correct Collection) MATH 221 Week 1 Discussion: Posts MATH-221 Week 1 Lesson MATH 221 Week 2 Homework (Collection) MATH-221 Week...
By BestSeller_ScholarFriends 3 years ago
$14.5
38
Reviews( 0 )
Document information
Connected school, study & course
About the document
Uploaded On
Jul 16, 2022
Number of pages
9
Written in
All
Seller

Reviews Received
Additional information
This document has been written for:
Uploaded
Jul 16, 2022
Downloads
0
Views
167
Document Keyword Tags
Recommended For You
Get more on EXAM »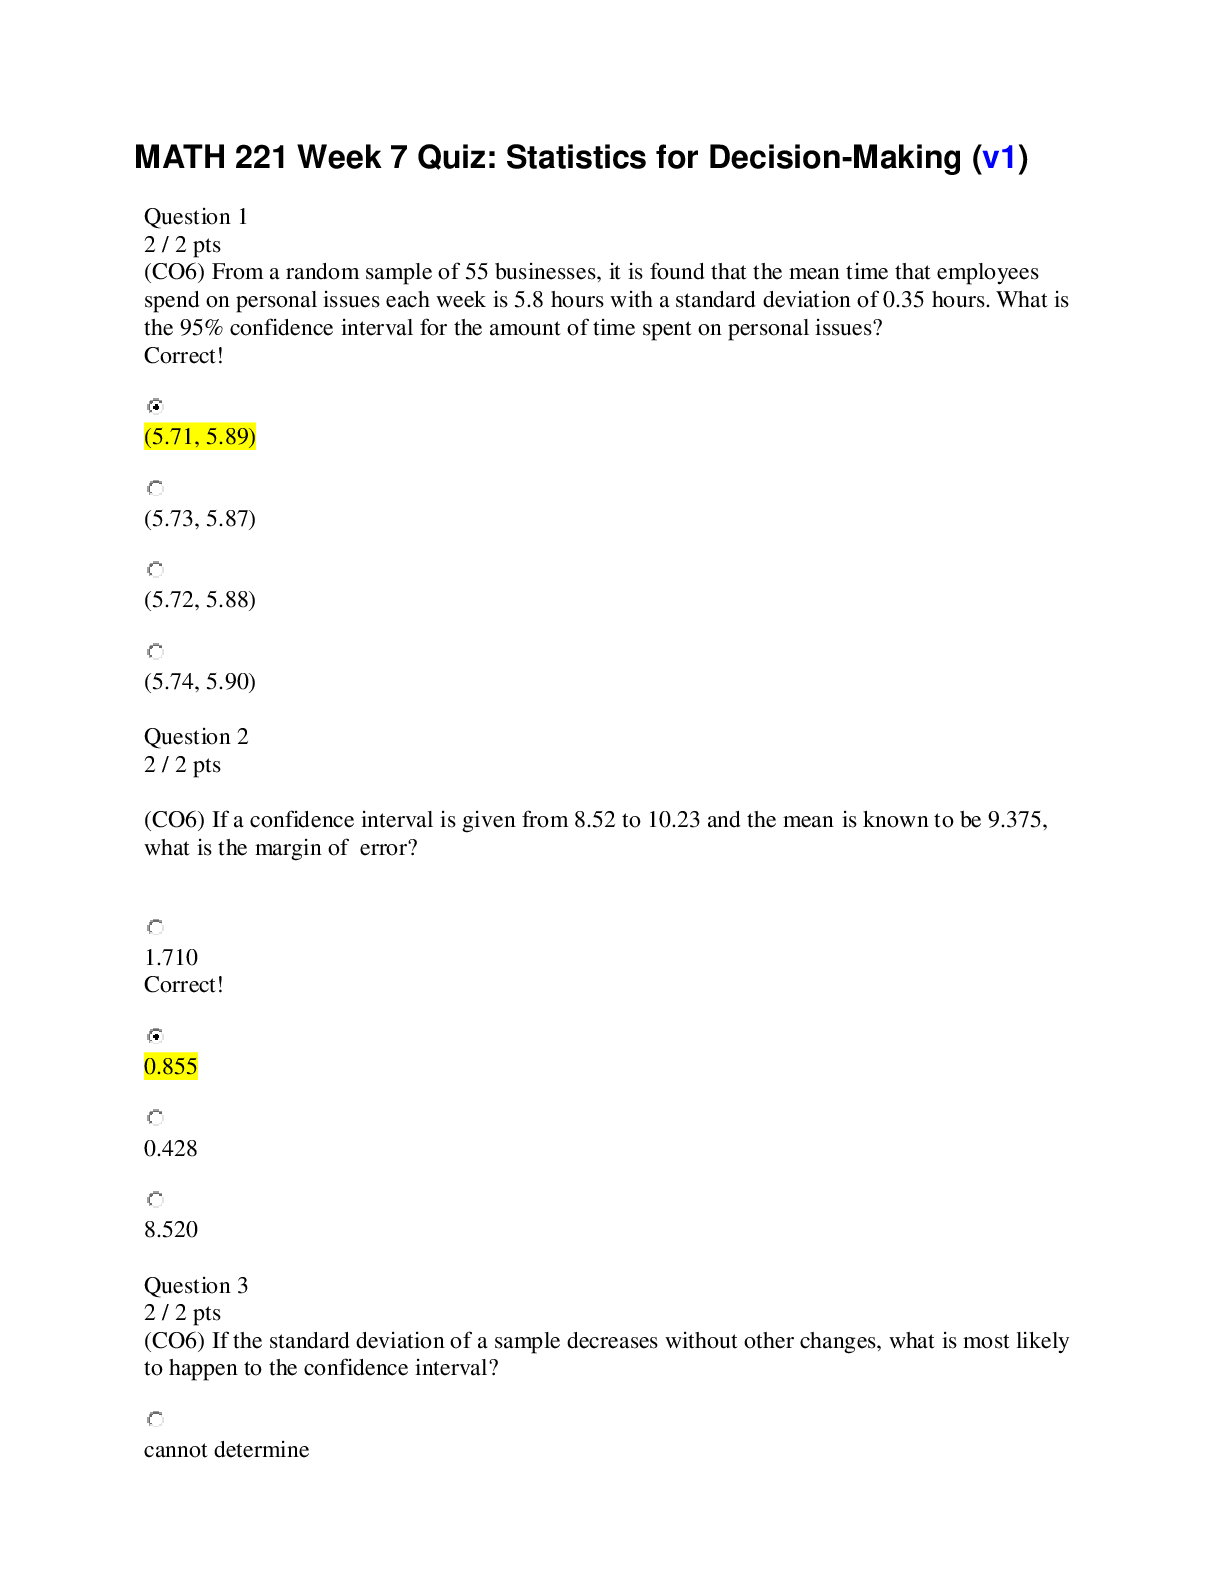
MATH 221 Week 7 Quiz: Statistics for Decision-Making (v1) |TOP...

MATH 221 Homework Week 6 Attempt Score 40/40 | DeVry Universi...
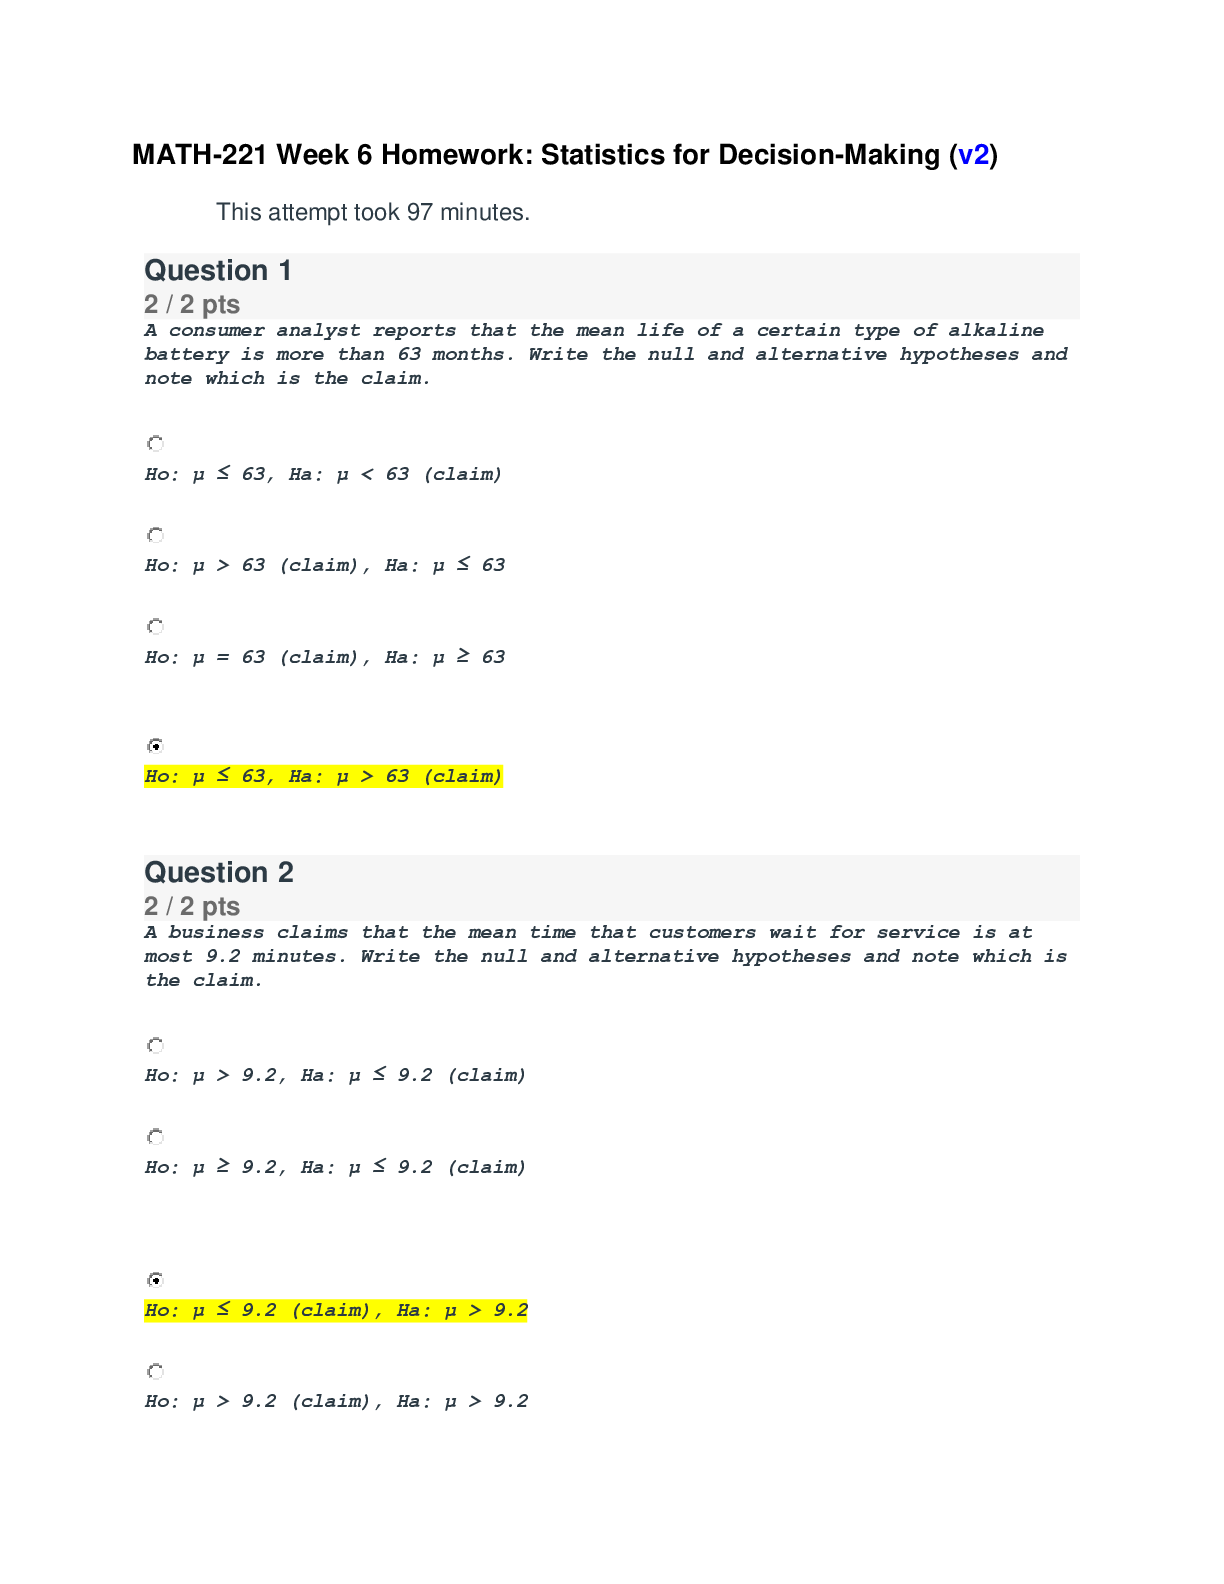
MATH-221 Week 6 Homework: Statistics for Decision-Making (v2)...
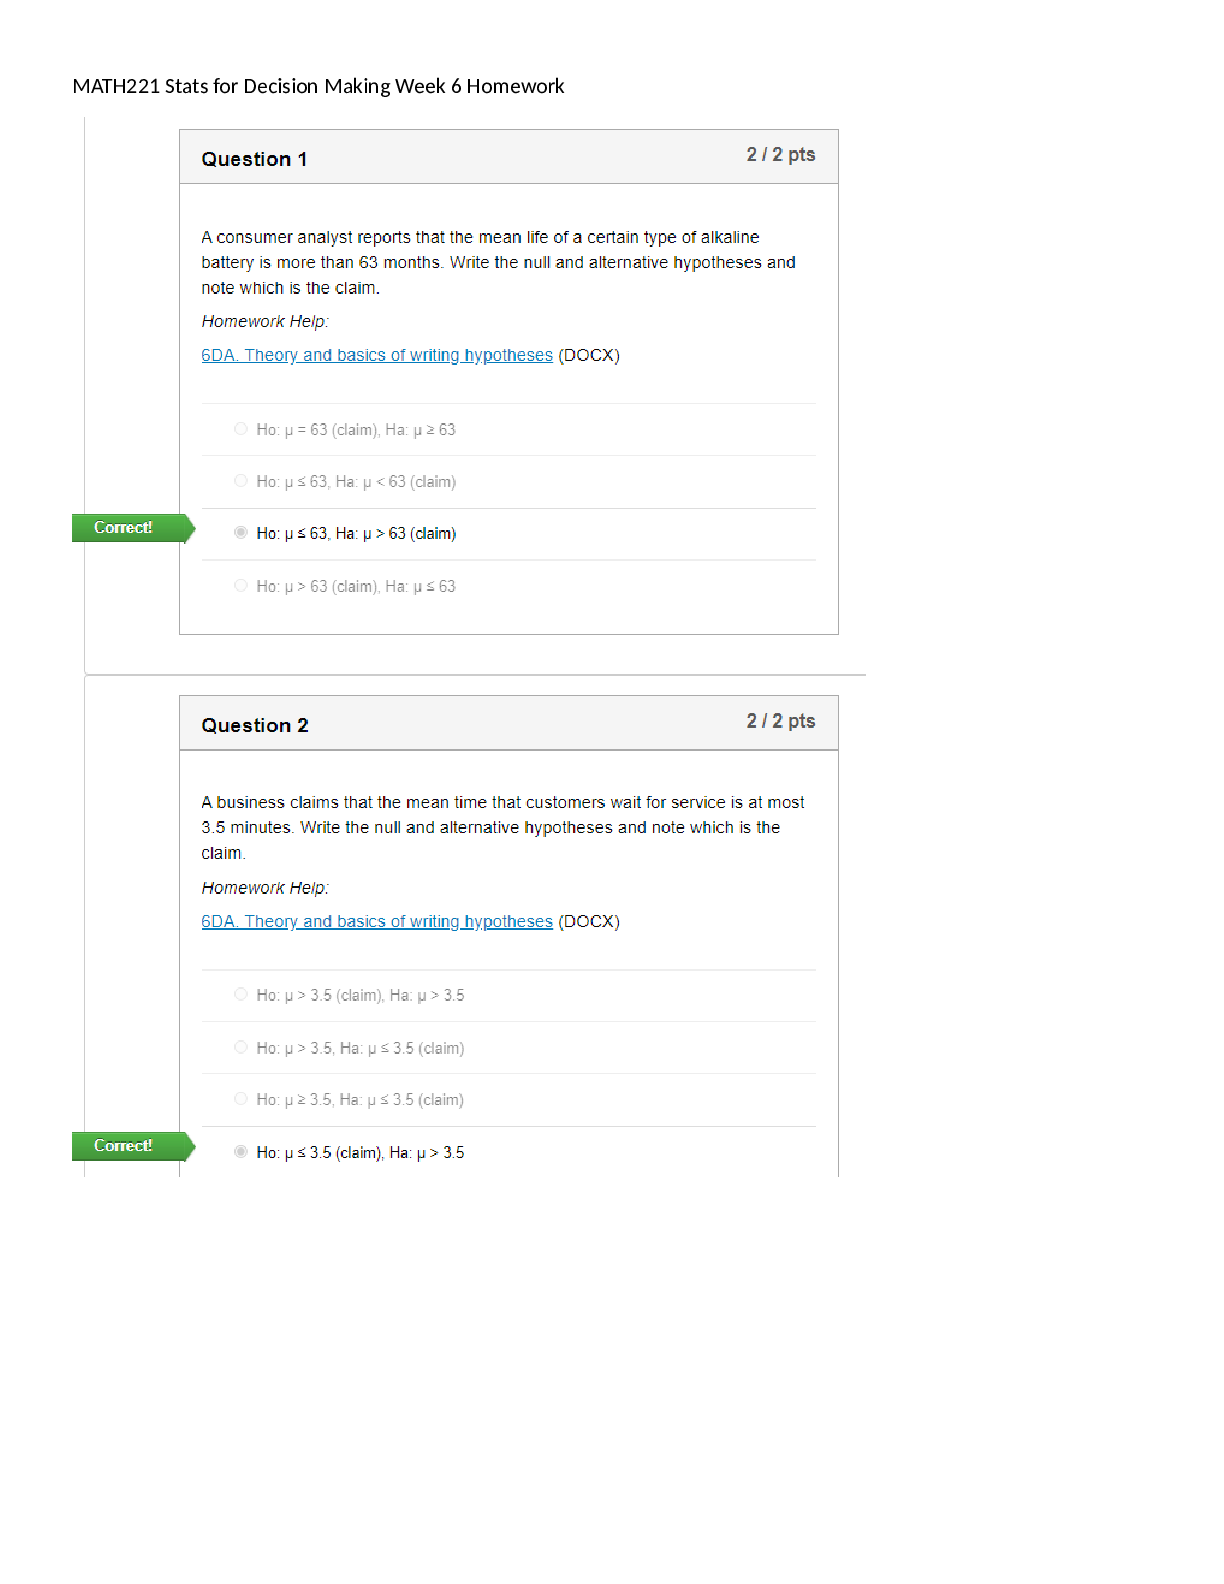
MATH 221 Week 6 Homework: Statistics for Decision-Making (LATE...
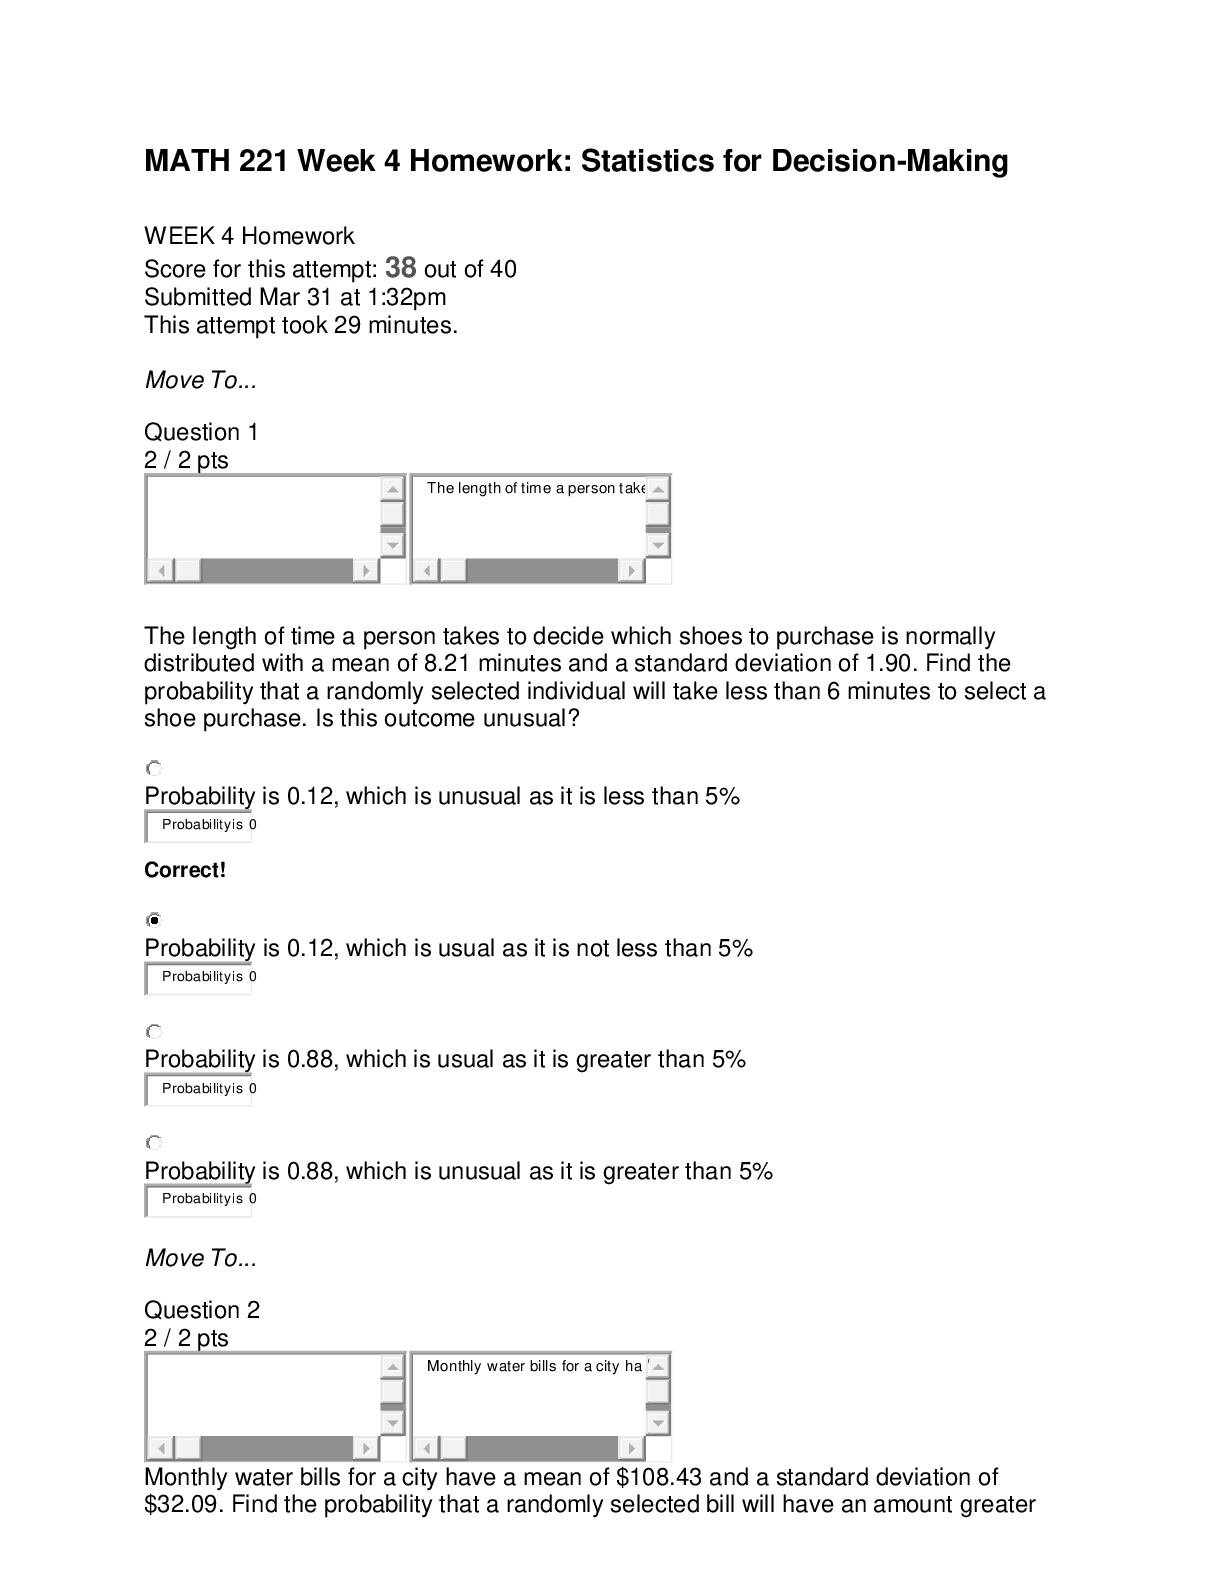
MATH 221 Week 4 Homework: Statistics for Decision-Making (TOP...

MATH-221 Week 5 Quiz (v4) | 100 out of 100 | Best SCORE Paper
MATH 221 Week 5 Quiz (v3) | Highly RATED Paper | 100% correct...

MATH-221 Week 5 Quiz (v2) | TOP SCORE | Already GRADED A+

MATH 221 Statistics for Decision Making Week 3 Quiz, Devry Uni...
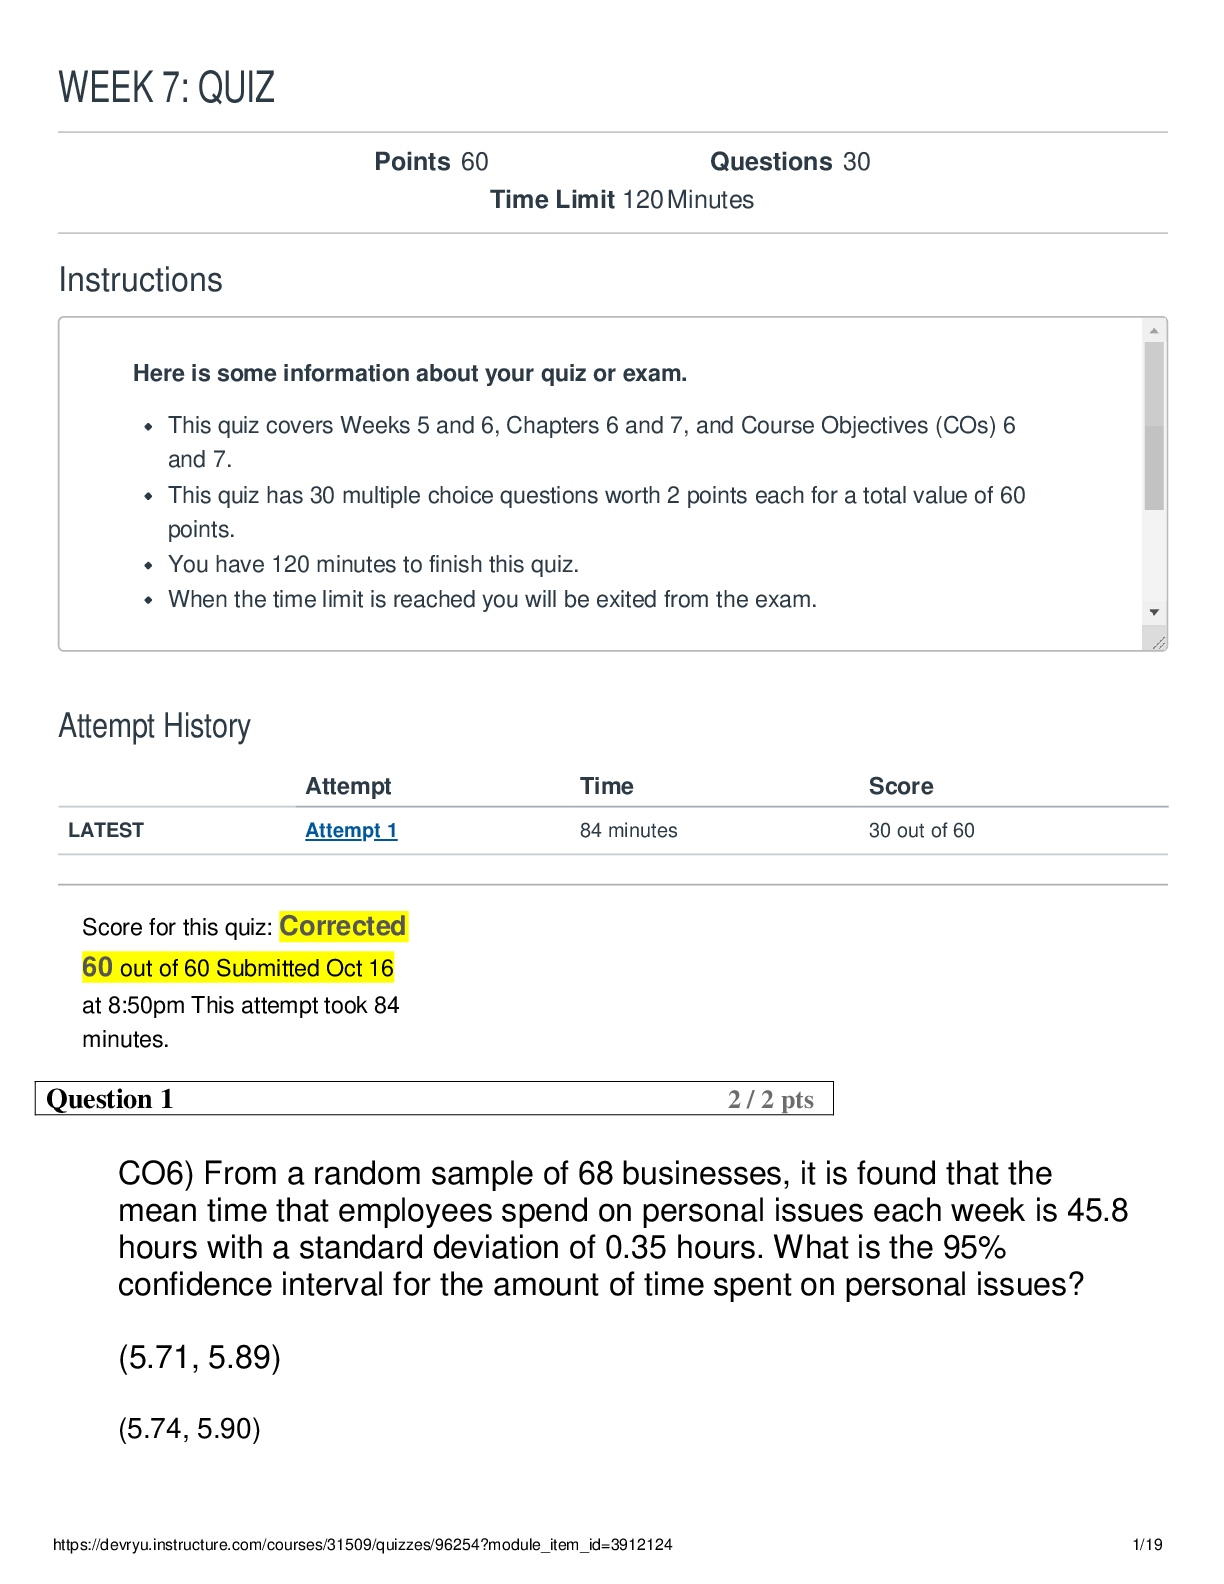
MATH 221 Quiz Week 7 | DeVry University | Complete Q&A Fall 20...
MATH 221 WEEK 8 FINAL EXAM ANSWERS updated Spring 2025/2026.

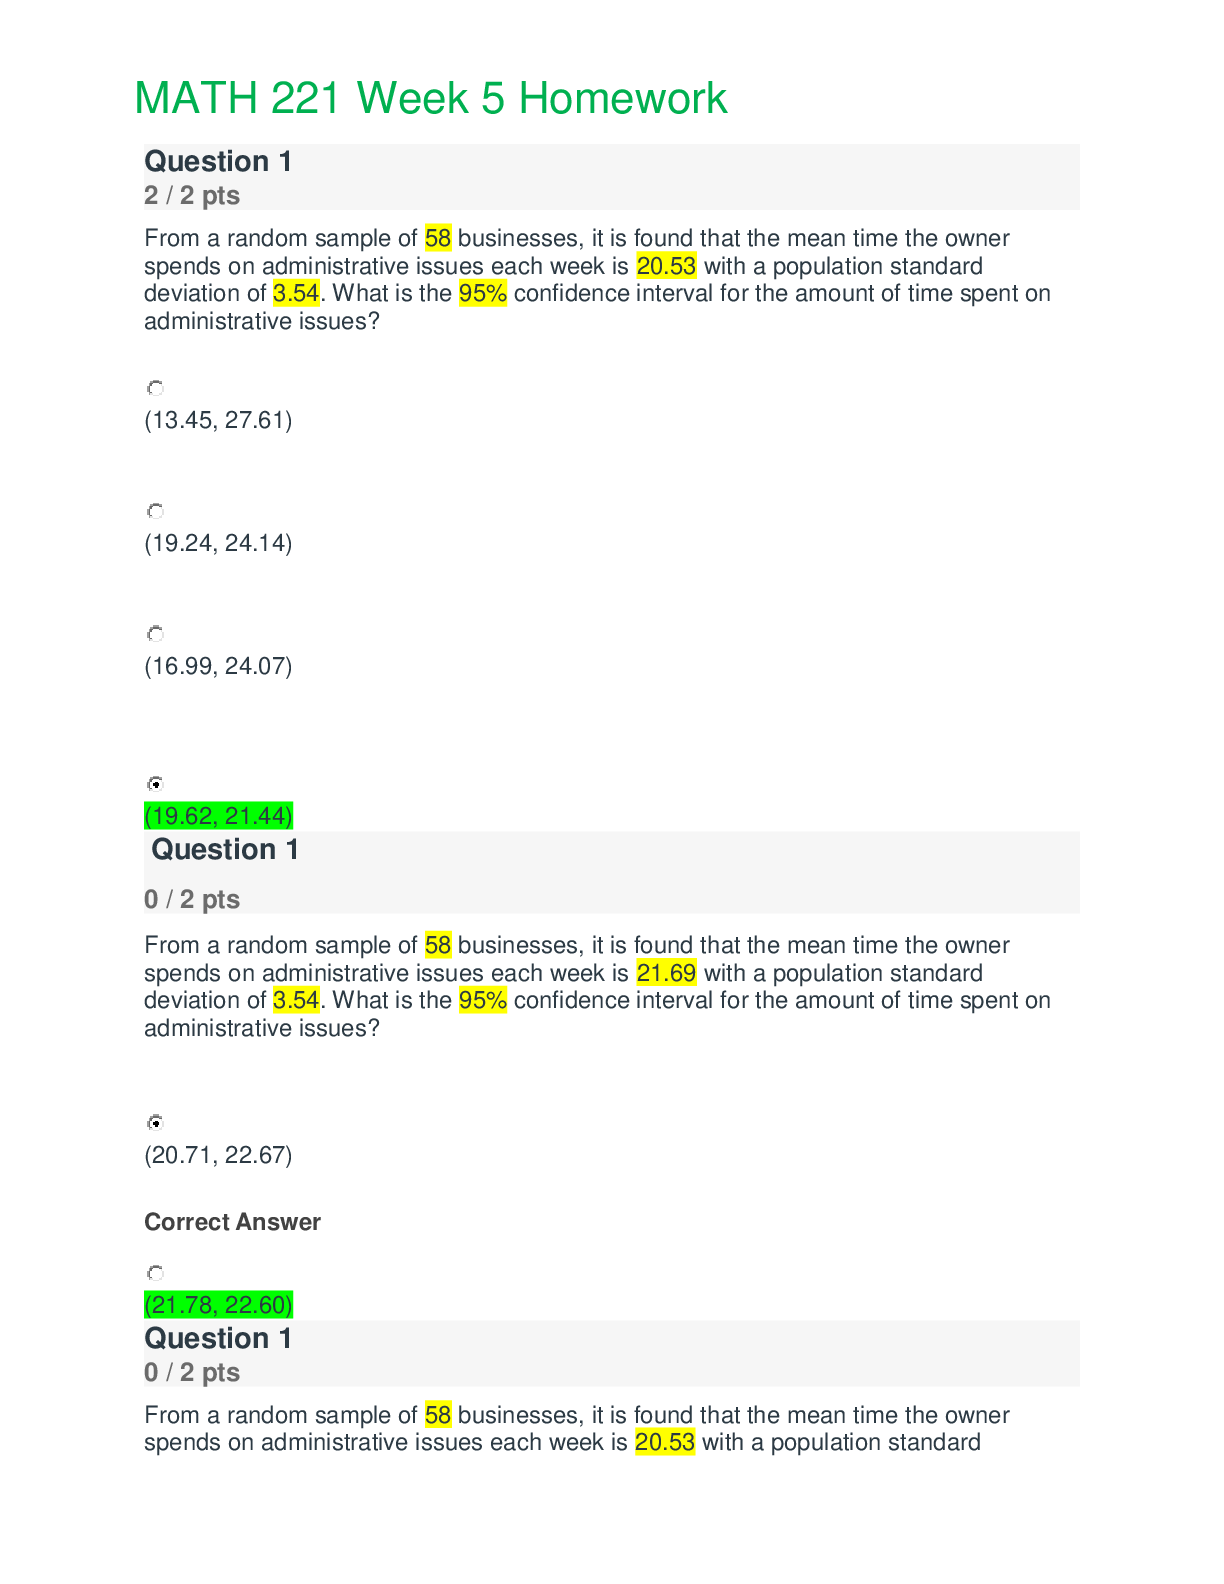
MATH 221 Week 5 Homework | 100 OUT OF 100 | DeVry University
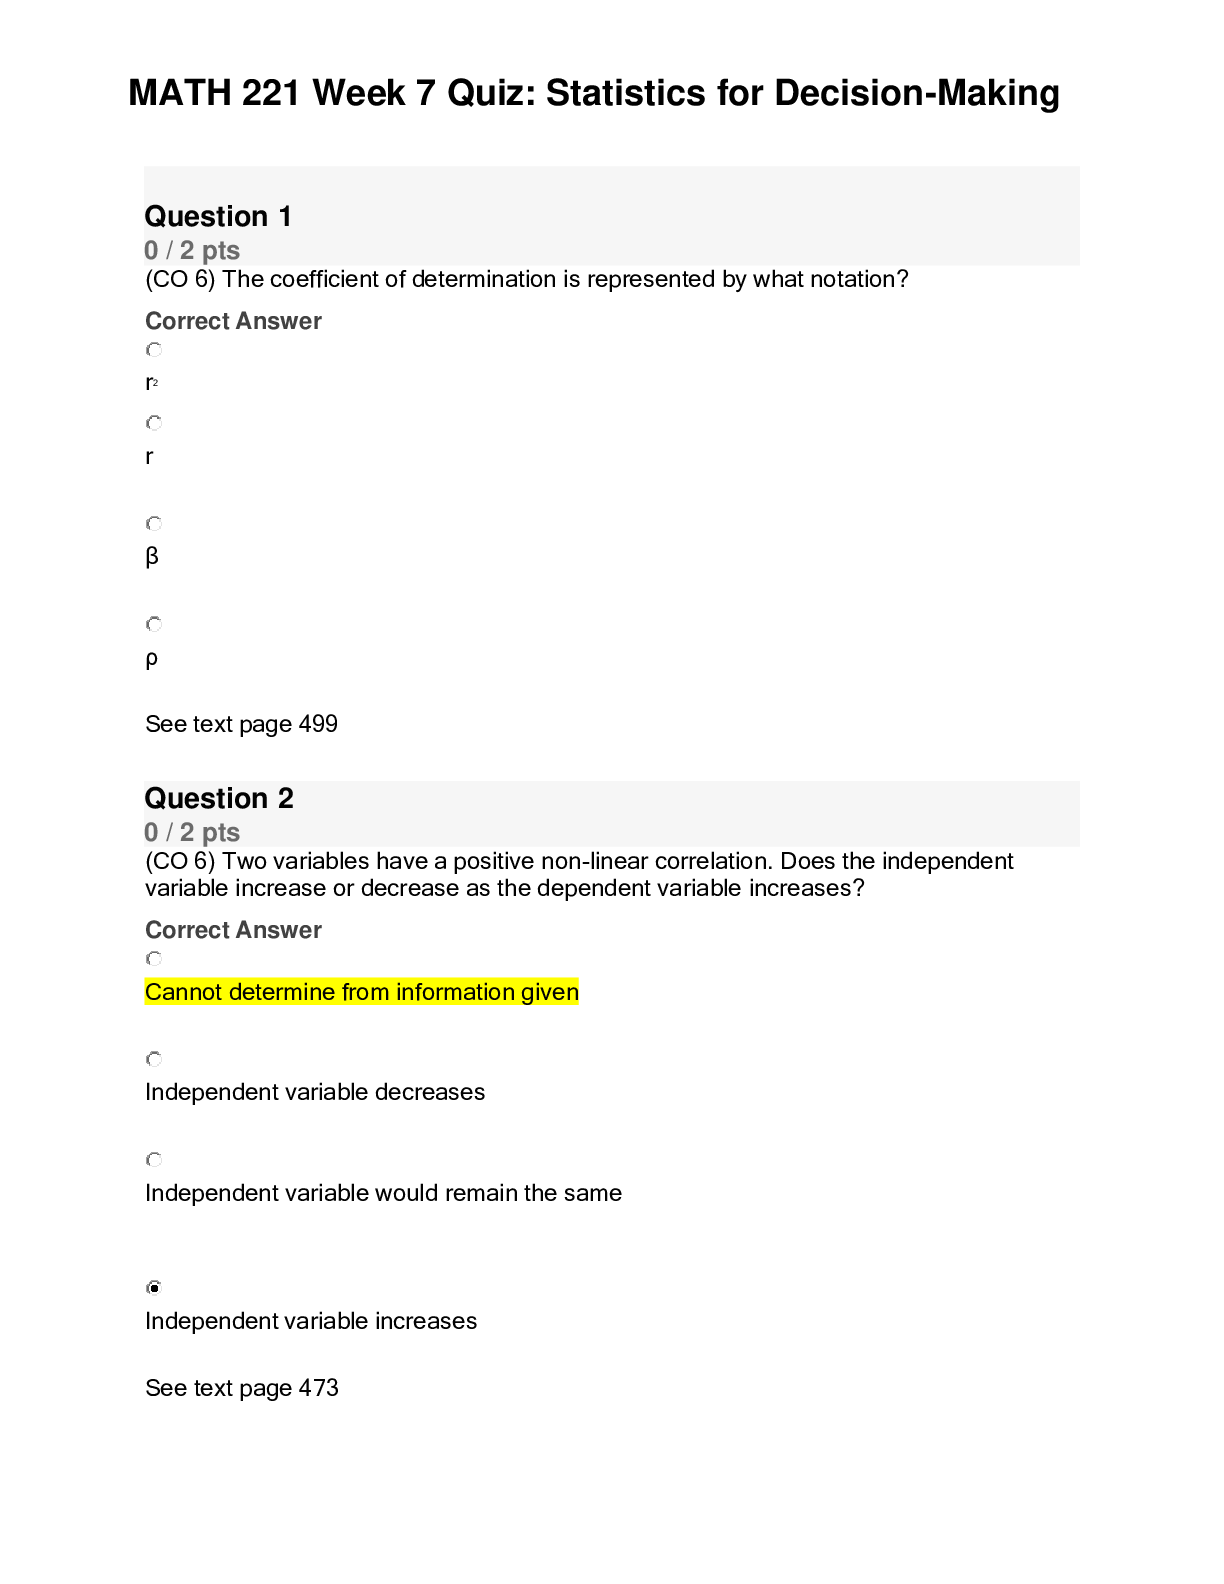
MATH 221 Week 7 Quiz: Statistics for Decision-Making (LATEST U...