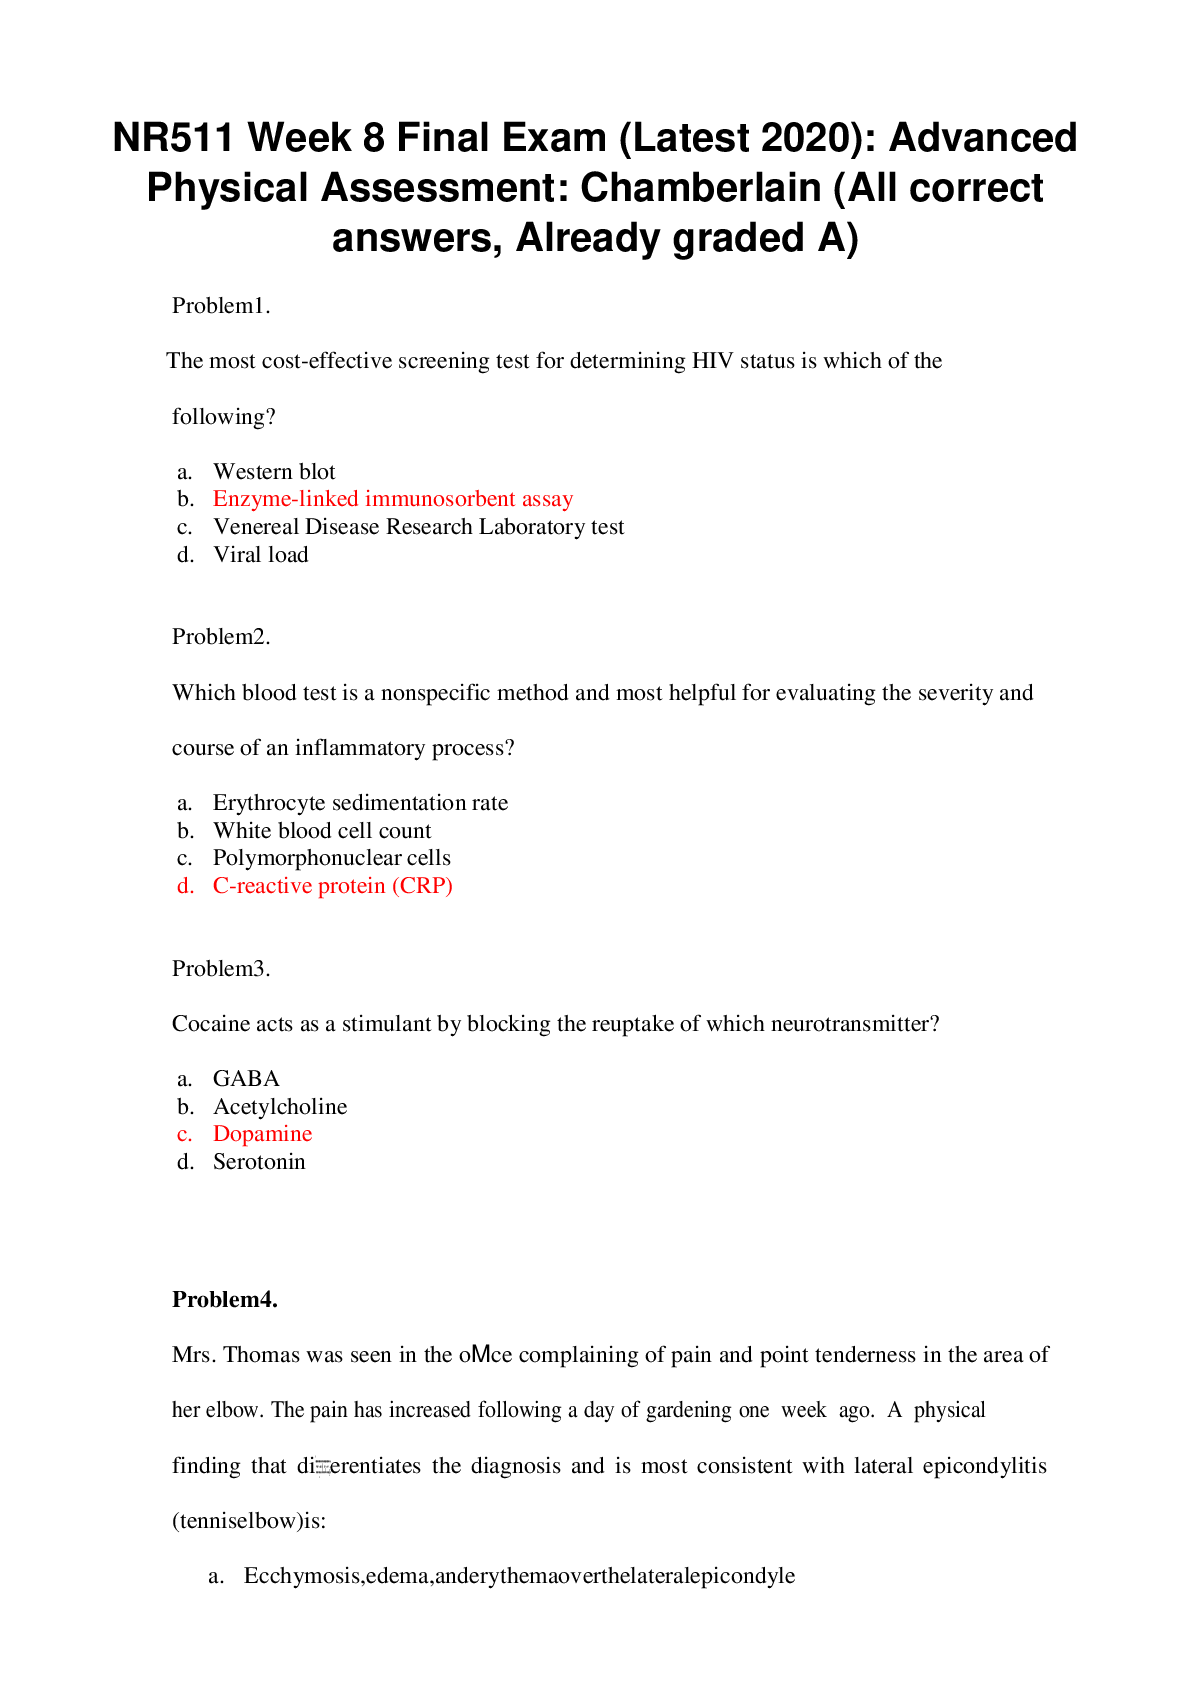
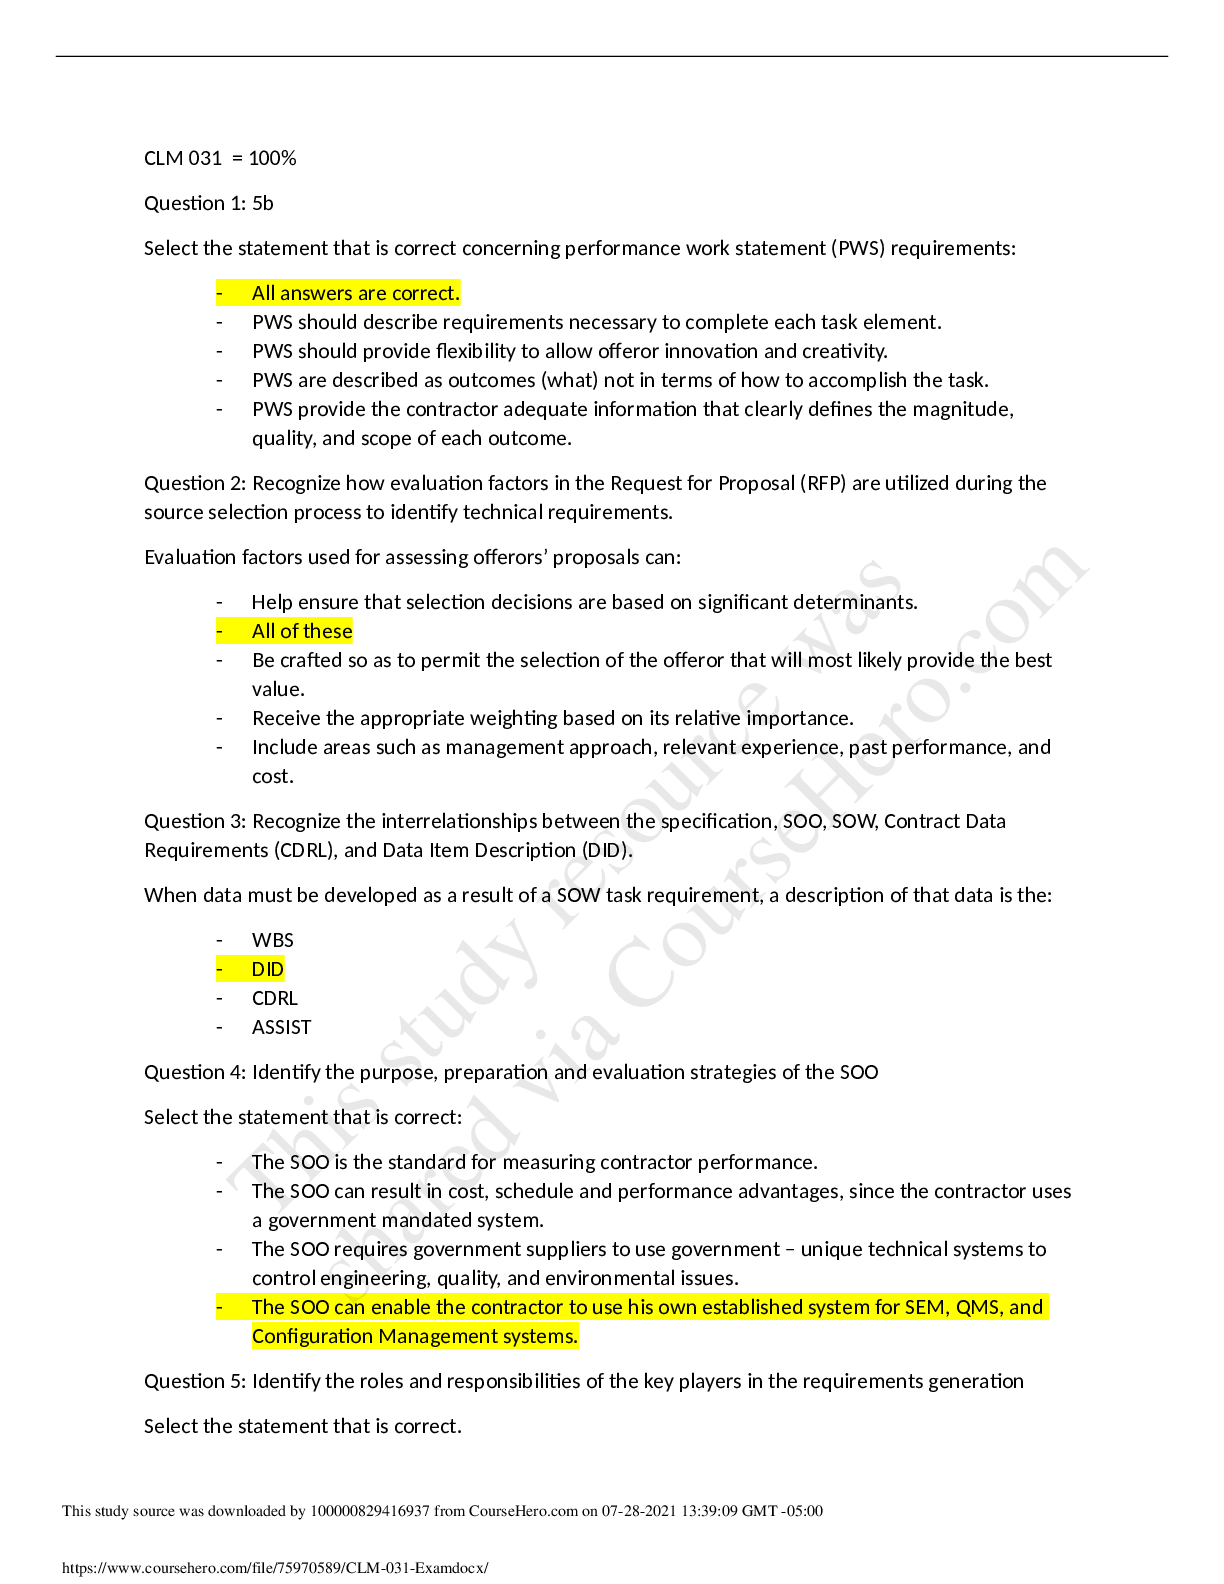
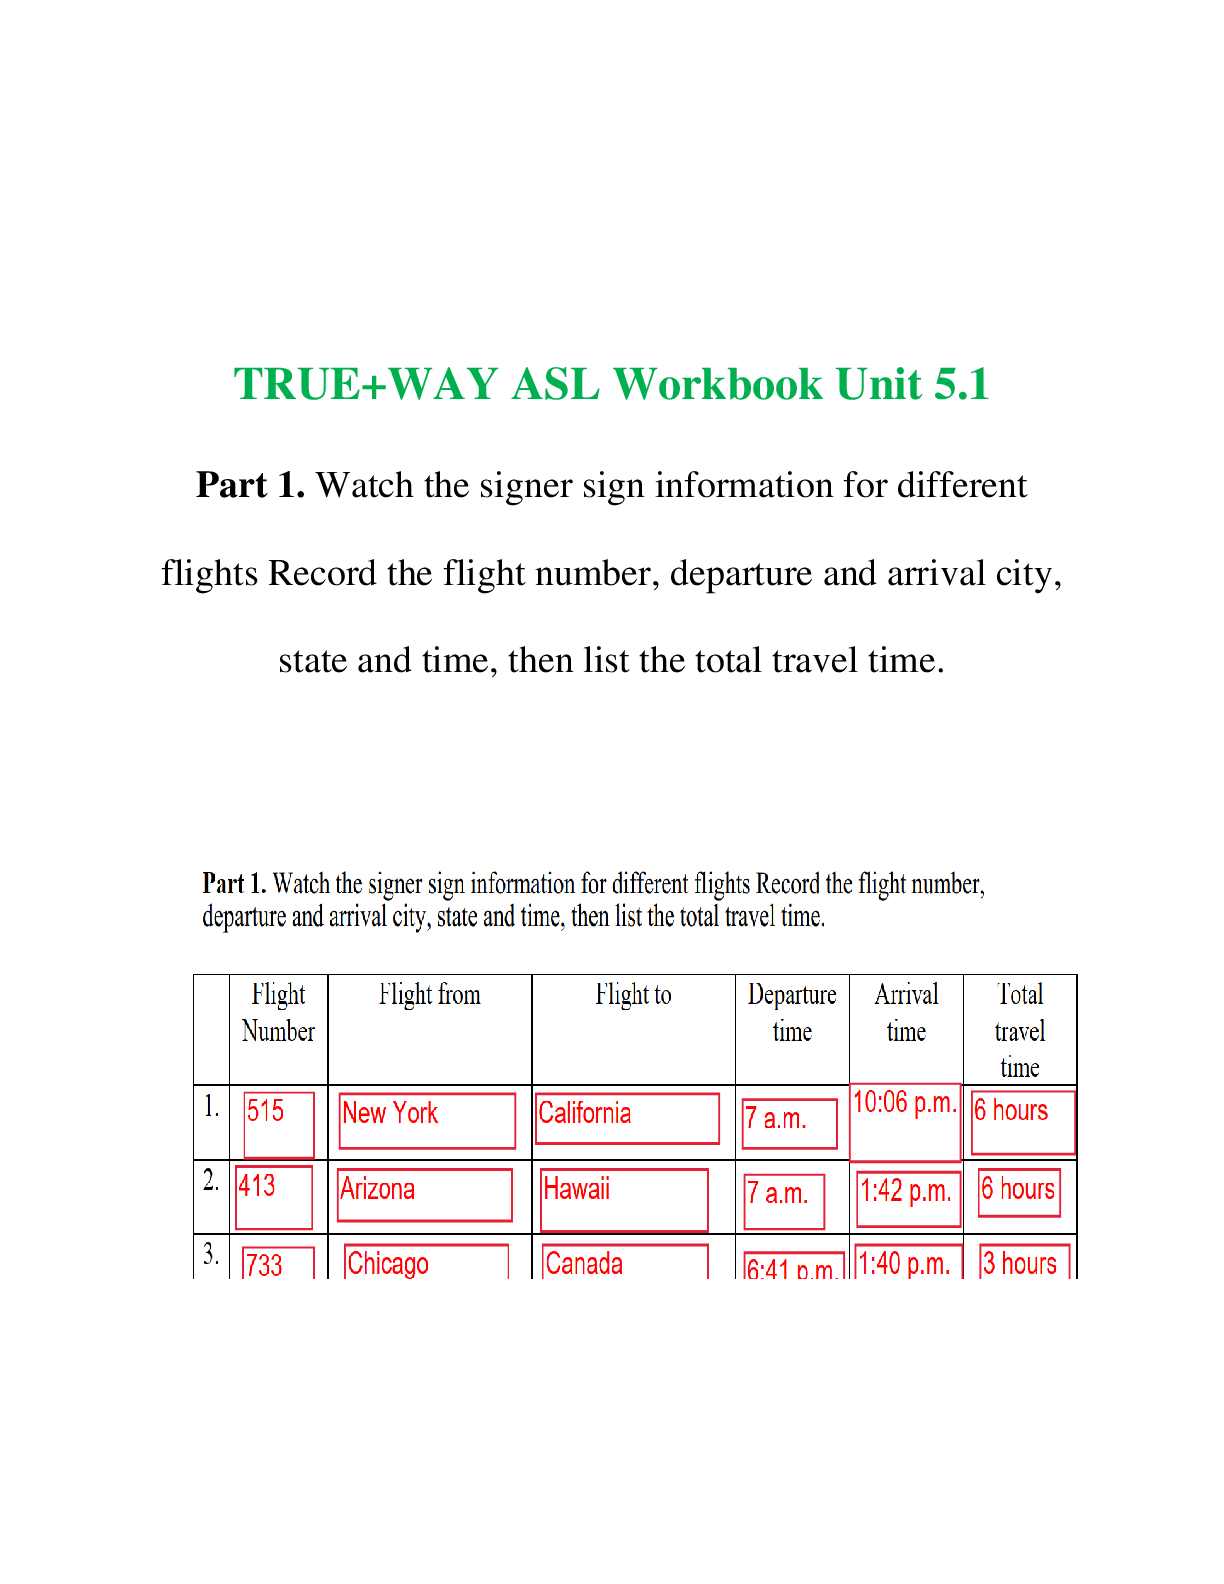
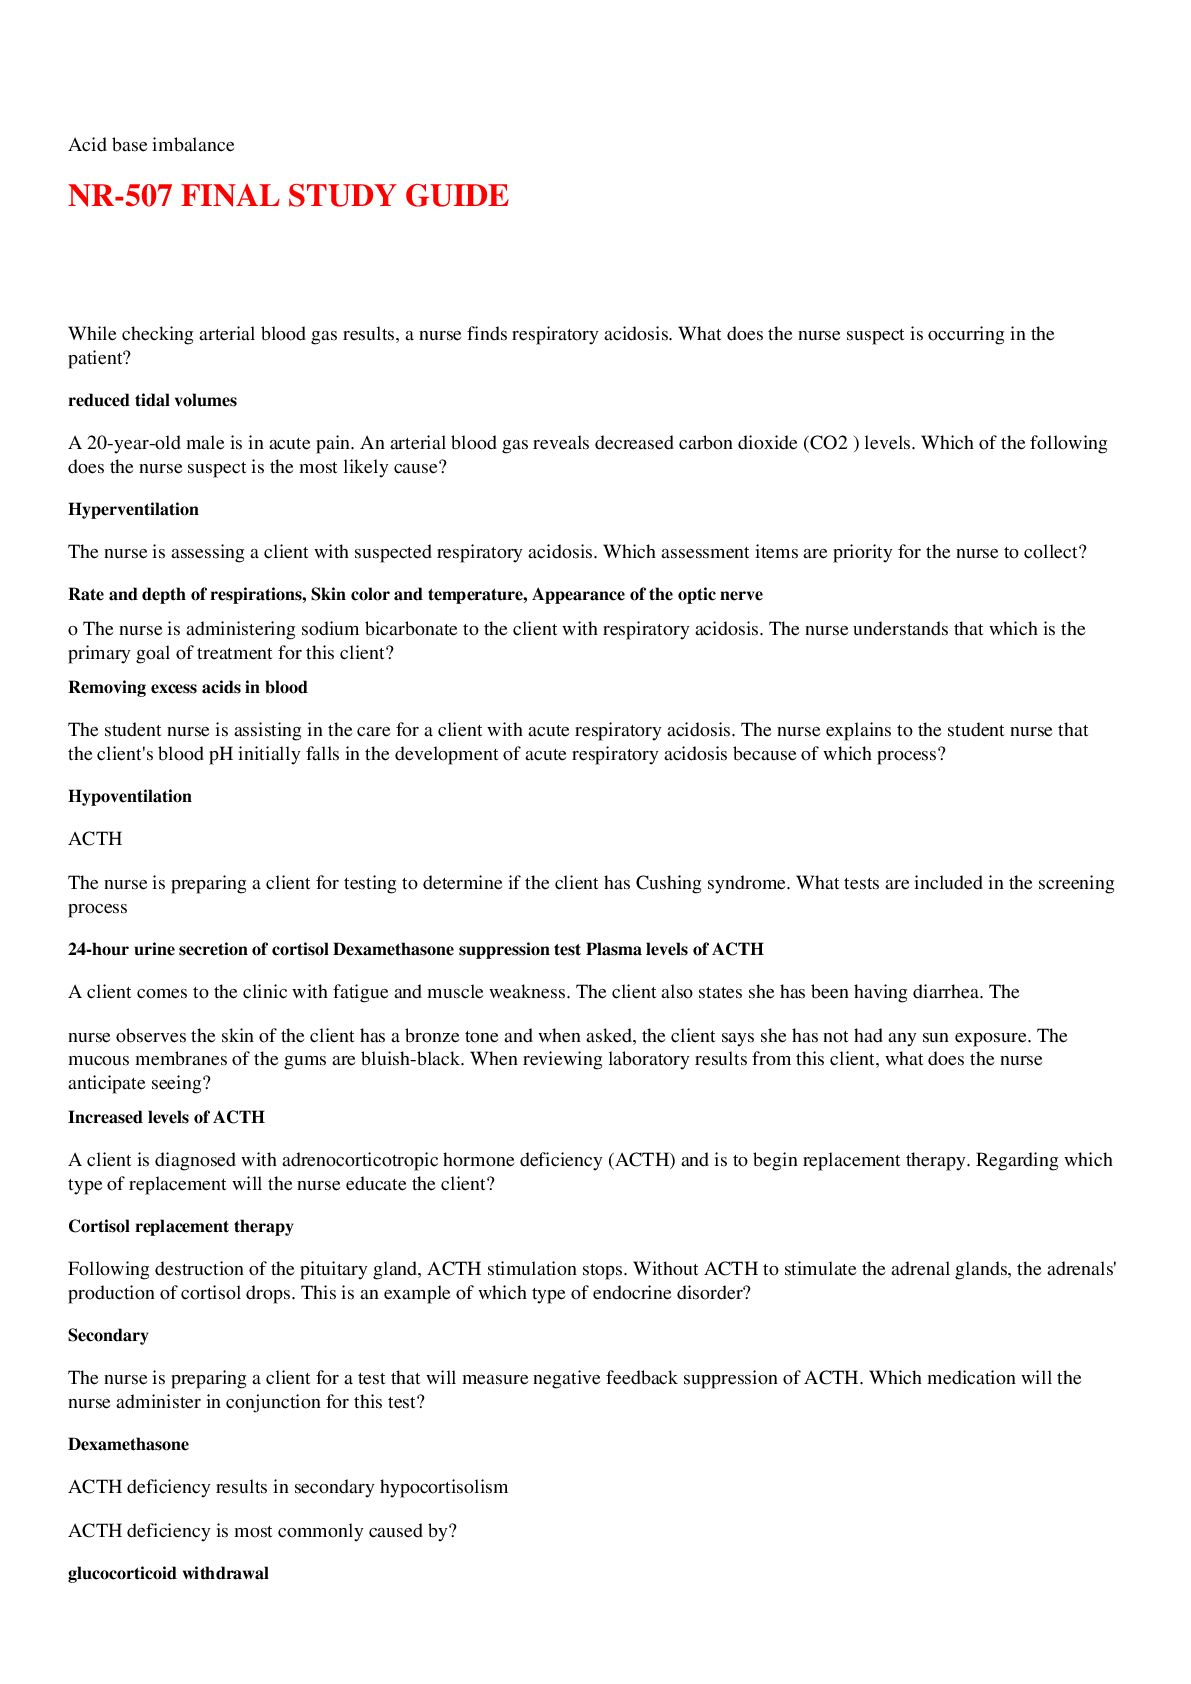
Statistics > QUESTIONS & ANSWERS > STAT 200 Week 6, Verified Answers Well Explained, Already Graded A+ (Perfect revision tool) (All)
STAT 200 Week 6, Verified Answers Well Explained, Already Graded A+ (Perfect revision tool)
Document Content and Description Below
Many high school students take the AP tests in different subject areas. In 2007, of the 144,796 students who took the biology exam 84,199 of them were female. In that same year, of the 211,693 stude... nts who took the calculus AB exam 102,598 of them were female ("AP exam scores," 2013). Estimate the difference in the proportion of female students taking the biology exam and female students taking the calculus AB exam using a 90% confidence level. Given that n1=144796,n2=211693 90% confidence interval for difference in p1-p2 =(0.5815-0.4847)+/-1.645*sqrt((0.5815*(1-0.5815)/144796)+(0.4847*(1- 0.4847)/211693)) =0.0968+/-0.0028 =(0.0941, 0.0996) 9.1.5 Are there more children diagnosed with Autism Spectrum Disorder (ASD) in states that have larger urban areas over states that are mostly rural? In the state of Pennsylvania, a fairly urban state, there are 245 eight year olds diagnosed with ASD out of 18,440 eight year olds evaluated. In the state of Utah, a fairly rural state, there are 45 eight year olds diagnosed with ASD out of 2,123 eight year olds evaluated ("Autism and developmental," 2008). Is there enough evidence to show that the proportion of children diagnosed with ASD in Pennsylvania is more than the proportion in Utah? Test at the 1% level. Research Question: Is there enough evidence to show that the proportion of children diagnosed with ASD in Pennsylvania is more than the proportion in Utah? Let p1 = Proportion of children diagnosed with ASD in Pennsylvania p2 = Proportion of children diagnosed with ASD in Utah Null hypothesis: H0: There is no significant difference between the proportion of children diagnosed with ASD between Pennsylvania and Utah, p1 = p2 Alternative hypothesis: H1: The proportion of children diagnosed with ASD in Pennsylvania is more than the porportion of children diagnosed with ASD in Utah, p1 > p2 Level of significance: Critical Region: Since, the alternative hypothesis is testing on the one-side(researcher is interseted if proportion in one group is more than the other) the hypothesis is tested at one tail. Therefore, form the standard normal table for 1% level of significance the Z-value is given as 2.33. Therefore, the null hypothesis will be rejected if the Z-test statistic is more than 2.33 [Show More]
Last updated: 2 years ago
Preview 1 out of 11 pages

Buy this document to get the full access instantly
Instant Download Access after purchase
Buy NowInstant download
We Accept:

Reviews( 0 )
$13.00
Can't find what you want? Try our AI powered Search
Document information
Connected school, study & course
About the document
Uploaded On
Sep 06, 2022
Number of pages
11
Written in

Additional information
This document has been written for:
Uploaded
Sep 06, 2022
Downloads
0
Views
58


.png)