Solar_Radiation_and_Albedo_Activity
Document Content and Description Below
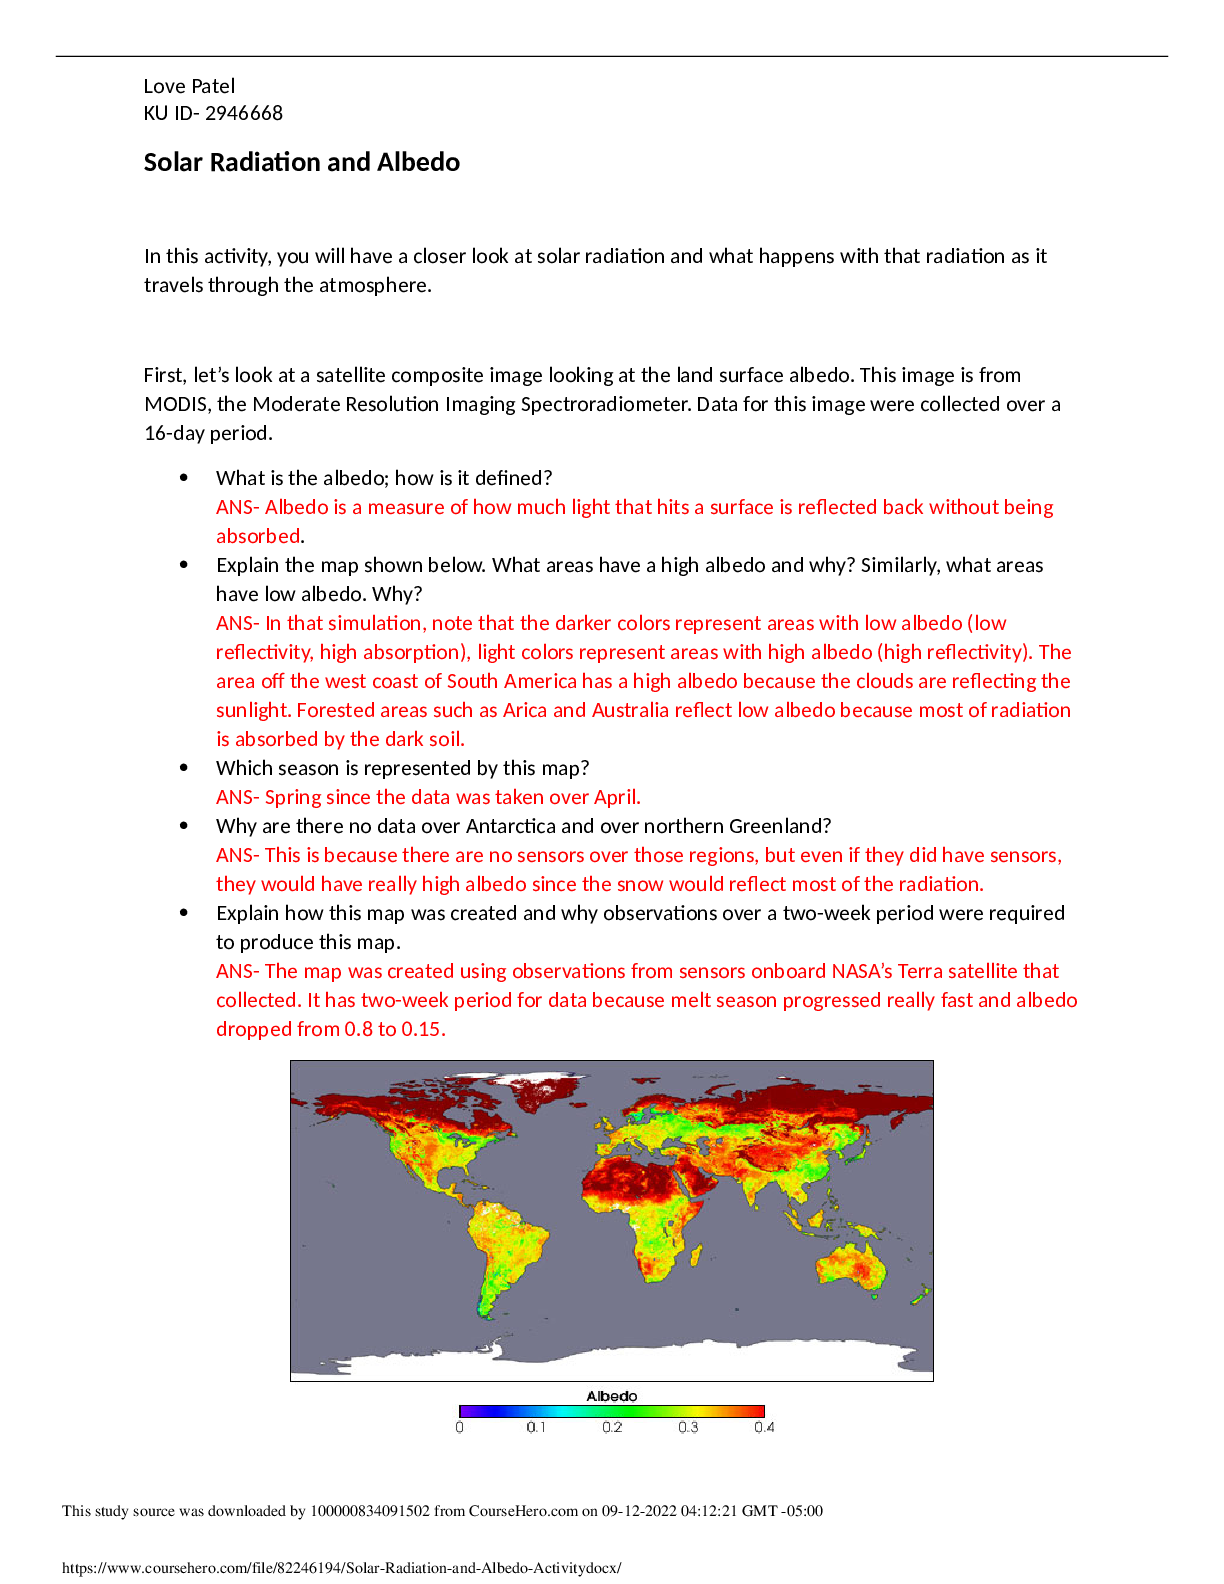
Solar_Radiation_and_Albedo_ActivitySolar Radiation and Albedo
In this activity, you will have a closer look at solar radiation and what happens with that radiation as it
travels through the atmosphere.
First, let’s lo
...
[Show More]
Last updated: 3 years ago
Preview 1 out of 3 pages
Instant download
Buy this Document to get the Full Access Instantly
Provided by Students Who Aced it
We Verify Document Content to Gurantee Accuracy
Reviews( 0 )
Document information
Connected school, study & course
About the document
Uploaded On
Sep 13, 2022
Number of pages
3
Written in
All

Additional information
This document has been written for:
Uploaded
Sep 13, 2022
Downloads
0
Views
488
Document Keyword Tags
Recommended For You
Get more on Report »
$25
371 Pages
Investigating Astronomy, 2nd Edition Timothy Slater, Roger Fre...

$20
32 Pages
Solution Manual for Fundamentals of Radio Astronomy Observatio...
$19
141 Pages
Test Bank for 21st Century Astronomy 5th Edition By Laura Kay,...

$22
114 Pages
INSTRUCTOR'S SOLUTIONS MANUAL for Explorations: Introduction t...

$18
560 Pages
The Cosmic Perspective 7th Edition by Jeffrey O. Bennett, Mega...
$22
148 Pages
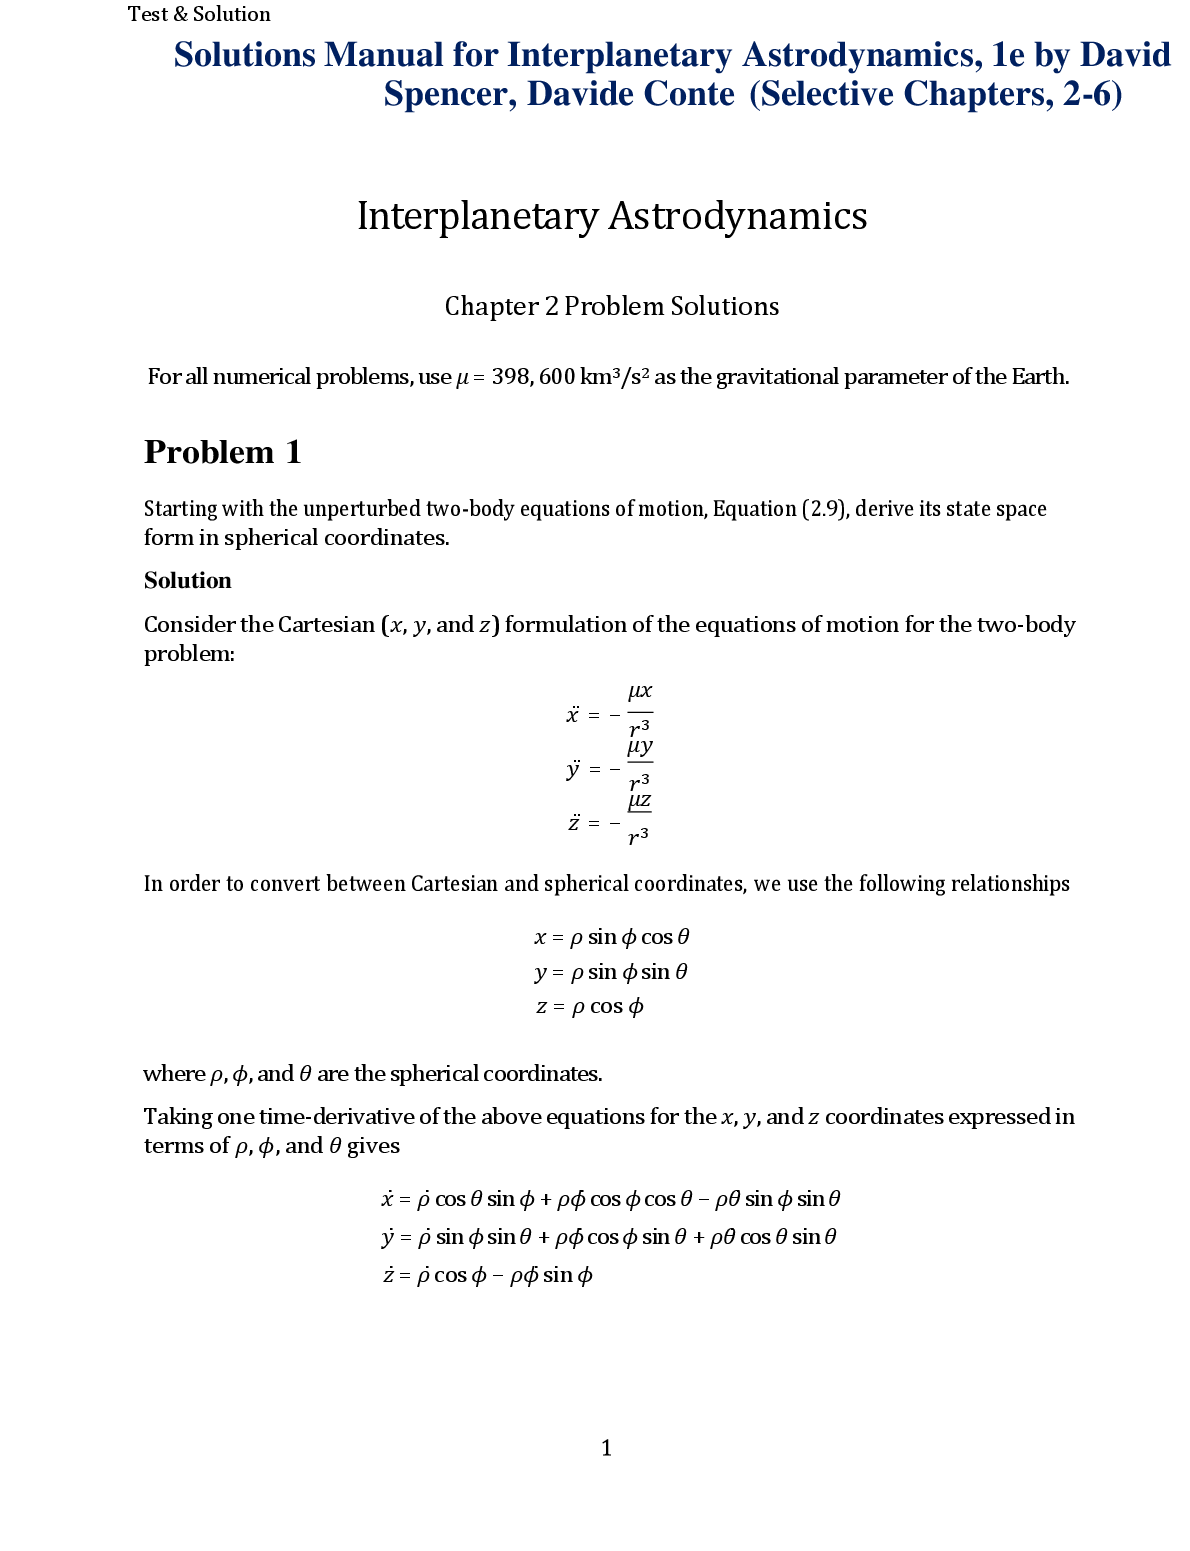
SOLUTIONS MANUAL for Interplanetary Astrodynamics 1st Edition...
$19
147 Pages
Solutions Manual for Interplanetary Astrodynamics, 1st Edition...

$19
527 Pages
TEST BANK for Explorations: Introduction to Astronomy 9th Edit...
$19.5
578 Pages
TEST BANK FOR 21ST CENTURY ASTRONOMY 6th Edition By Laura Kay,...
$20
418 Pages
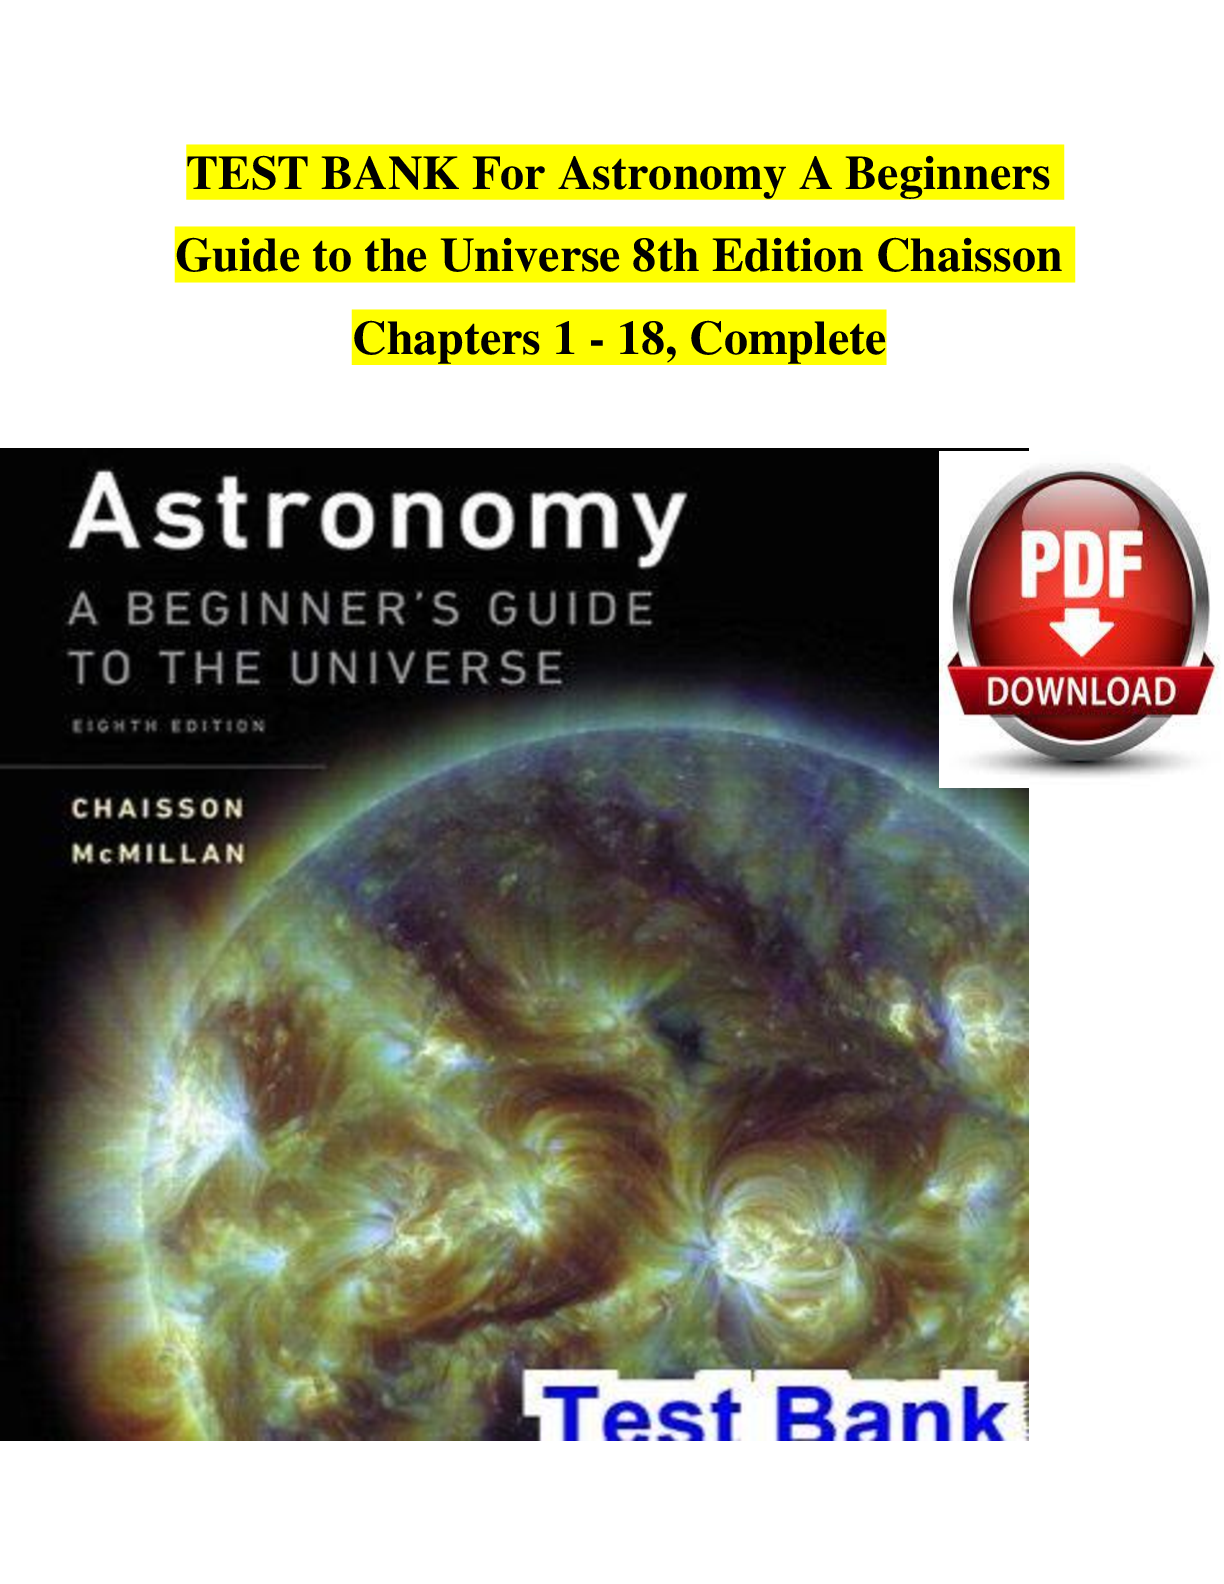
Test Bank for Astronomy: A Beginner’s Guide to the Universe, 8...

$19
132 Pages
Instructor Solutions Manual for Stars and Stellar Processes 1s...

$17
72 Pages
Student Solutions Manual for Stars and Stellar Processes 1st E...


More related documents below