Statistics > ANSWERS AND COMMENTARIES > Descriptive statistics and probability STA1501 (All)
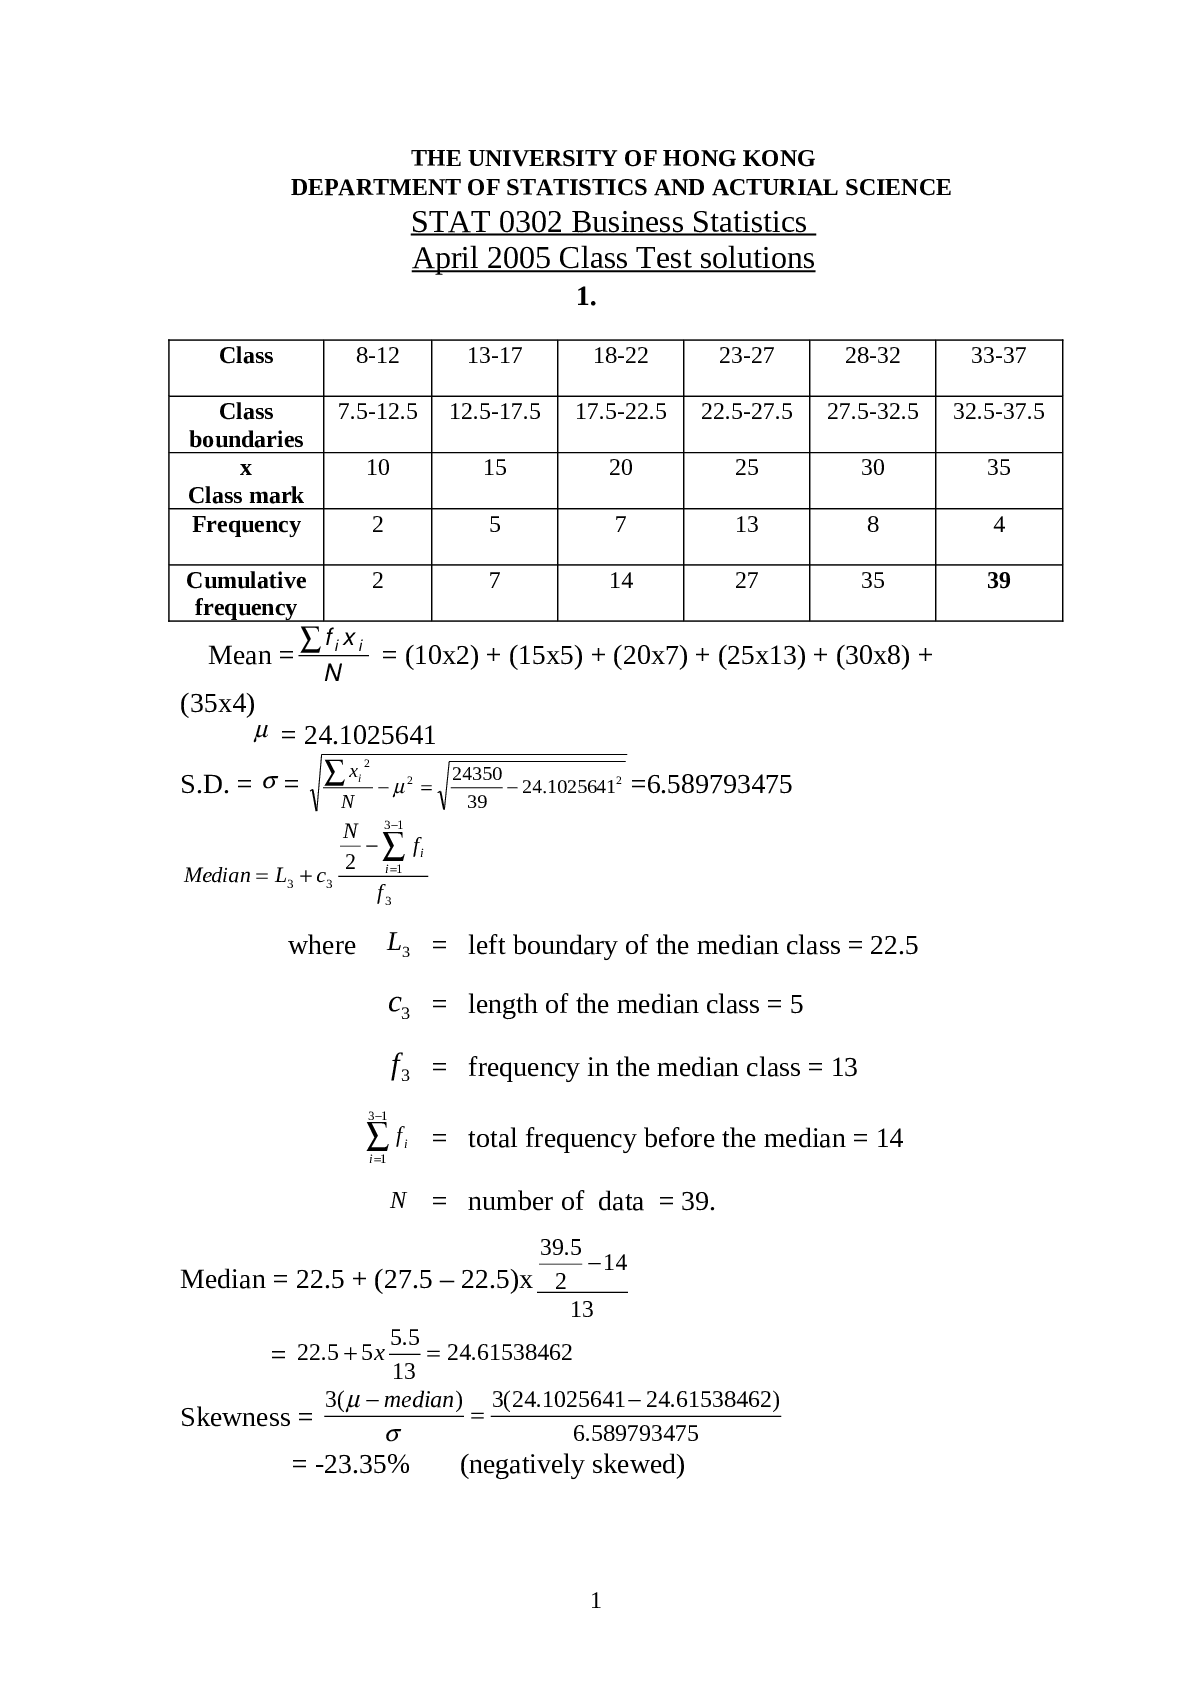
Descriptive statistics and probability STA1501
Document Content and Description Below
Last updated: 3 years ago
Preview 1 out of 12 pages
Instant download
Buy this Document to get the Full Access Instantly
Provided by Students Who Aced it
We Verify Document Content to Gurantee Accuracy
Reviews( 0 )
Document information
Connected school, study & course
About the document
Uploaded On
Oct 07, 2022
Number of pages
12
Written in
All

Additional information
This document has been written for:
Uploaded
Oct 07, 2022
Downloads
0
Views
153
Document Keyword Tags
Recommended For You
Get more on ANSWERS AND COMMENTARIES »
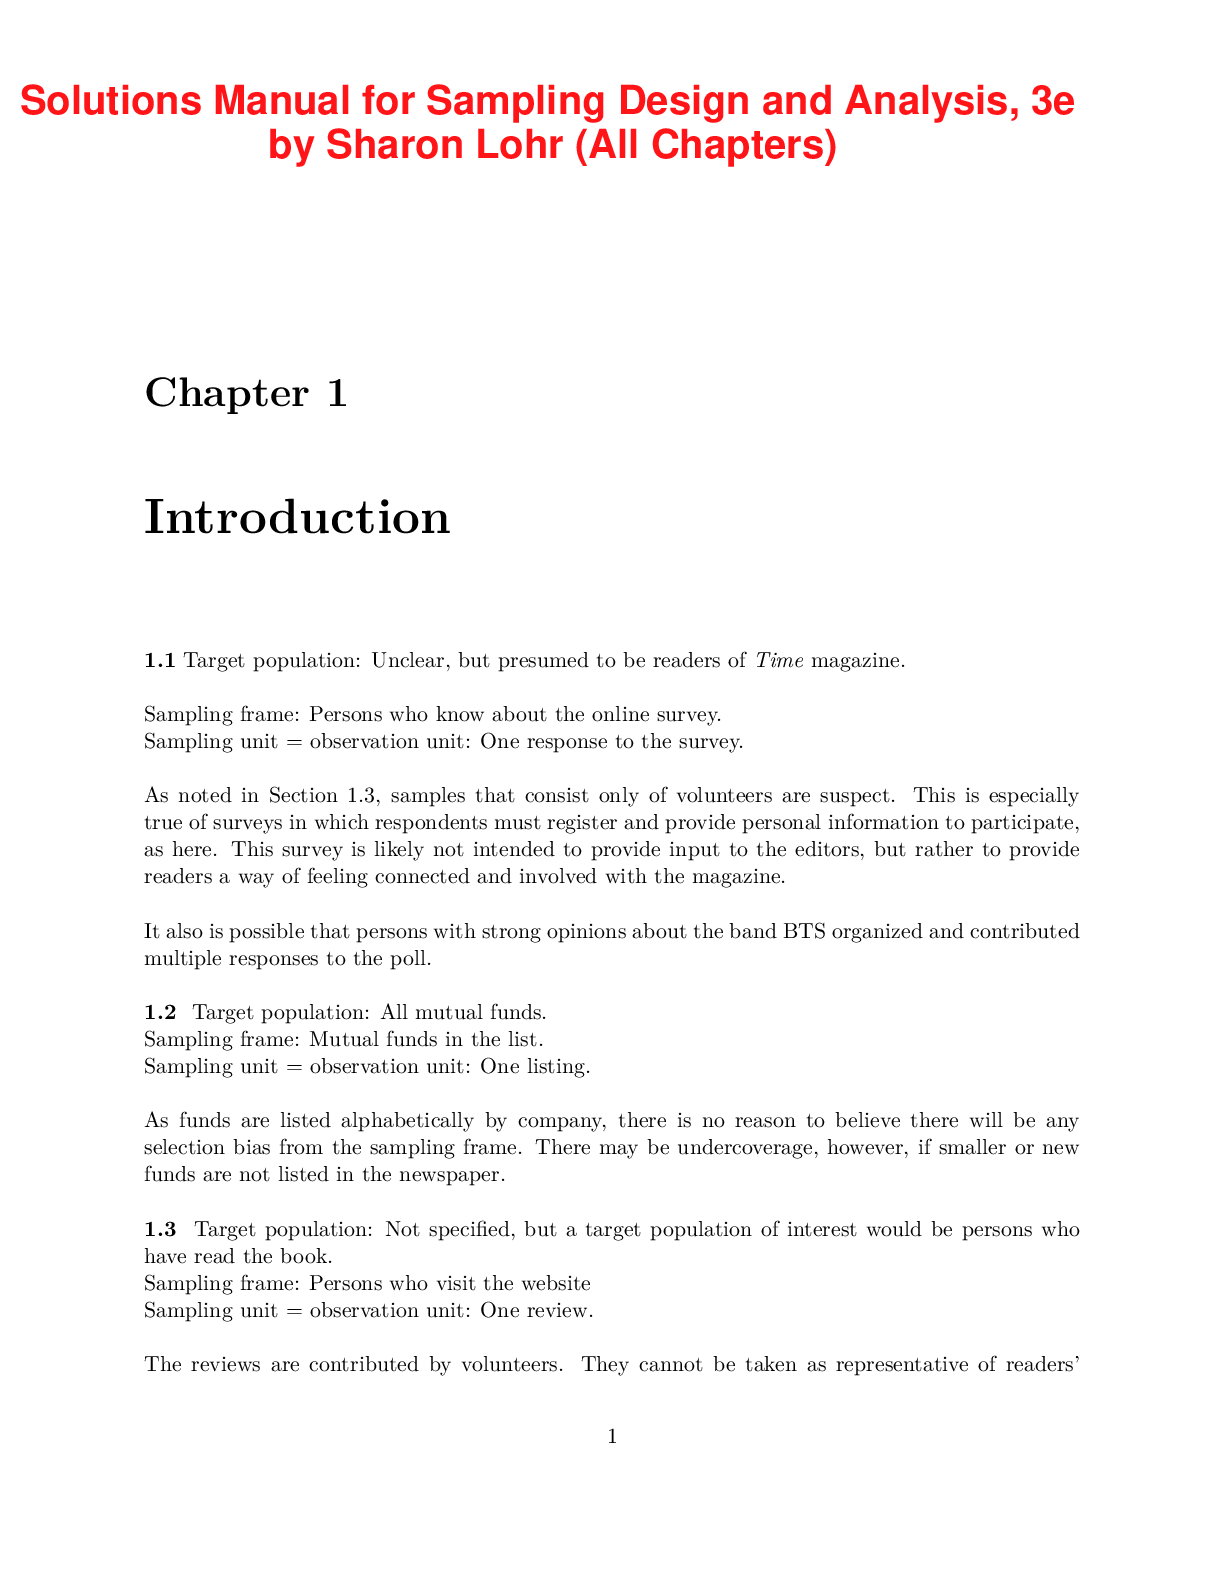
Sampling Design and Analysis, 3e by Sharon Lohr (Solutions Man...
.png)
Business Statistics, 4e Norean Sharpe, Richard Veaux, Paul Vel...
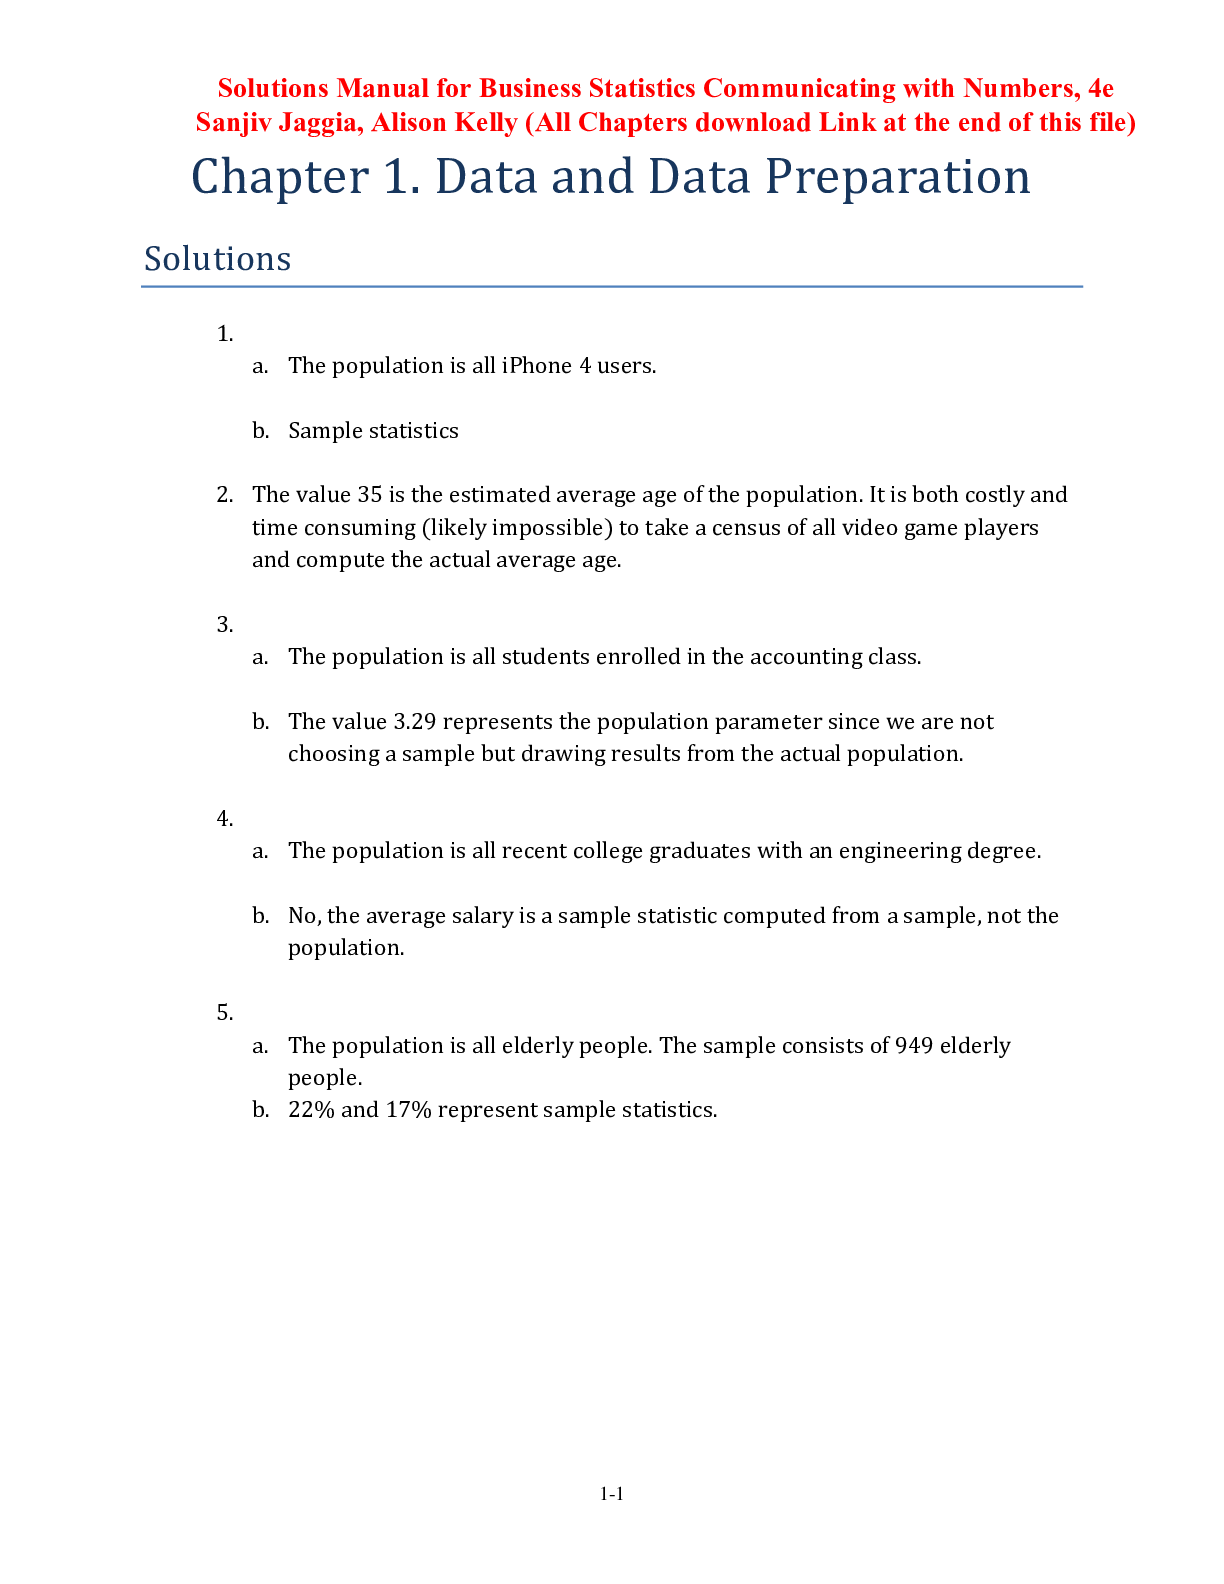
Solutions Manual for Business Statistics Communicating with Nu...
test_bank_for_psychiatric_mental_health_nursing_7th_edition_by...
Test Bank for Physics, 12th Edition John D. Cutnell, Kenneth W...
![Preview of Test bank for precalculus[young].](https://browseimages.nyc3.digitaloceanspaces.com/paper-images/2025/Jan/13/NW7M8pa12025-01-13-04-24678513ff0234c.png)
Test Bank For Prehospital Emergency Care, 12th Edition by Jose...
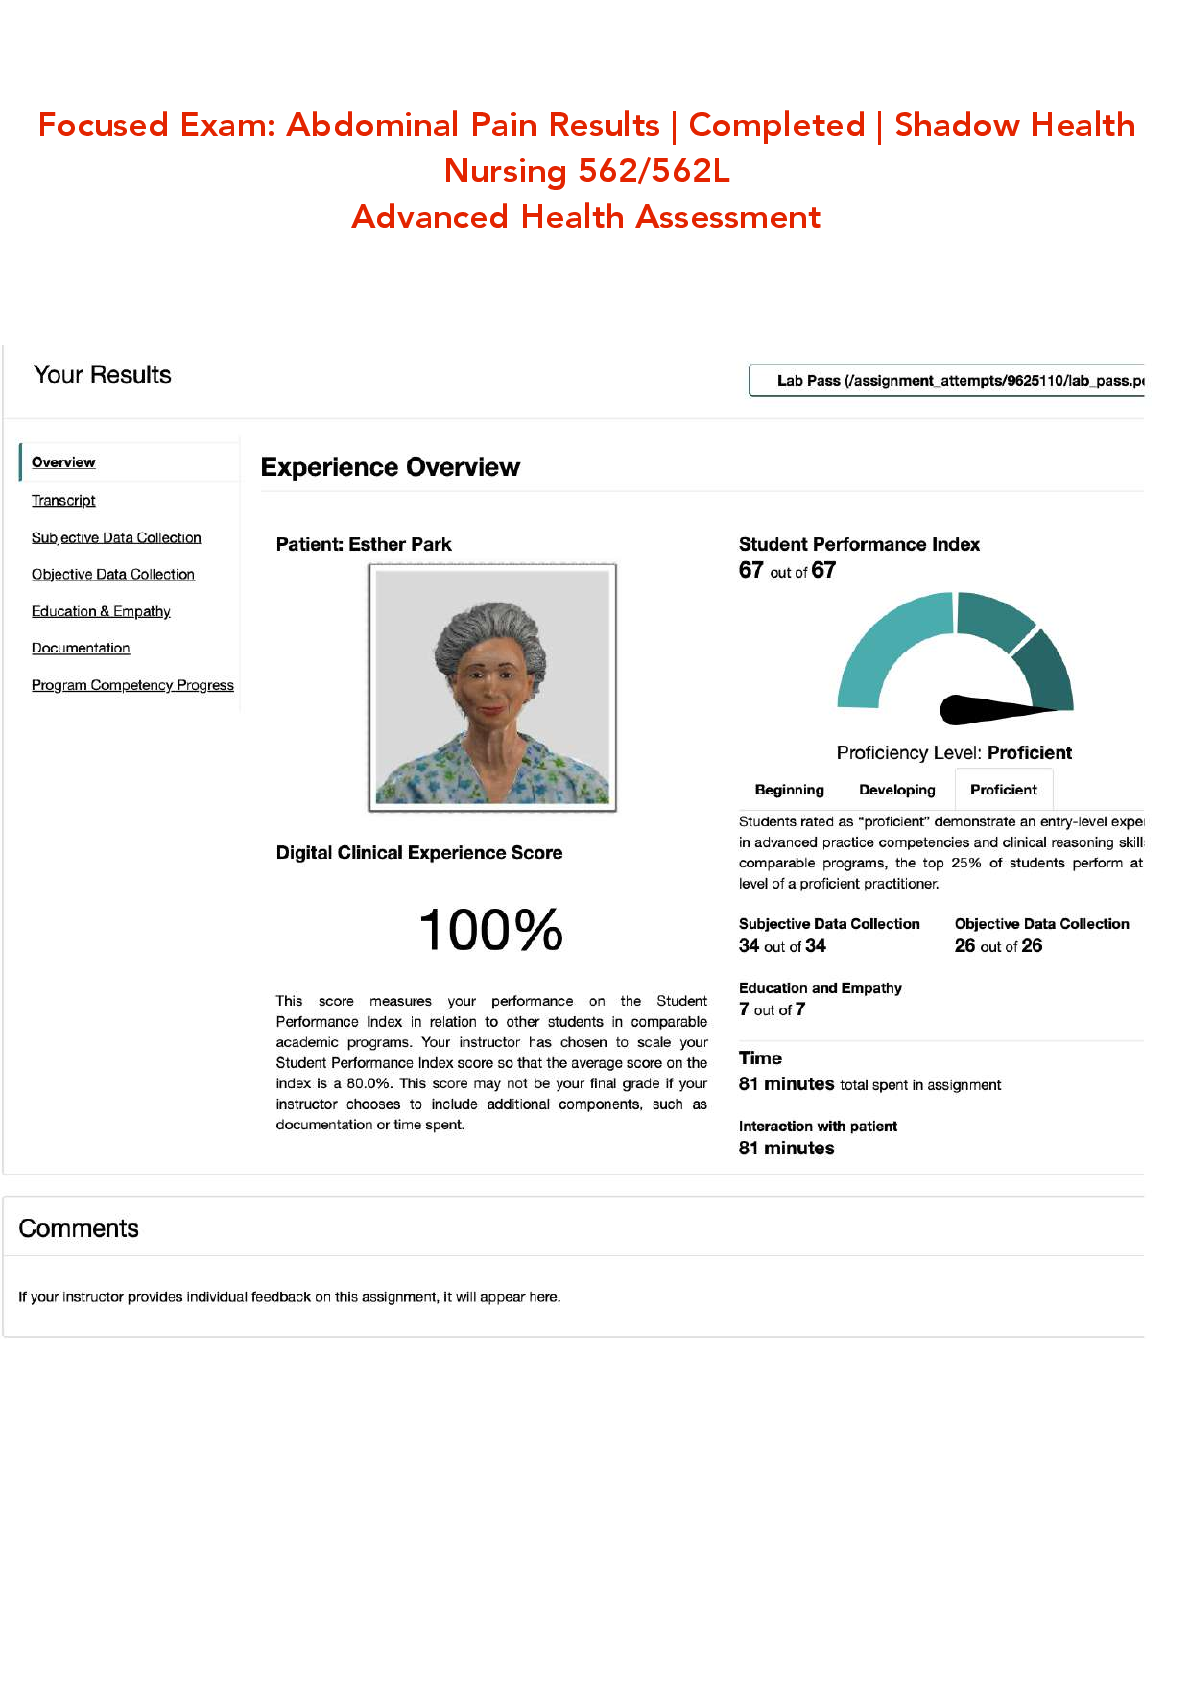
Shadow Health Nursing 562/562L Focused Exam: Abdominal Pain R...
ALPHA PHI ALPHA PRETEST FOR IMDP STUDY GUIDE 2025-2026 NEW GEN...

CSE 6203 Security Evaluation and Assessment Methodology Sectio...
NR 546 Final Exam study guide | Chamberlain College of Nursing
.png)


.png)