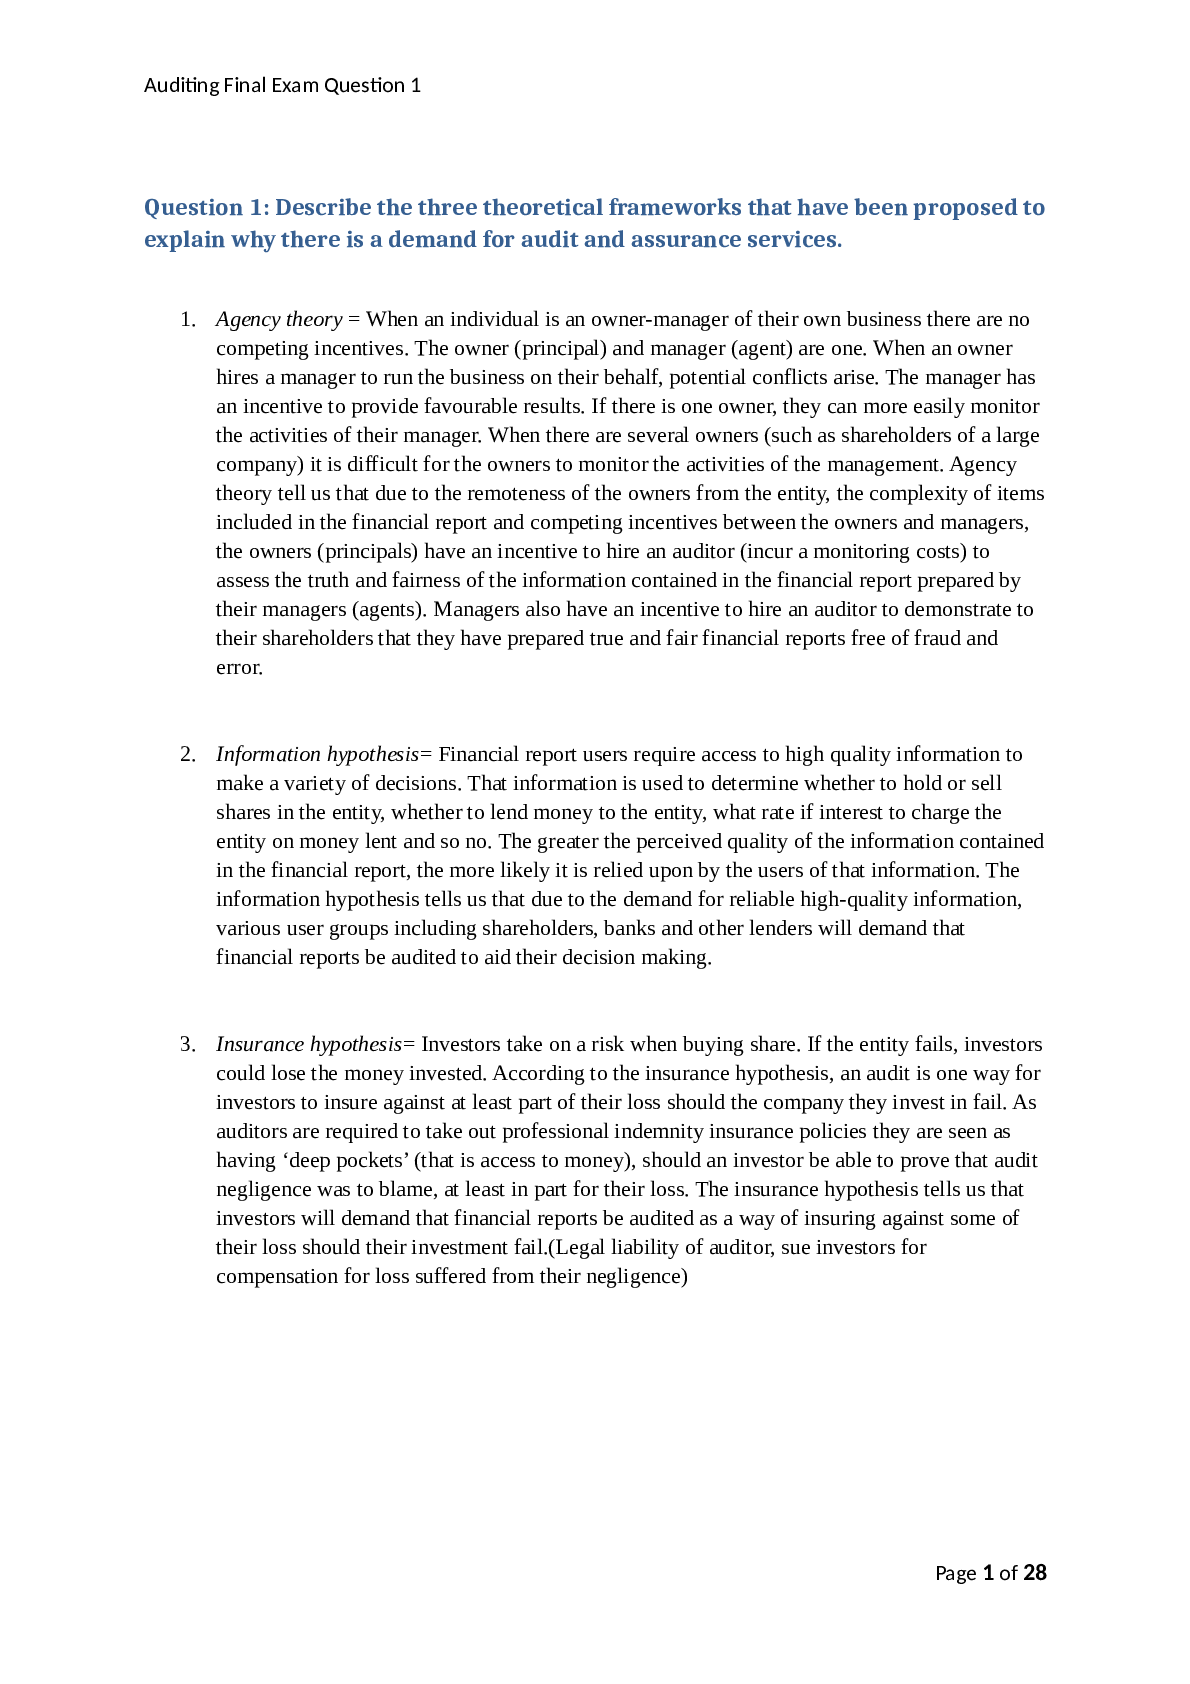
1. The following graph is the dotplot of the data which gives the survival
time (in weeks) after chemotherapy of 27 terminally-ill cancer patients.
Find the mean (¯x) and the median (˜x).
A) ¯x = 11.296, x˜ = 11 B) ¯x
...
1. The following graph is the dotplot of the data which gives the survival
time (in weeks) after chemotherapy of 27 terminally-ill cancer patients.
Find the mean (¯x) and the median (˜x).
A) ¯x = 11.296, x˜ = 11 B) ¯x = 12.563, x˜ = 12
C) ¯x = 10.541, x˜ = 11 D) ¯x = 11.575, x˜ = 13
E) ¯x = 10.332, x˜ = 12
Solution: The mean is
x¯ =
9 × 6 + 10 × 5 + 11 × 5 + 12 × 3 + 13 × 4 + 14 × 2 + 15 × 2
27
= 11.296
The median is ˜x = y14 = 11. The answer is A.
2. A chemical spill occurring in a river affected the fish downstream. It
is estimated that 30% of the fish are contaminated, i.e. contain more
than 1.5 mg of the chemical per kilogram of body weight. A fisherman
has caught 5 fish. What is the probability that at least 2 fish are contaminated?
A) 0.5282 B) 0.4718 C) 0.1631 D) 0.3601 E) 0.8369
Solution: Let X be the number of contaminated fish, in the sample of
5 fish. X has a binomial distribution with n = 5 trials and p = 0.30.
2
Downloaded by Namhyuk kim (
[email protected])
lOMoARcPSD|6818537
The desired probability is:
P(X ≥ 2) = 1 − P(X = 0) − P(X = 1) = 1 − (0.7)5 − 5(0.3)(0.7)4
= 1 − 0.1680 − 0.3601 = 1 − 0.5282 = 0.4718
The answer is B.
3. Let X be the number of smokers in a family composed of a husband
and wife. X is a random variable which takes the values 0, 1, 2, with
respective probabilities p0, p1, p2. The average number of smokers per
family is 0.63. 40% of families contain at least one smoker. Find the
probabilities p0, p1 and p2.
A) p0 = 0.6, p1 = 0.35, p2 = 0.05 B) p0 = 0.6, p1 = 0.2, p3 = 0.2
C) p0 = 0.6, p1 = 0.17, p2 = 0.23 D) p0 = 0.4, p1 = 0.4, p3 = 0.2
E) p0 = 0, p1 = 0.31, p2 = 0.16
Solution: We know that P(X ≥ 1) = p1 + p2 = 0.4. Hence p0 = 0.6.
We have:
[Show More]