Mathematics > QUESTIONS & ANSWERS > Unit 6 portfolio_ MATH MISC. Linear Functions Unit Portfolio. All Answers. (All)
Unit 6 portfolio_ MATH MISC. Linear Functions Unit Portfolio. All Answers.
Document Content and Description Below
Last updated: 3 years ago
Preview 1 out of 4 pages
Instant download

Buy this Document to get the Full Access Instantly
Provided by Students Who Aced it
We Verify Document Content to Gurantee Accuracy
Reviews( 0 )
Document information
Connected school, study & course
About the document
Uploaded On
Jan 15, 2023
Number of pages
4
Written in
All

Additional information
This document has been written for:
Uploaded
Jan 15, 2023
Downloads
0
Views
121
Topic Tags
Recommended For You
Get more on QUESTIONS & ANSWERS »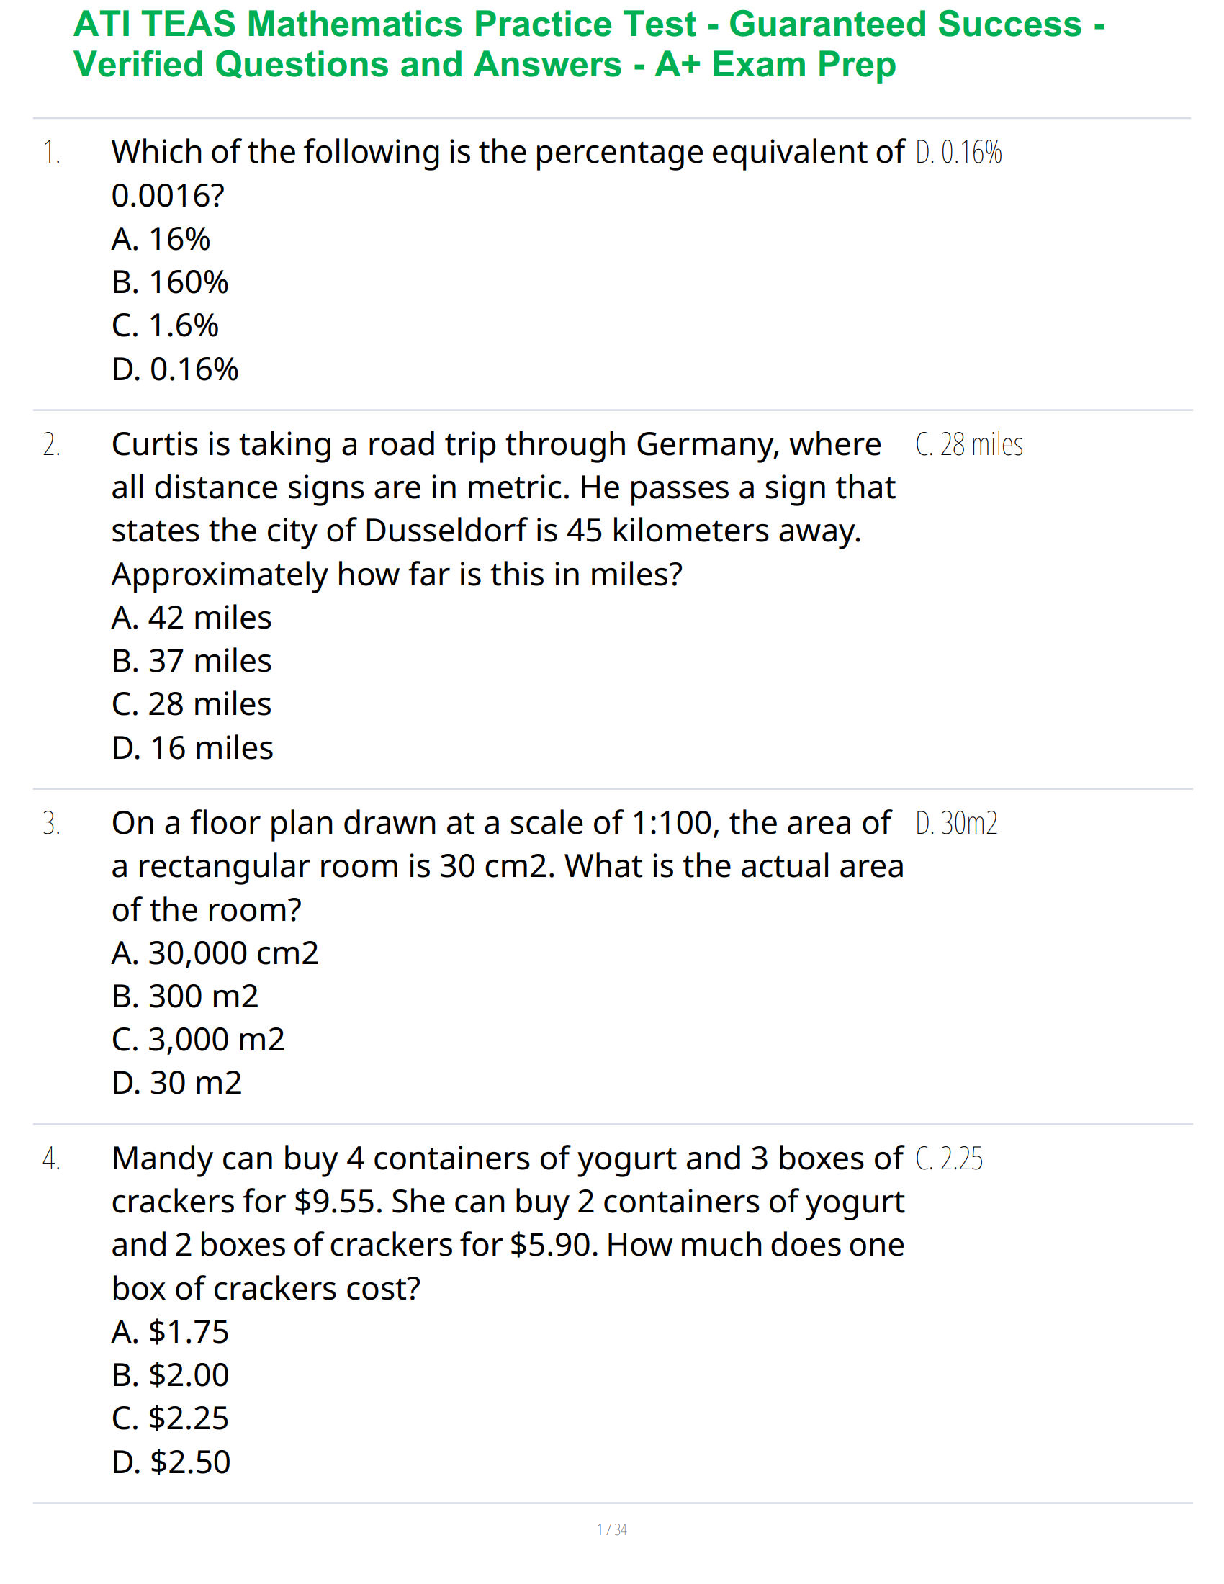
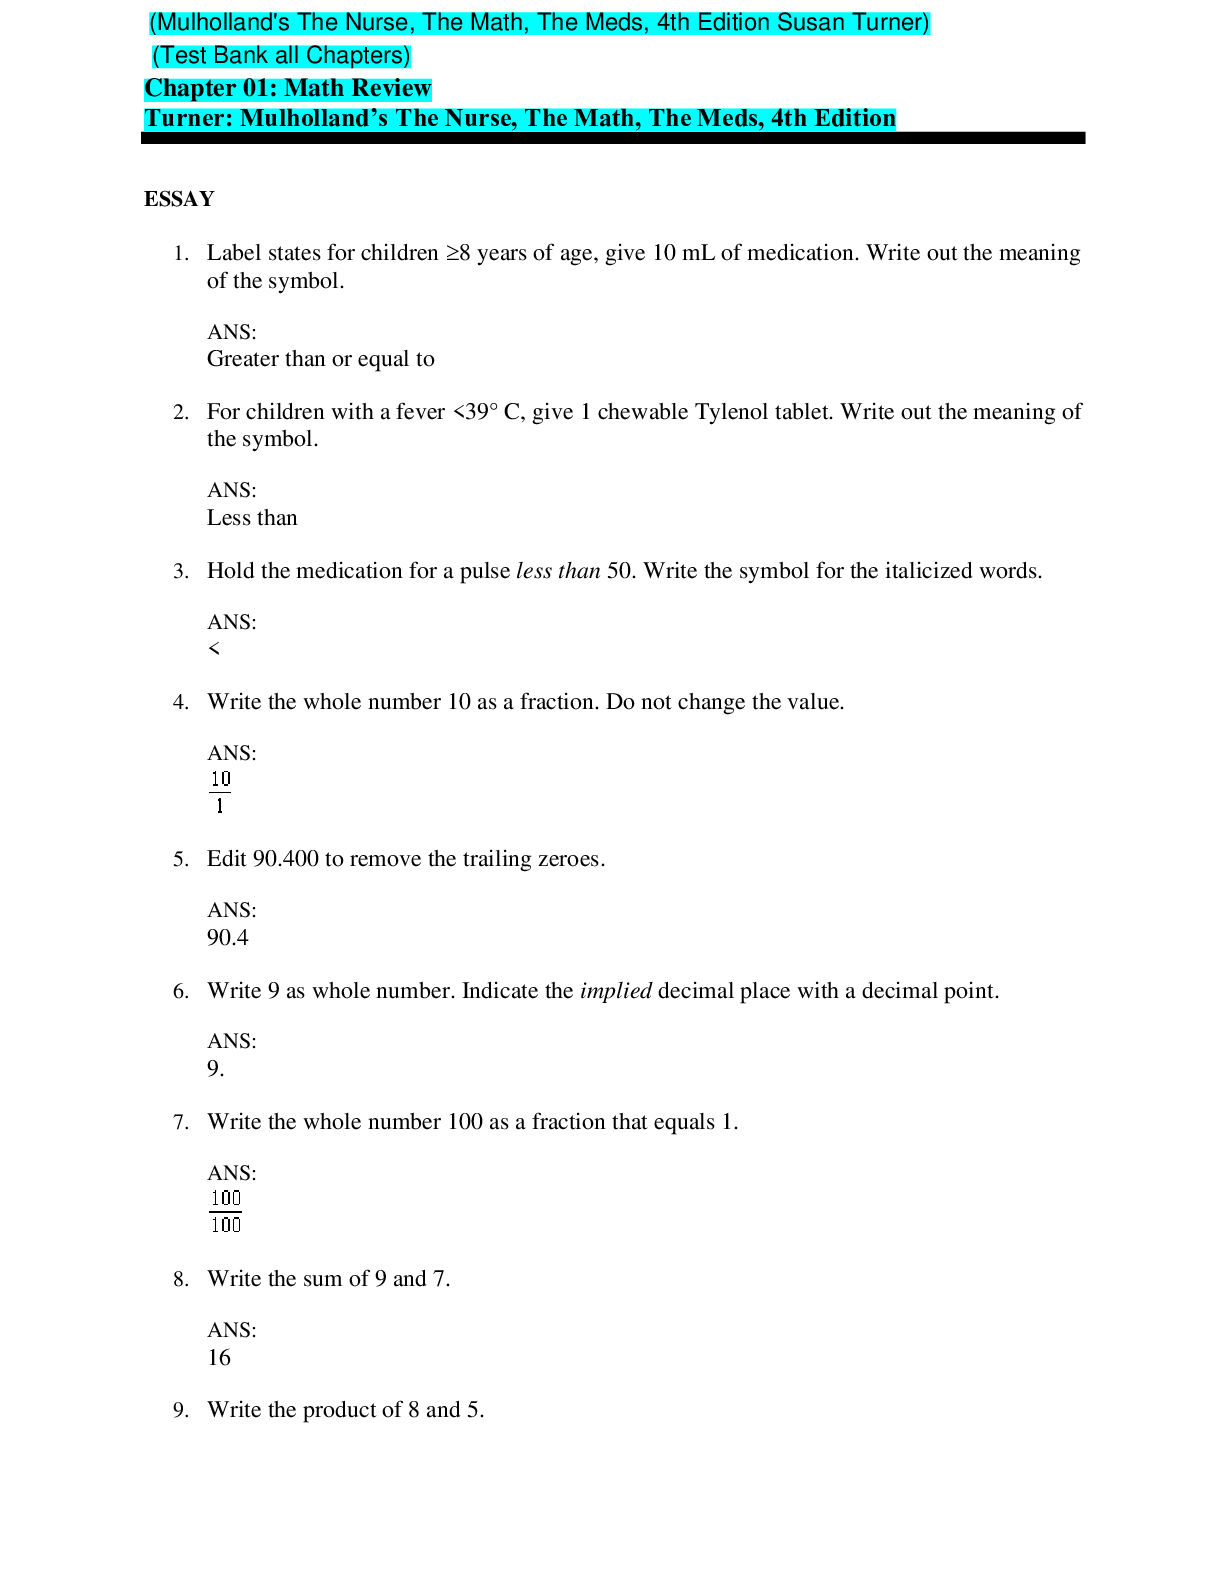
Mulholland's The Nurse, The Math, The Meds 4th Edition By Susa...
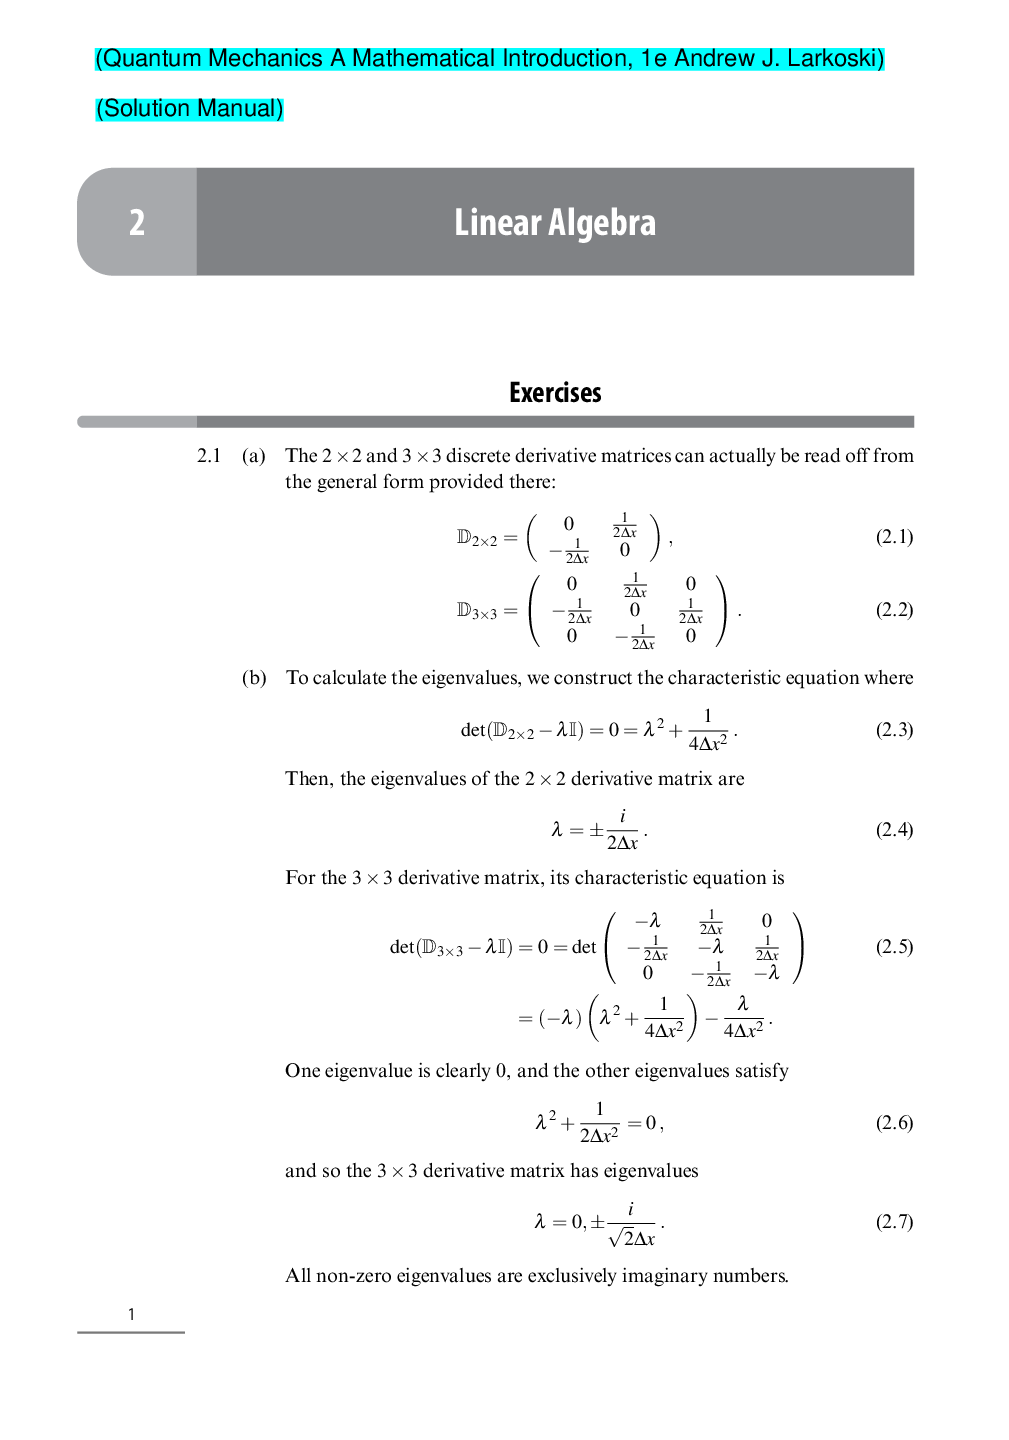
Solutions Manual for Quantum Mechanics A Mathematical Introduc...
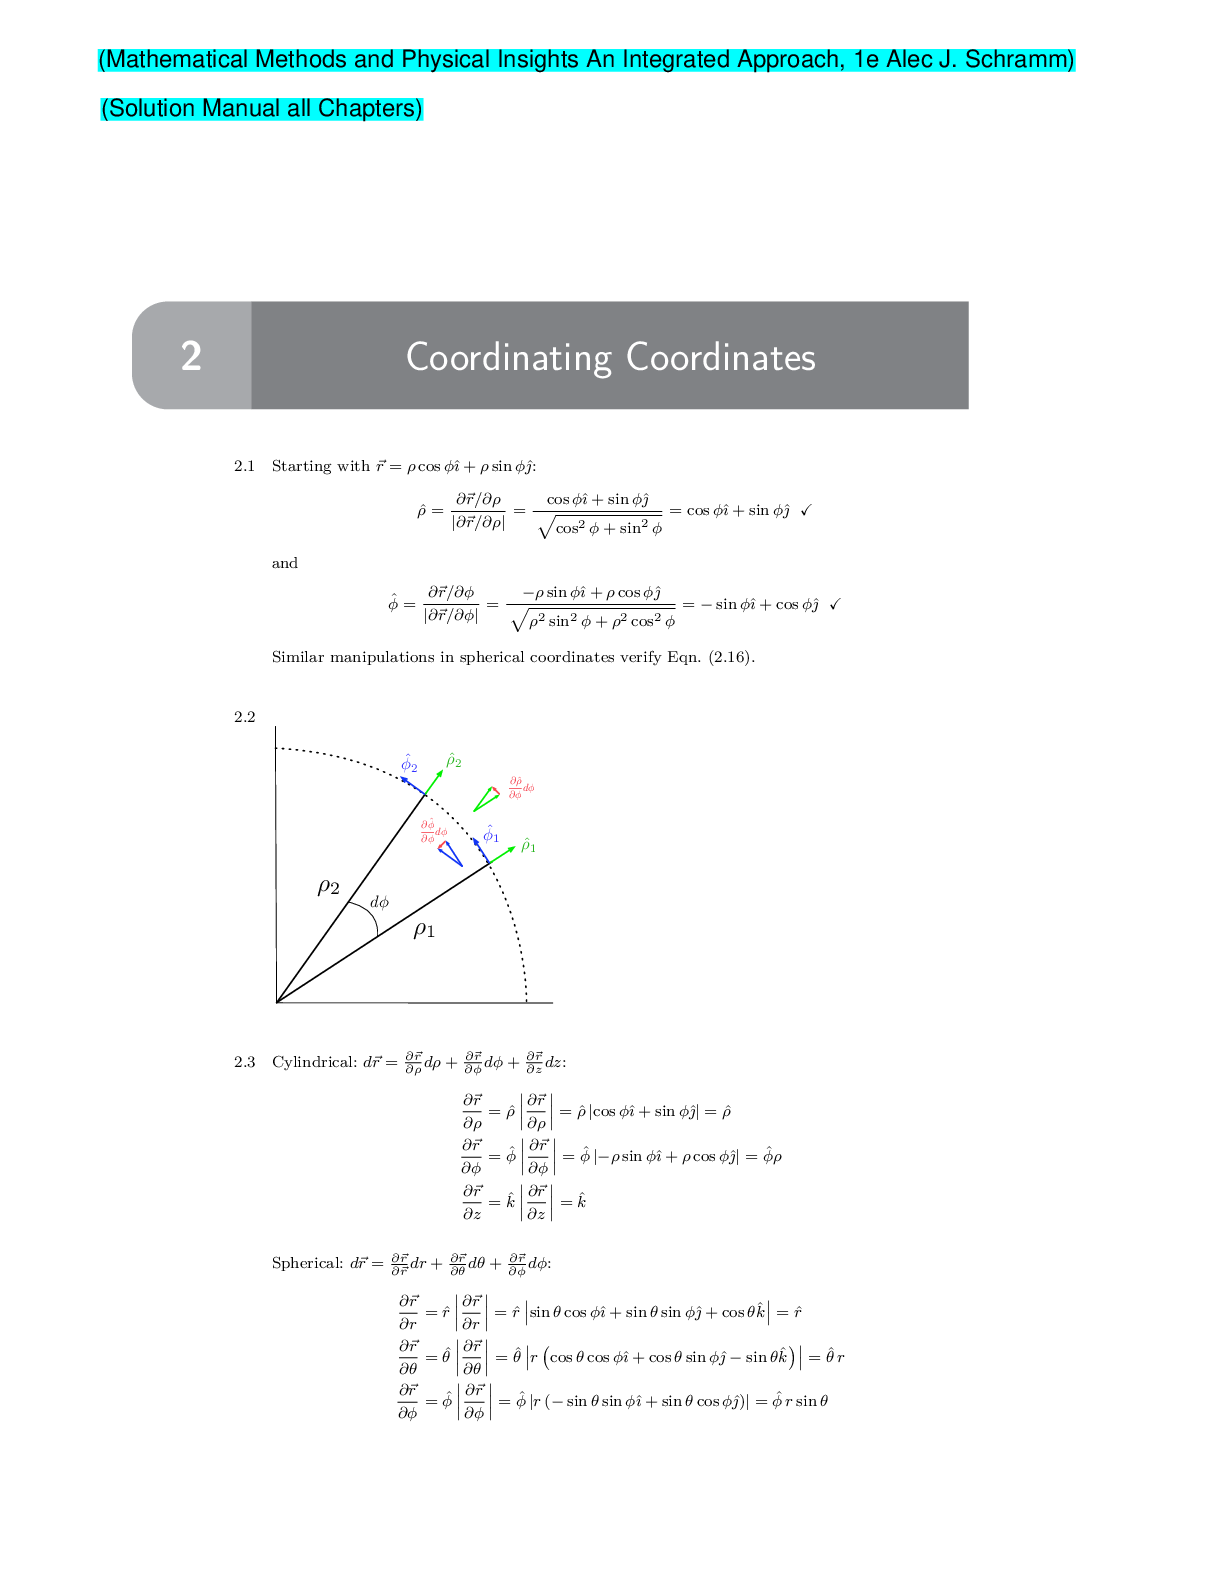
Solutions Manual for Mathematical Methods and Physical Insight...
Solutions Manual Connecting Discrete Mathematics and Computer...
Introduction to Number Theory 2nd Edition By Anthony Vazzana (...
Solutions Manual for Linear Algebra and Its Applications 6th E...
Introduction to Algorithms, 3e Thomas Cormen, Charles Leisers...

Introduction to Abstract Algebra, 2e Jonathan D. H. Smith (Sol...
Solutions Manual for A Student's Guide to the Navier–Stokes Eq...
Complete Pure Mathematics for Cambridge AS and A Level 2 & 3 2...
Cambridge International AS & A Level Mathematics Pure Mathemat...
Cambridge International AS & A Level Mathematics Mechanics Wor...
Cambridge International AS & A Level Further Mathematics Worke...
Gray Morris's Calculate with Confidence 2nd Edition (Canadian...
A First Course in Differential Equations with Modeling Applica...
A First Course in Differential Equations with Modeling Applica...
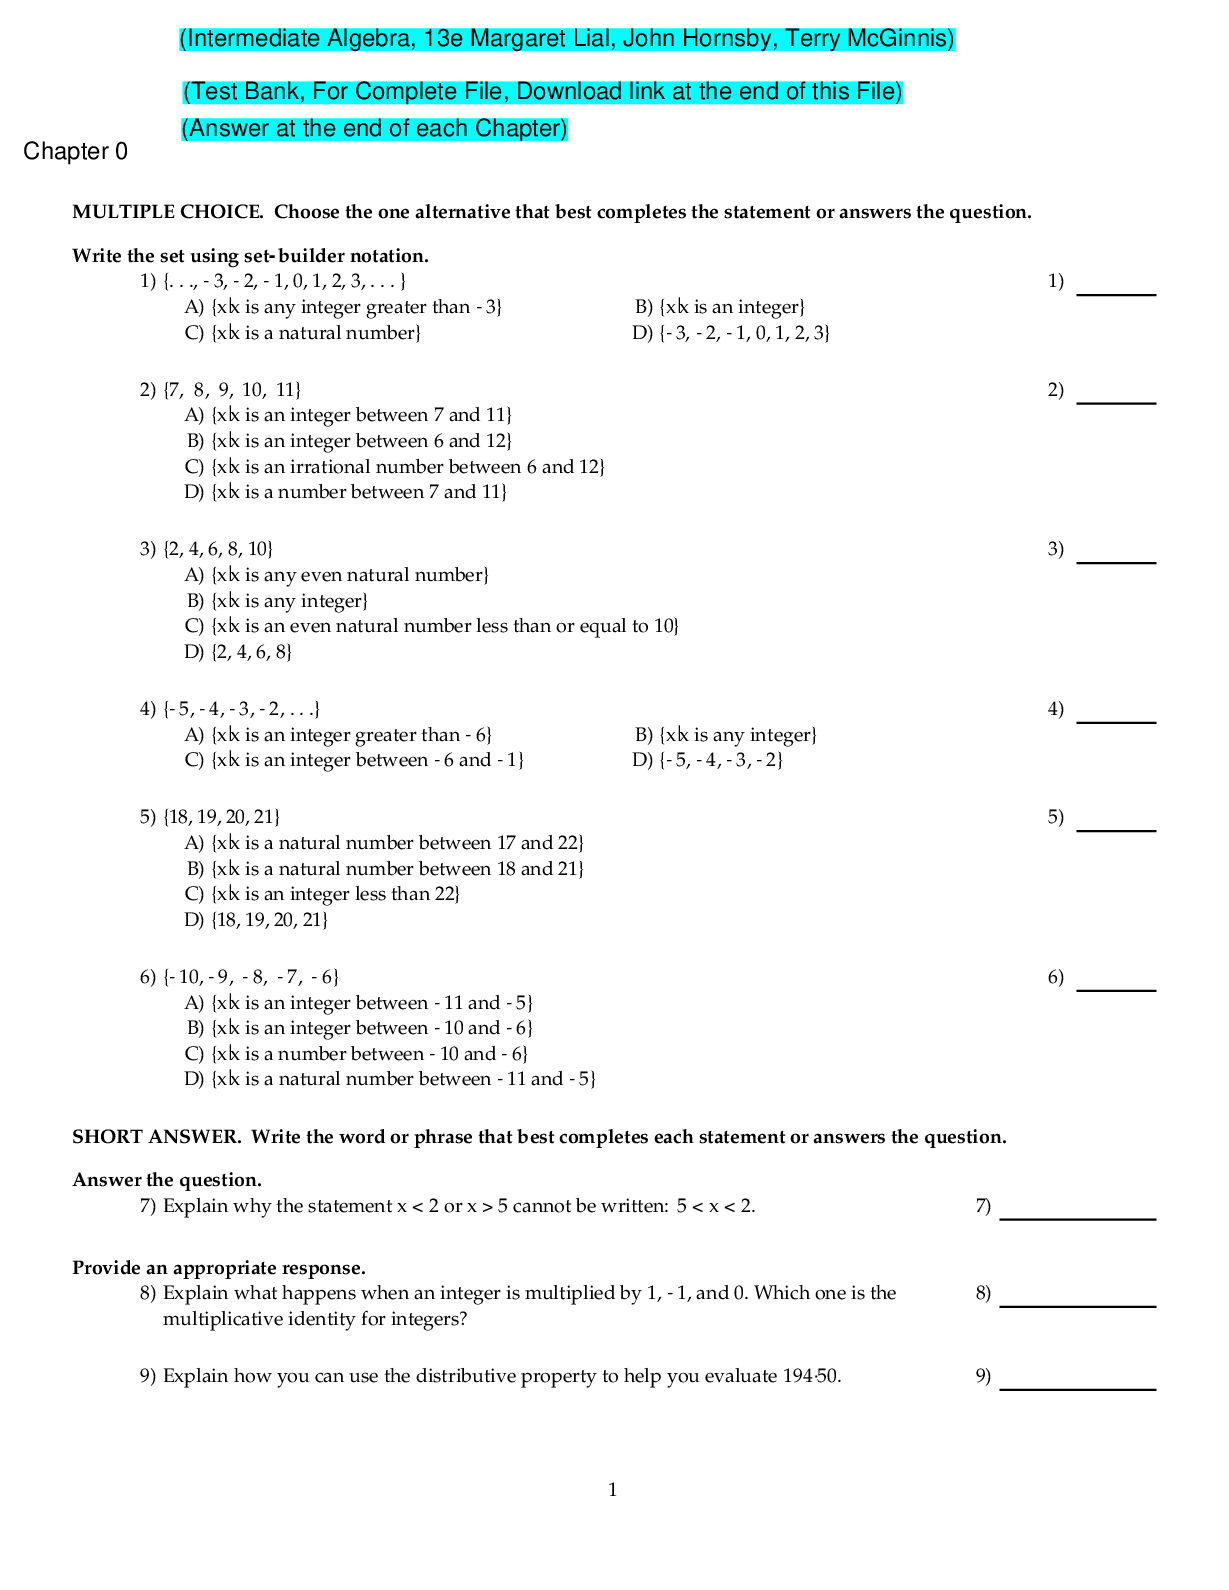
Intermediate Algebra, 13e Margaret Lial, John Hornsby, Terry M...
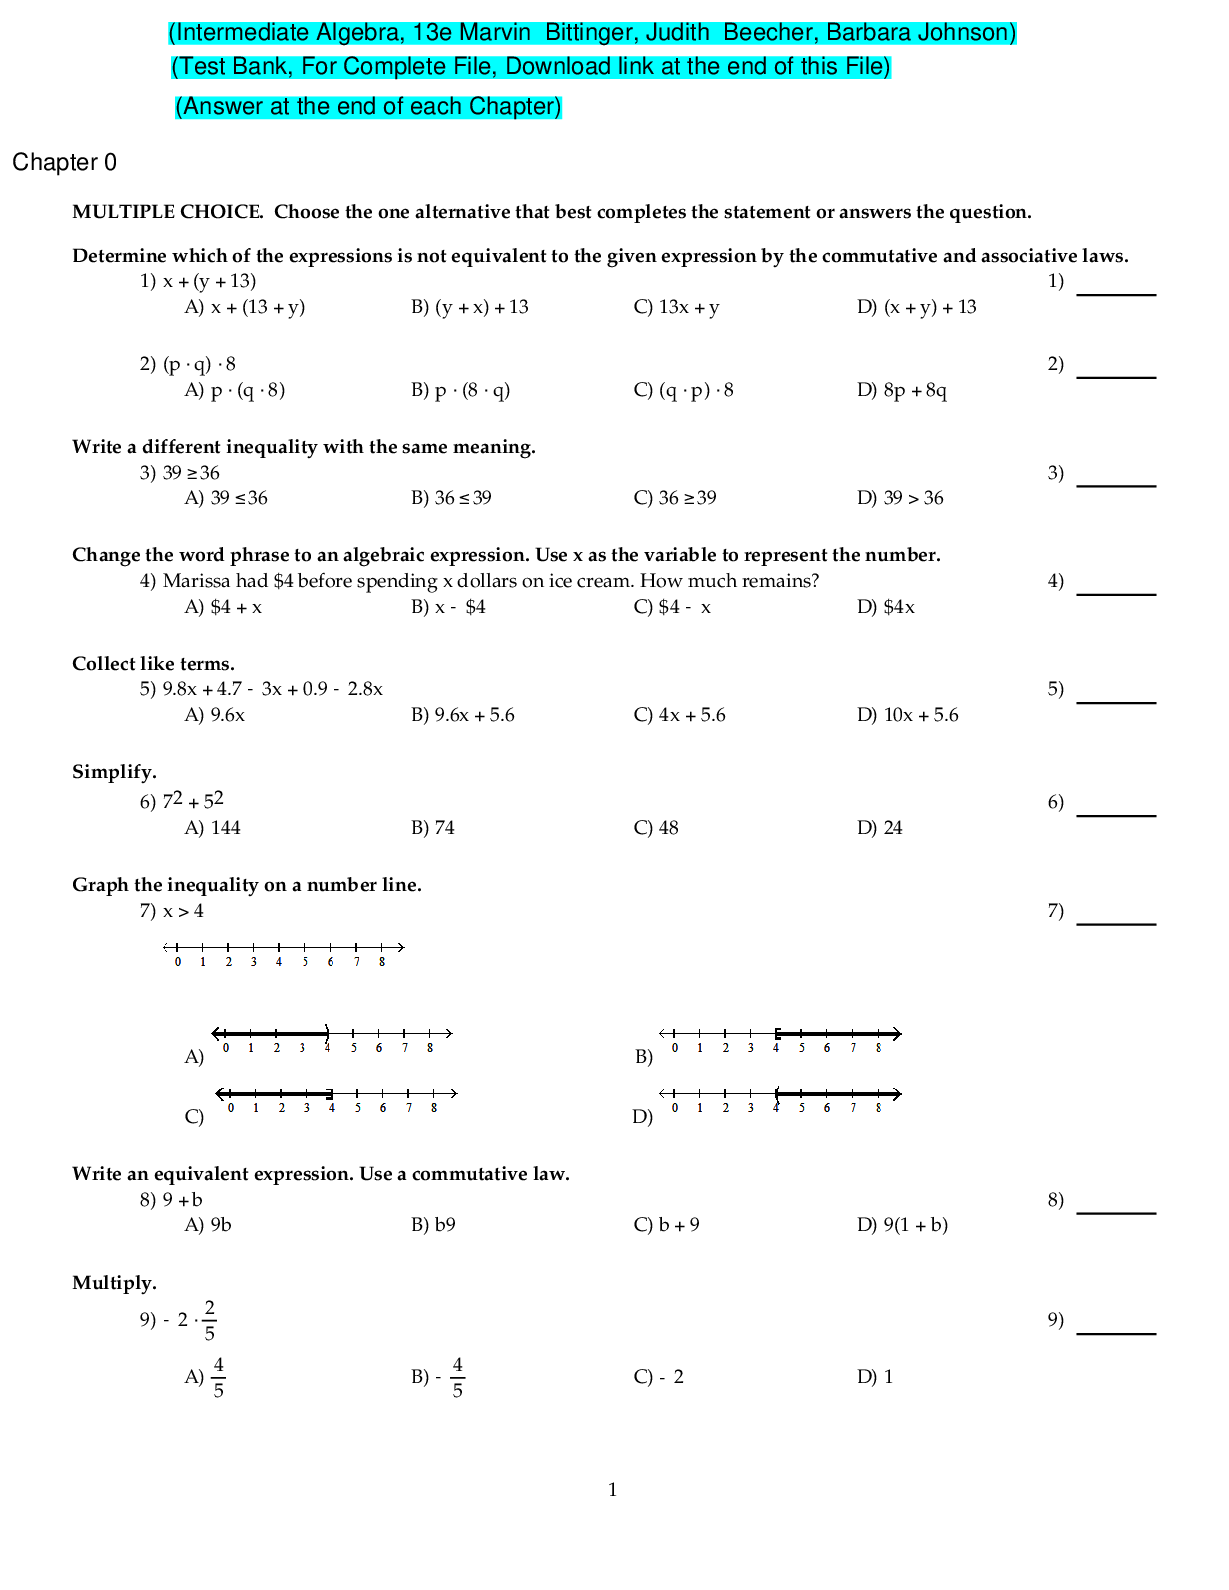
Intermediate Algebra, 13e Marvin Bittinger, Judith Beecher,...