Mathematics > Summary > Summary MATH 225N Week 7 Lab Assignment (Summer 2022/2023) Complete solution guide - Chamberlain. (All)
Summary MATH 225N Week 7 Lab Assignment (Summer 2022/2023) Complete solution guide - Chamberlain.
Document Content and Description Below
Last updated: 3 years ago
Preview 1 out of 5 pages
Instant download

Buy this Document to get the Full Access Instantly
Provided by Students Who Aced it
We Verify Document Content to Gurantee Accuracy
Reviews( 0 )
Document information
Connected school, study & course
About the document
Uploaded On
Jan 20, 2023
Number of pages
5
Written in
All

Additional information
This document has been written for:
Uploaded
Jan 20, 2023
Downloads
0
Views
197
Document Keyword Tags
Recommended For You
Get more on Summary »
MATH 225 WEEK 8 FINAL EXAM (4 VERSIONS)/ MATH 225N WEEK 8 FINA...


MATH 225N Week 4 Statistics Quiz Solutions: Fall 2020/2021 - A...

MATH 225N / MATH225N MATH Statistic Week 7 Hypothesis Testing...
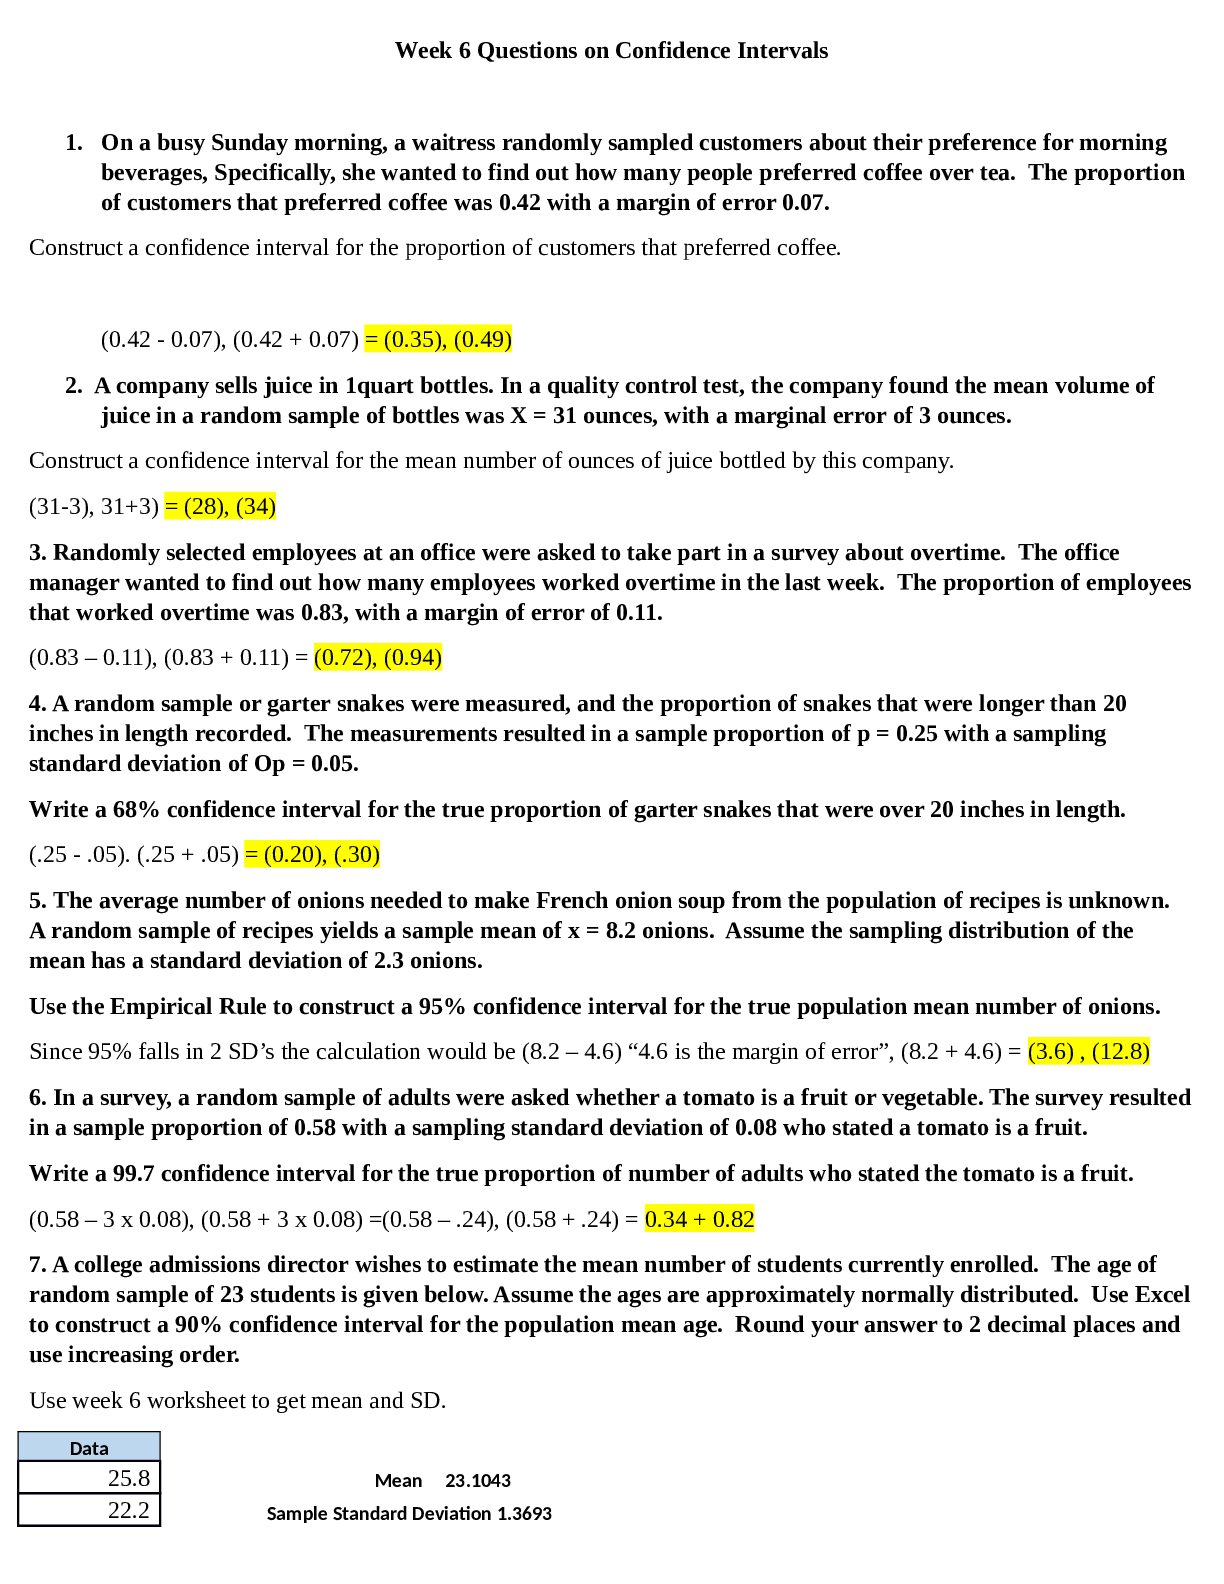
MATH 225N WEEK 6 QUESTIONS ON CONFIDENCE INTERVALS(GRADED A):C...

MATH 225N Final Exam 2 - Question and Answers 2020/2021

MATH 225N Week 3 Lab Assignment: Article on Concussion|Latest...
MATH 225N STATISTIC FINAL - CHAMBERLAIN COLLEGE OF NURSING

MATH 225N Week 3 Lab Assignment: Frequency Distribution – Neon...
MATH 225N Week 3 Lab Assignment: Adolescents First Tobacco Pro...
Chamberlain College of NursingMATH 225N MATHStatistic Final

Chamberlain College of NursingMATH 225N MATHWeek 7 Assignment...
Discrete Mathematics and Its Applications 8th Edition by Kenne...
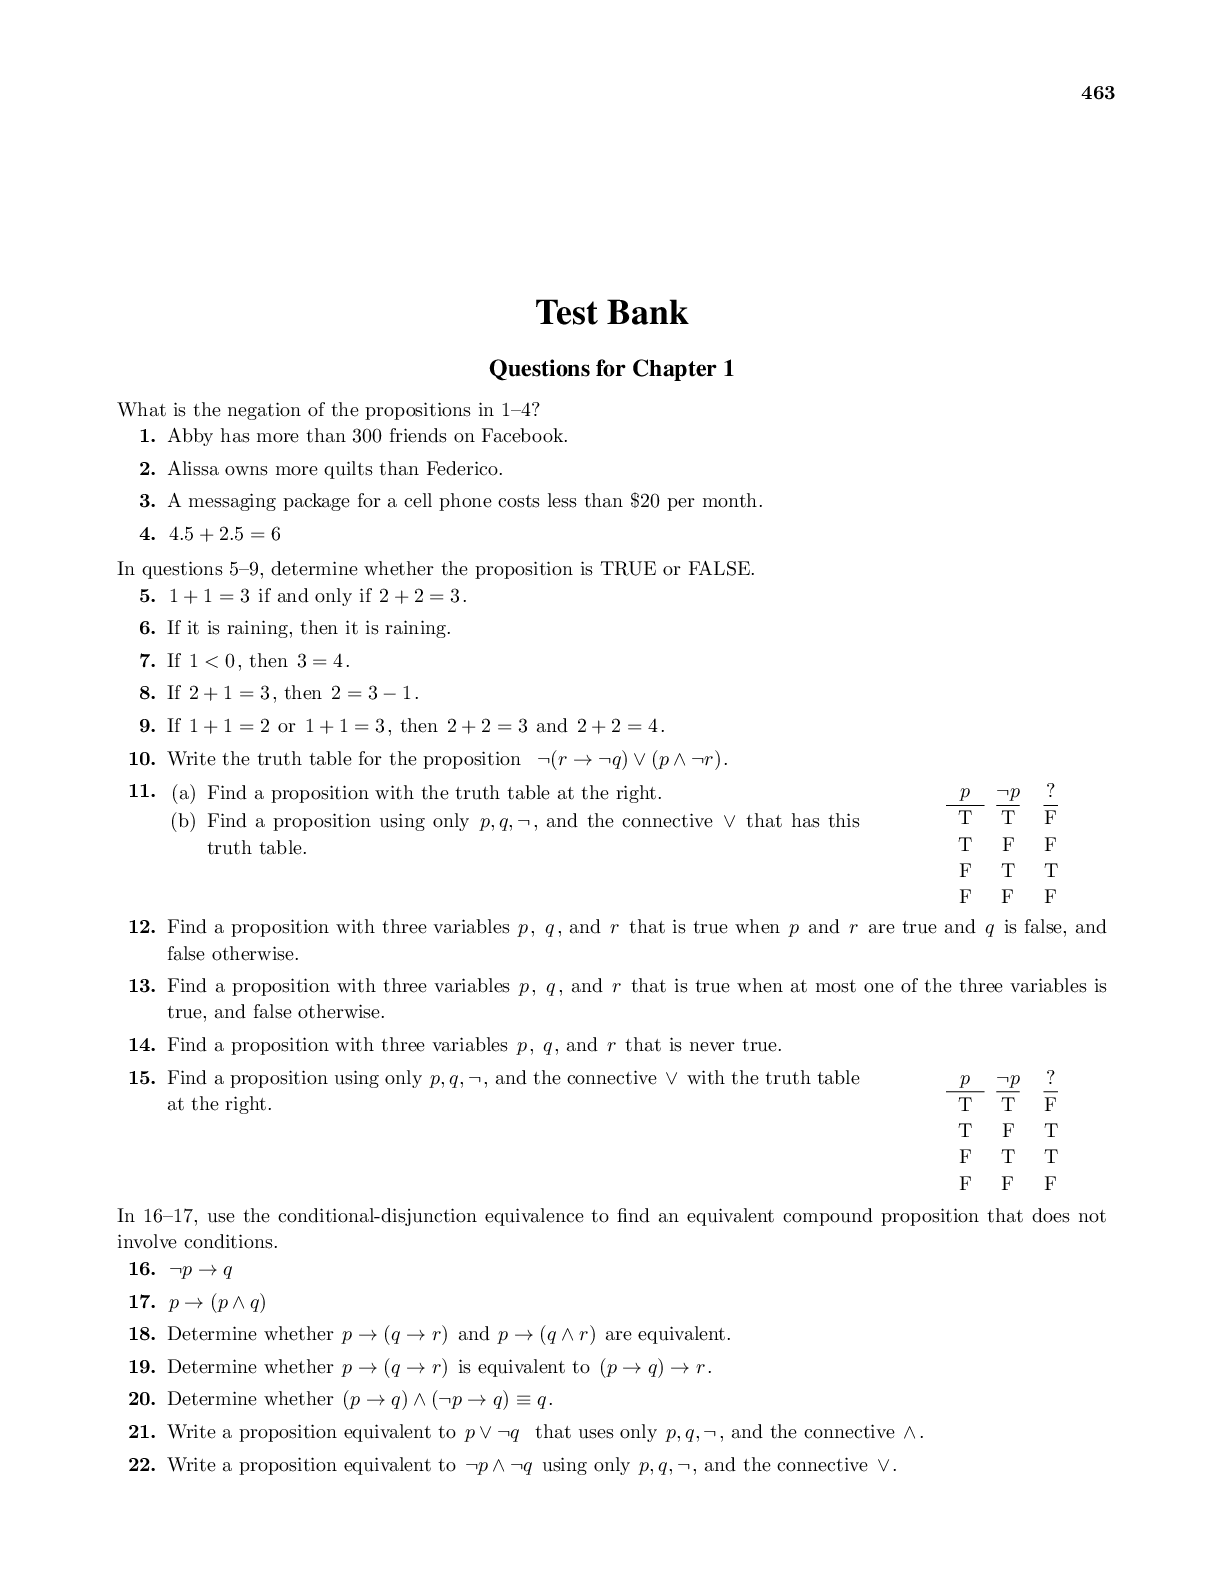
Finite Mathematics & Its Applications, 13e Larry Goldstein, Da...
.png)
 2e Peter Olver, Chehrzad Shakiban.png)
Applied Linear Algebra (Undergraduate Texts in Mathematics) 2n...