AQA > As Level Question Papers > AQA GCSE STATISTICS Higher Tier RATINGP Paper 1 MAY 2023 (All)
AQA GCSE STATISTICS Higher Tier RATINGP Paper 1 MAY 2023
Document Content and Description Below
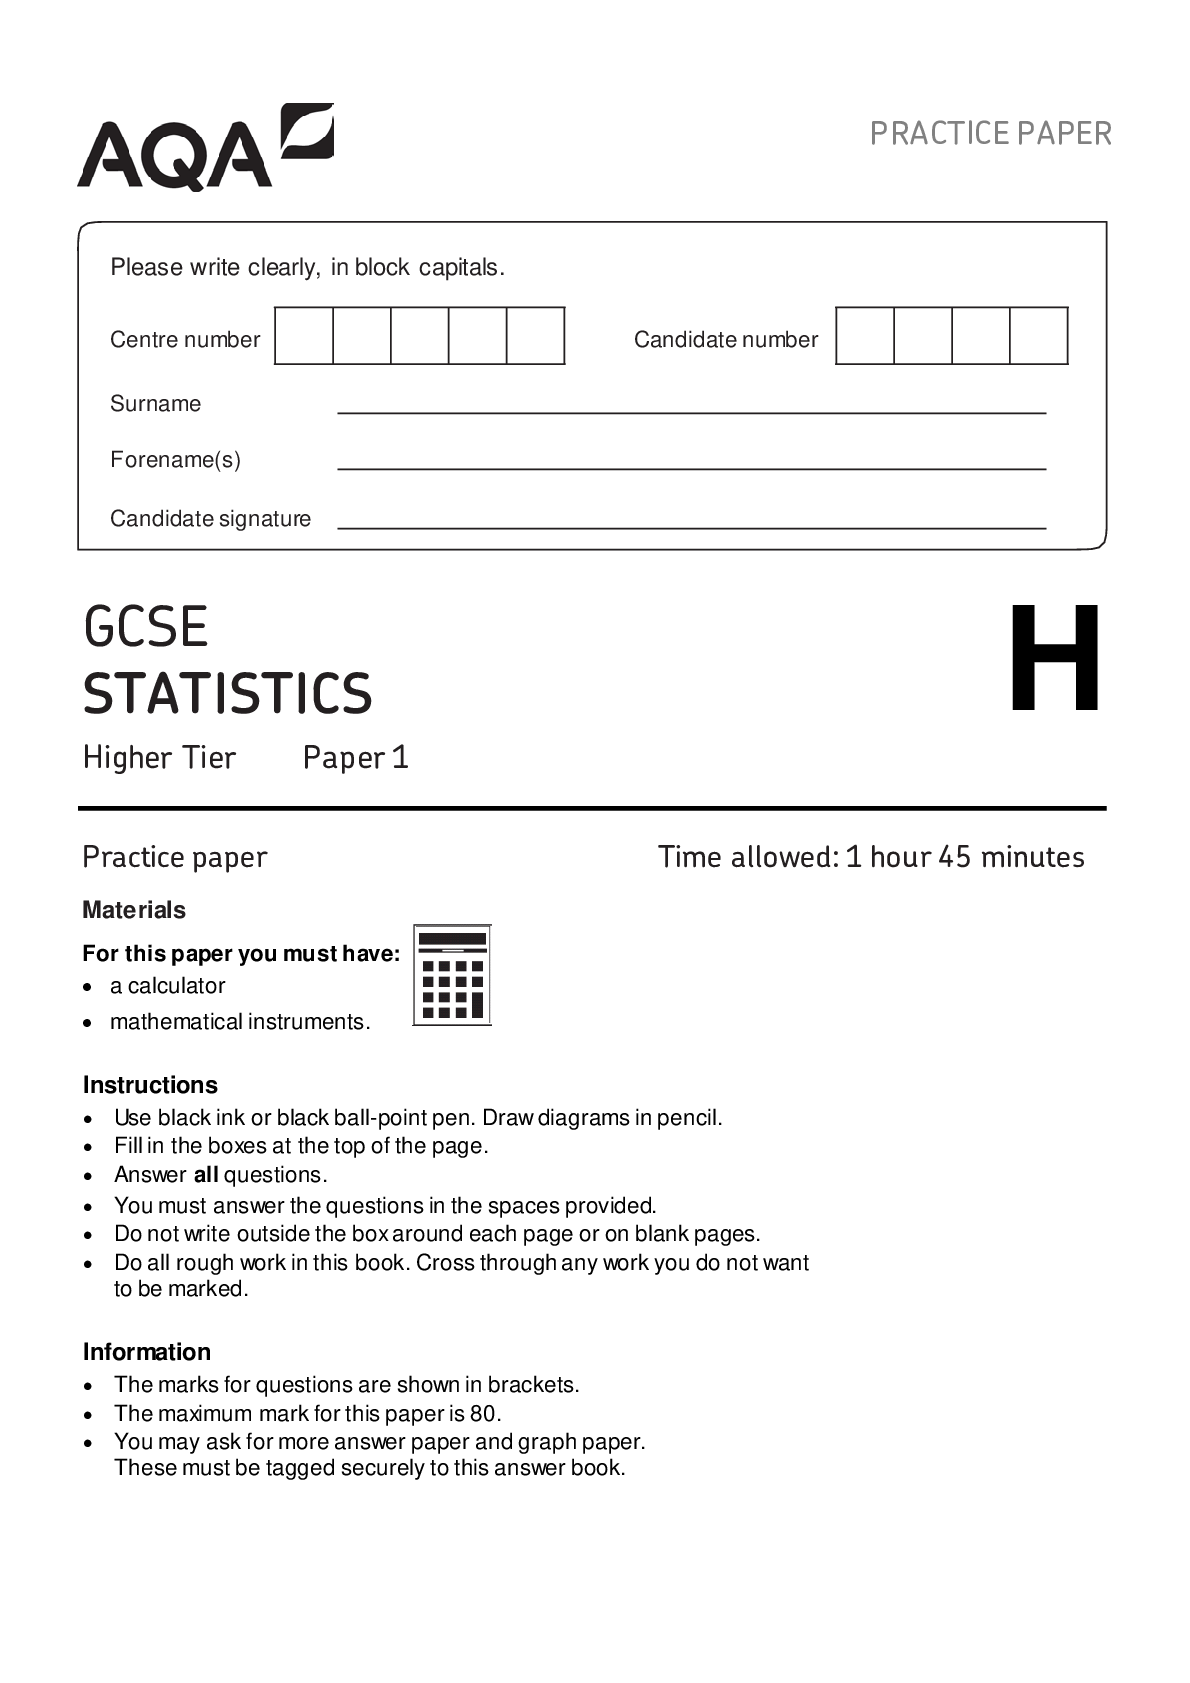
GCSE STATISTICS Higher Tier Paper 1 Practice paper Time allowed: 1 hour 45 minutes Materials Instructions • Use black ink or black ball-point pen. Draw diagrams in pencil. • Fill in the bo ... xes at the top of the page. • Answer all questions. • You must answer the questions in the spaces provided. • Do not write outside the box around each page or on blank pages. • Do all rough work in this book. Cross through any work you do not want to be marked. Information • The marks for questions are shown in brackets. • The maximum mark for this paper is 80. • You may ask for more answer paper and graph paper. These must be tagged securely to this answer book. For this paper you must have: • a calculator • mathematical instruments. PRACTICE PAPER Please write clearly, in block capitals. Centre number Candidate number Surname Forename(s) Candidate signature H 2 Do not write outside the Answer box all questions in the spaces provided. 1 Here is part of an ordinal scale on a questionnaire. Strongly disagree Disagree X Agree Strongly agree What should the heading marked Xbe? Circle your answer. [1 mark] Slightly agree Slightly disagree Don’t know Neutral 2 A scatter graph shows the marks of students in their Maths (x) and English (y) exams. The equation of the line of best fit is y = 0.75x + 24. The mean mark for the students in Maths is 60. Circle the mean mark for students in English. [1 mark] 24 48 60 69 8382/1H 3 Do not write outside the 3 The Venn diagram shows information about the 500 students who study either full box -time or part-time at a college. In the diagram: F represents the students who study full-time A represents the students who study agriculture How many students study agriculture part-time? Circle your answer. [1 mark] 47 113 132 179 4 Alexa wants to estimate the proportion of voters who support a certain candidate in an election. She takes a random sample of n voters. She finds that the number of voters in this sample who support the candidate is x. If the size of the population is N, what is the best estimate for the proportion of voters in the population who support the candidate? Circle your answer. [1 mark] xN n x N x n xN Turn over for the next question Practice paper Version 1.0 Turn over 4 Do not write outside the 5 box In Victorian times, people who were sick or who had no job or home were often forced to live in the local workhouse. The stem-and-leaf diagram shows the ages of the residents of a workhouse in 1881. Females Males 9 7 6 5 5 4 3 0 2 2 4 5 6 6 6 8 8 8 9 9 4 3 2 2 1 1 1 1 1 0 1 1 2 2 2 3 4 4 4 6 3 2 2 5 8 8 7 5 4 1 1 0 3 5 5 3 0 4 8 9 2 2 5 1 4 6 8 4 4 3 0 6 0 2 5 7 5 0 0 7 0 0 3 4 5 5 9 9 6 8 5 6 0 9 Key: 0 | 3 | 5 represents a female aged 30 years and a male aged 35 years [Source: 1881 census] 5 (a) Residents aged up to the age of 15 years were classed as children. How many children lived at the workhouse? [2 marks] Answer 8382/1H 5 Do not write outside the 5 (b) James was a resident at the workhouse in 1881. box 11 residents in the workhouse were older than him. Write down the age of James. [1 mark] Answer 5 (c) Make two comments about the ages of the males living in the workhouse. [2 marks] Comment 1 Comment 2 Practice paper Version 1.0 Turn over 6 Do not write outside the 6 Tate Liverpool is an art gallery. box The table shows index numbers for the number of visitors to Tate Liverpool between 2012 and 2016 (base year = 2012). Year 2012 2013 2014 2015 2016 Index number Base year = 2012 100 95.0 91.7 102.4 104.4 [Source: Museums and galleries monthly visits, Department for Digital, Culture, Media and Sport] 6 (a) In which year were visitor numbers at their lowest? [1 mark] Answer 6 (b) The number of visitors to Tate Liverpool in 2013 was 581 329. Calculate the number of visitors in 2015. [2 marks] Answer 8382/1H 7 Do not write outside the 6 box (c) The total number of visitors to museums and art galleries in England increased by 2.2% between 2012 and 2016. Compare how the number of visitors to Tate Liverpool has changed in comparison with the overall figure for museums and art galleries in England. Explain your answer. [2 marks] Turn over for the next question Practice paper Version 1.0 Turn over 8 Do not write outside the 7 box In 2016, voters in the UK voted on whether to leave the European Union (EU). The table shows the results for some of the regions of the UK and the total number of votes of people who voted to remain in the EU. The final column shows the % of those who could vote who did vote. [Source : w ww.electoralcommission.org.uk] 7 (a) Which of the five given regions voted that the UK should leave the EU? [1 mark] Answer Region Votes to remain in the EU Votes to leave the EU % who voted East 1 448 616 1 880 367 75.7 London 2 263 519 1 513 232 69.7 Scotland 1 661 191 1 018 322 67.2 North-West 1 699 020 1 966 925 70.0 Wales 772 347 854 572 71.7 Full UK result 16 141 241 72.2 8382/1H 9 Do not write outside the 7 box (b) There were 46 500 001 people who could have voted in the UK. 72.2% of these people did vote. Calculate the number of people who voted to leave the EU (the empty cell in the table). [4 marks] 7 (c) Why is your answer to part (b) unlikely to be exactly right? [1 mark] 7 (d) Sadiq said, “People were more likely to vote to leave the EU in regions where the percentage voting was higher.” Using the data from the table only, comment on Sadiq’s statement. [2 marks] Practice paper Version 1.0 [Show More]
Last updated: 2 years ago
Preview 1 out of 28 pages
Buy this document to get the full access instantly
Instant Download Access after purchase
Buy NowInstant download
We Accept:

Reviews( 0 )
$14.00
Can't find what you want? Try our AI powered Search
Document information
Connected school, study & course
About the document
Uploaded On
Jun 15, 2023
Number of pages
28
Written in
All

Additional information
This document has been written for:
Uploaded
Jun 15, 2023
Downloads
0
Views
129