CHEM120 Week 4 Virtual Lab: Acids and Bases Part I and Part II
$ 10
OCR GCE AS LEVEL 2022 COMPUTER SCIENCE MARK SCHEME H046-2 PAPER 2-H046/02: Algorithms and problem solving
$ 13.5
Pearson Edexcel IAL in A Level Physics WPH14/01 Paper 01 Physics Further Mechanics, Fields and Particles. Mark Scheme (Results) January 2022
$ 4
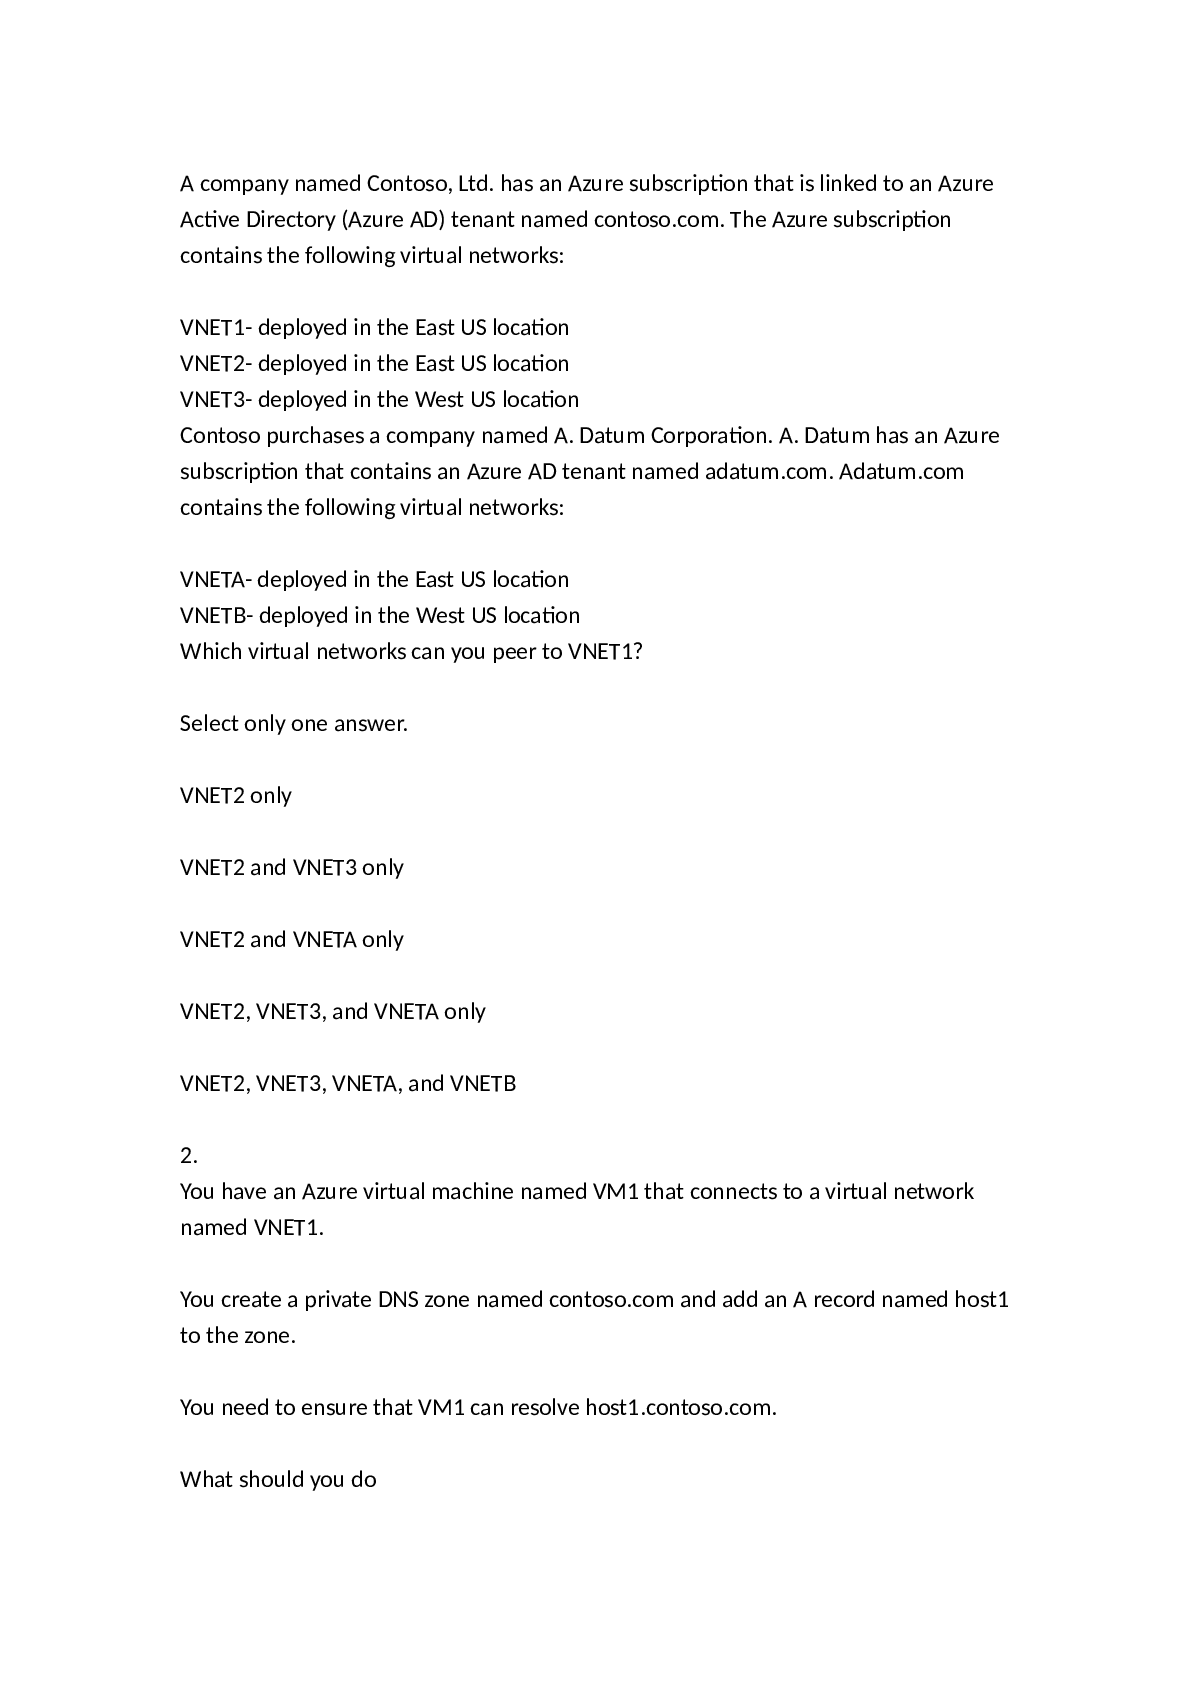
Azure Exam Latest. AZ 103. Document Contains 28 Questions and Answers
$ 9
HESI Anatomy & Physiology. Most examined questions with accuarate answers. Rated A+
$ 10
AP BIOPSYCHOLOGY PREP-TEST 2024-2025 QUESTIONS AND ANSWERS
$ 17
PMHNP Exam Reported Questions images, PMHNP 2022/2023 Graded A+
$ 25
.png)
WGU C100 Humanities FINAL Study Guide Questions and Answers Already Passed
$ 10
MGMT 404 Course Project: Getta Byte Software Project - Part 1 | Devry University 2020/2021