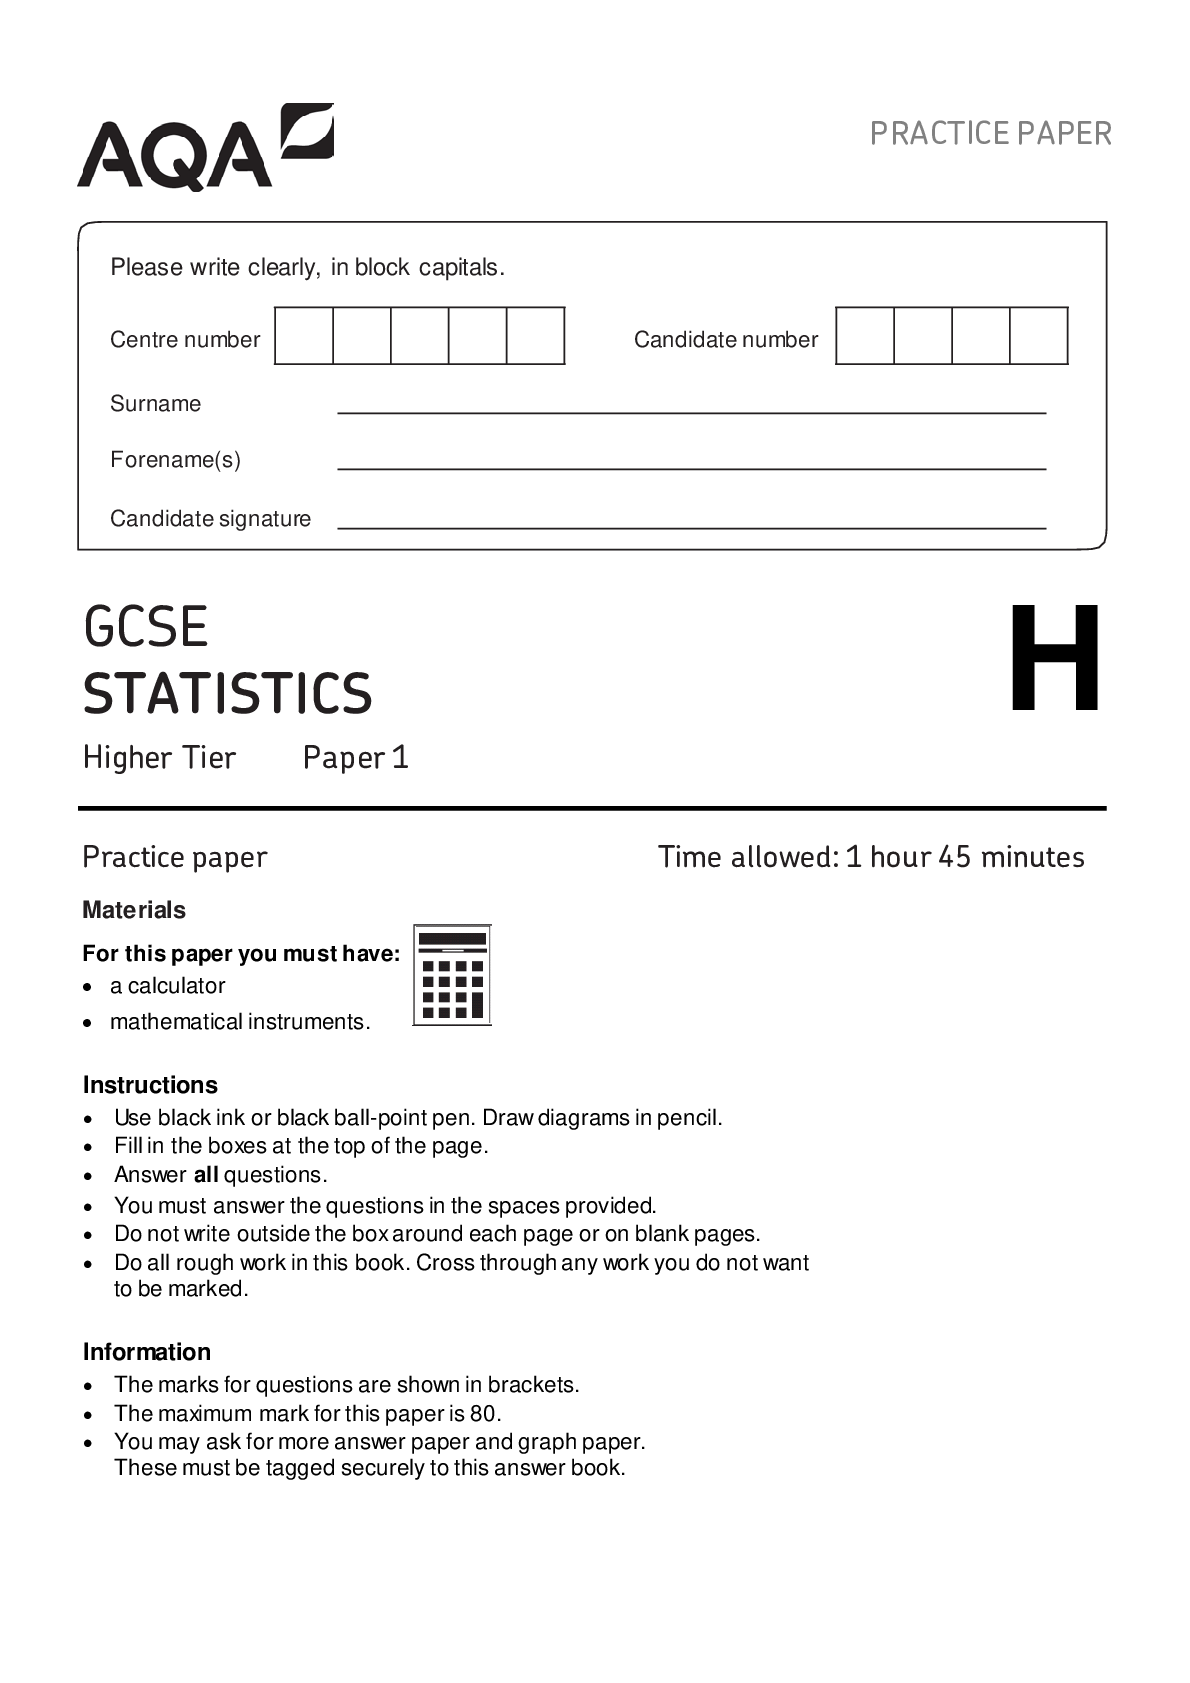
GCSE
STATISTICS
Foundation Tier Paper 1
Practice paper Time allowed: 1 hour 45 minutes
Materials
Instructions
• Use black ink or black ball-point pen. Draw diagrams in pencil.
• Fill in the boxes at the top of th
...
GCSE
STATISTICS
Foundation Tier Paper 1
Practice paper Time allowed: 1 hour 45 minutes
Materials
Instructions
• Use black ink or black ball-point pen. Draw diagrams in pencil.
• Fill in the boxes at the top of the page.
• Answer all questions.
• You must answer the questions in the spaces provided.
• Do not write outside the box around each page or on blank pages.
• Do all rough work in this book. Cross through any work you do not want
to be marked.
Information
• The marks for questions are shown in brackets.
• The maximum mark for this paper is 80.
• You may ask for more answer paper and graph paper.
These must be tagged securely to this answer book.
For this paper you must have:
• a calculator
• mathematical instruments.
PRACTICE PAPER
Please write clearly, in block capitals.
Centre number Candidate number
Surname
Forename(s)
Candidate signature
F
Version 1.0
2
Do not write
outside the
Answer box all questions in the spaces provided.
1 Sam sends 10 texts.
6 of them are to his brother.
What is the relative frequency of the number of texts to his brother?
Circle your answer.
[1 mark]
0.4 0.6 4 6
2 A company makes rocking horses.
The number of rocking horses sold between 2010 and 2017 is shown in the table.
Year Number of rocking horses sold
2010 33
2011 39
2012 32
2013 44
2014 46
2015 46
2016 50
2017 50
Work out the range of the number of rocking horses sold.
Circle your answer.
[1 mark]
7 17 18 45
8382/1F
3
Do not write
outside the
3 The Venn diagram below shows information about 500 students who study at a college. box
In the diagram
F represents the students who study full-time
A represents the students who study agriculture.
How many students study agriculture full-time?
Circle your answer.
[1 mark]
47 132 179 434
4 Which of these is not a possible solution to a poor response rate to a postal
questionnaire?
Tick one box.
[1 mark]
Offer a pre-paid envelope in which to return questionnaires
Send twice as many questionnaires out
Let recipients know that returned questionnaires will be
entered into a prize draw
Offer to collect the questionnaires by hand
Practice paper Version 1.0 Turn over
4
Do not write
outside the
5 Zak lives near an open-air venue where events are often held. box
He records whether it is quiet (Q), noisy (N) or very noisy (V) over 13 Saturdays in
June, July and August.
The results are
V Q V N Q N N V V V N Q N
5 (a) Complete the table below to summarise the data, giving the second and third columns a
suitable heading.
[4 marks]
Noise level
Q
N
V
5 (b) Give one advantage of your table over the raw data.
[1 mark]
8382/1F
5
Do not write
outside the
5 (c) Zak had to work all day from home on one of these Saturdays. box
What is the probability that it was quiet (Q)?
[2 marks]
Answer
Question 5 continues on the next page
Practice paper Version 1.0 Turn over
6
Do not write
outside the
5 box (d) The pie chart below shows the same information for 14 Saturdays in November,
December and January.
5 (d)(i) Calculate the number of these 14 Saturdays that were quiet (Q).
[3 marks]
Answer
8382/1F
7
Do not write
outside the
5 (d)(ii)Give one possible reason for the big differences in the two sets of data. box
[1 mark]
Turn over for the next question
Practice paper Version 1.0 Turn over
8
Do not write
outside the
6 A bus should arrive at the bus station at 9 am. box
Olive records the number of minutes early or late it is over a period of several weeks.
(Early is shown by negative numbers and late is shown by positive numbers.)
The results for the first 10 days are
3 –1 0 2 5 0 –2 39 2 2
6 (a) What is the mean time of arrival for the bus over these 10 days?
[3 marks]
Answer am
6 (b) Why is the mean not a very good measure of average with these data?
[1 m
[Show More]