MATHS DISCUSSION
Many variables in medicine follow a normal distribution where there are approximately an equal number of values below the mean as above the mean. Describe two variables that you work with that would p
...
MATHS DISCUSSION
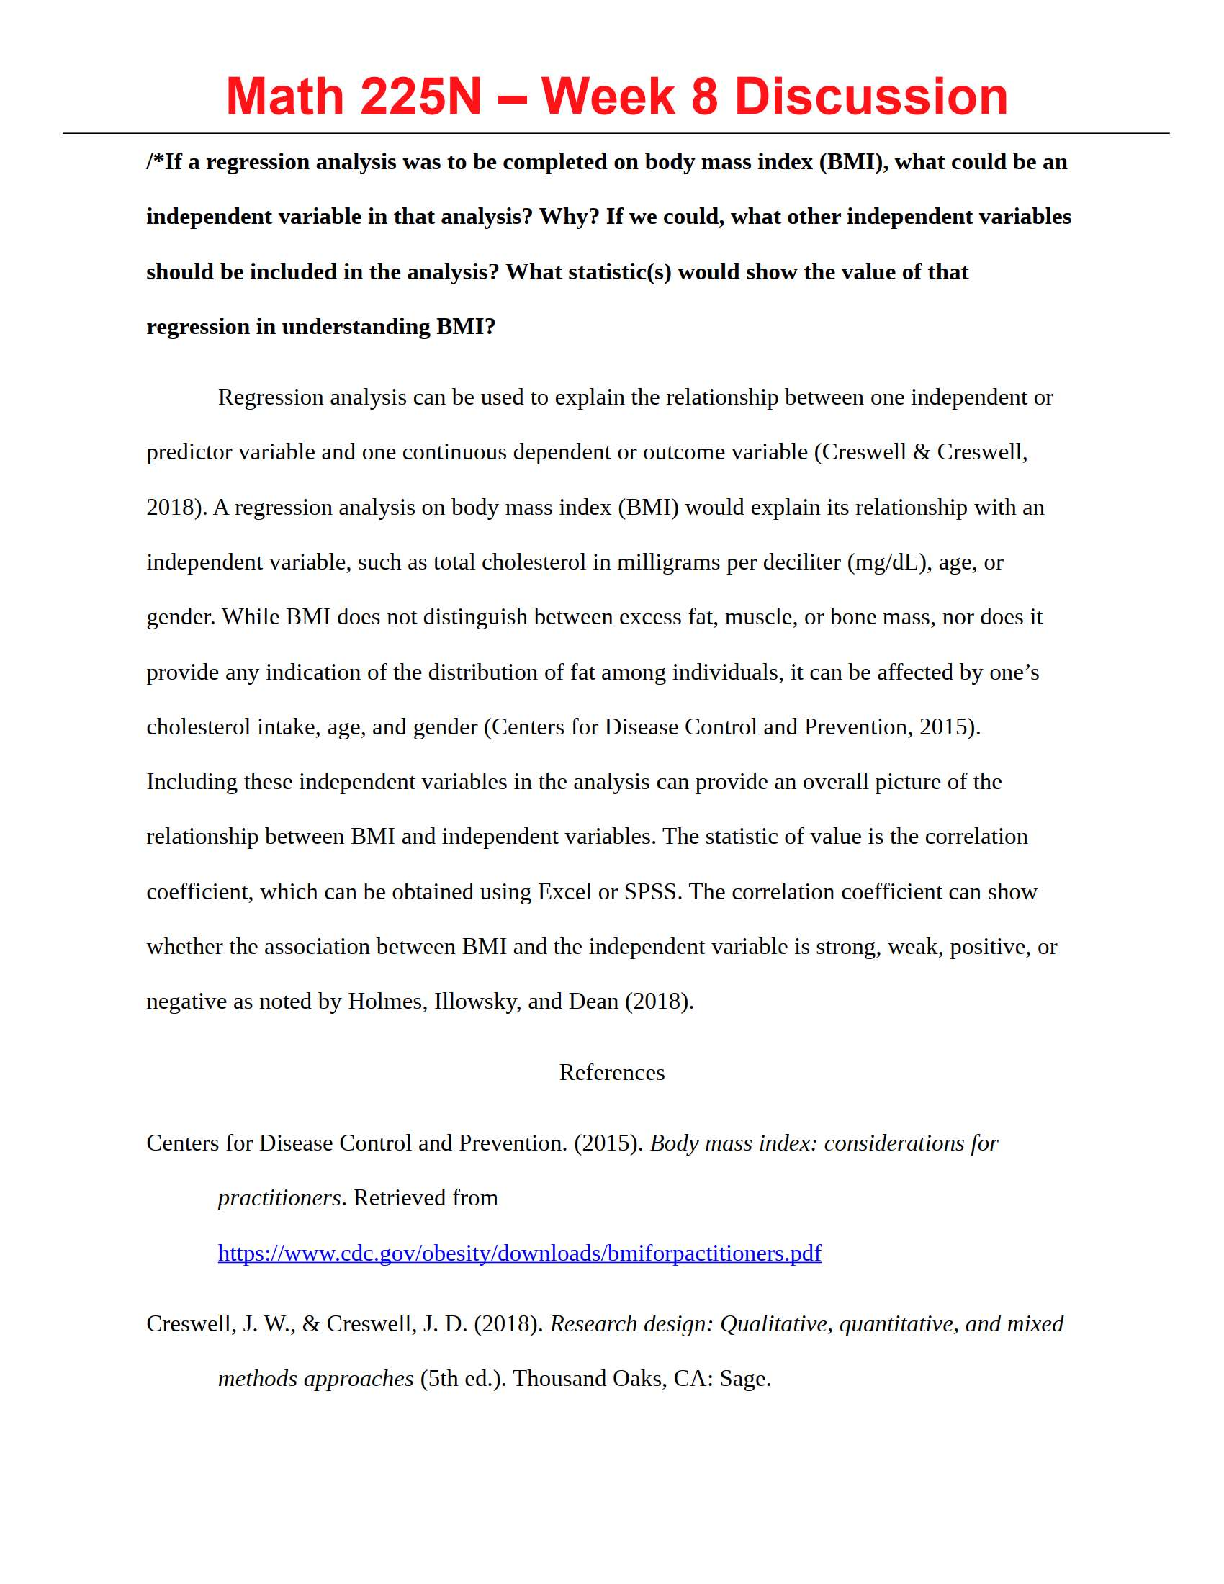
Many variables in medicine follow a normal distribution where there are approximately an equal number of values below the mean as above the mean. Describe two variables that you work with that would probably follow a normal distribution. Also note which of the two variables would be likely to have a larger standard deviation and why.
Statistical data is indispensable to physicians, and the knowledge of statistics is essential not only for research but also for understanding and interpreting information relevant to the practice of medical science (Holmes, Illowsky, & Dean, 2018; Sarkar, 2014). One of the elements of statistical data is normality, which is mainly characterized by a distribution that resembles a bell curve that is symmetrical. Half of the data will fall to the left of the mean; half will fall to the right. Two examples of variables that would have a normal distribution include systolic blood pressure and height. Systolic blood pressure readings are normally distributed, especially given that the mean and standard deviation are usually within the same range for a particular age group. For example, the systolic blood pressure of 18-year-old women is normally distributed, for instance, the mean is approximately 120 mmHg and standard deviation of 12 mmHg (Sarkar, 2014; Rivera et al., 2014). Height follows a normal distribution in the sense that most of the data values tend to cluster around the mean. However, systolic blood pressure would be likely to have a larger standard deviation because there are many factors that cause pressure to vary, such as health condition and lifestyle. Height remains fairly constant across age groups (Rivera et al., 2014).
References
Holmes, A., Illowsky, B. & Dean, S. (2018). Introductory business statistics. Houston, TX: OpenStax Rivera, A. L., Estanol, B., Senties-Madrid, H., Fossion, R., Toledo-Roy, J. C., Mendoza-Temis, J., ... &
Frank, A. (2016). Heart rate and systolic blood pressure variability in the time domain in patients with recent and long-standing diabetes mellitus. PloS one, 11(2), e0148378.
Sarkar, S. (2014). Understanding data for medical statistics. International Journal of Advanced Medical and Health Research, 1(1), 30.
[Show More]


.png)


.png)


