Biology > Lab Report > Using Bioinformatics to Investigate Evolutionary Relationships Greenbrier High School, Greenbrier - (All)
Using Bioinformatics to Investigate Evolutionary Relationships Greenbrier High School, Greenbrier - BIO MISCAP Lab 3 - BLAST Part 2
Document Content and Description Below
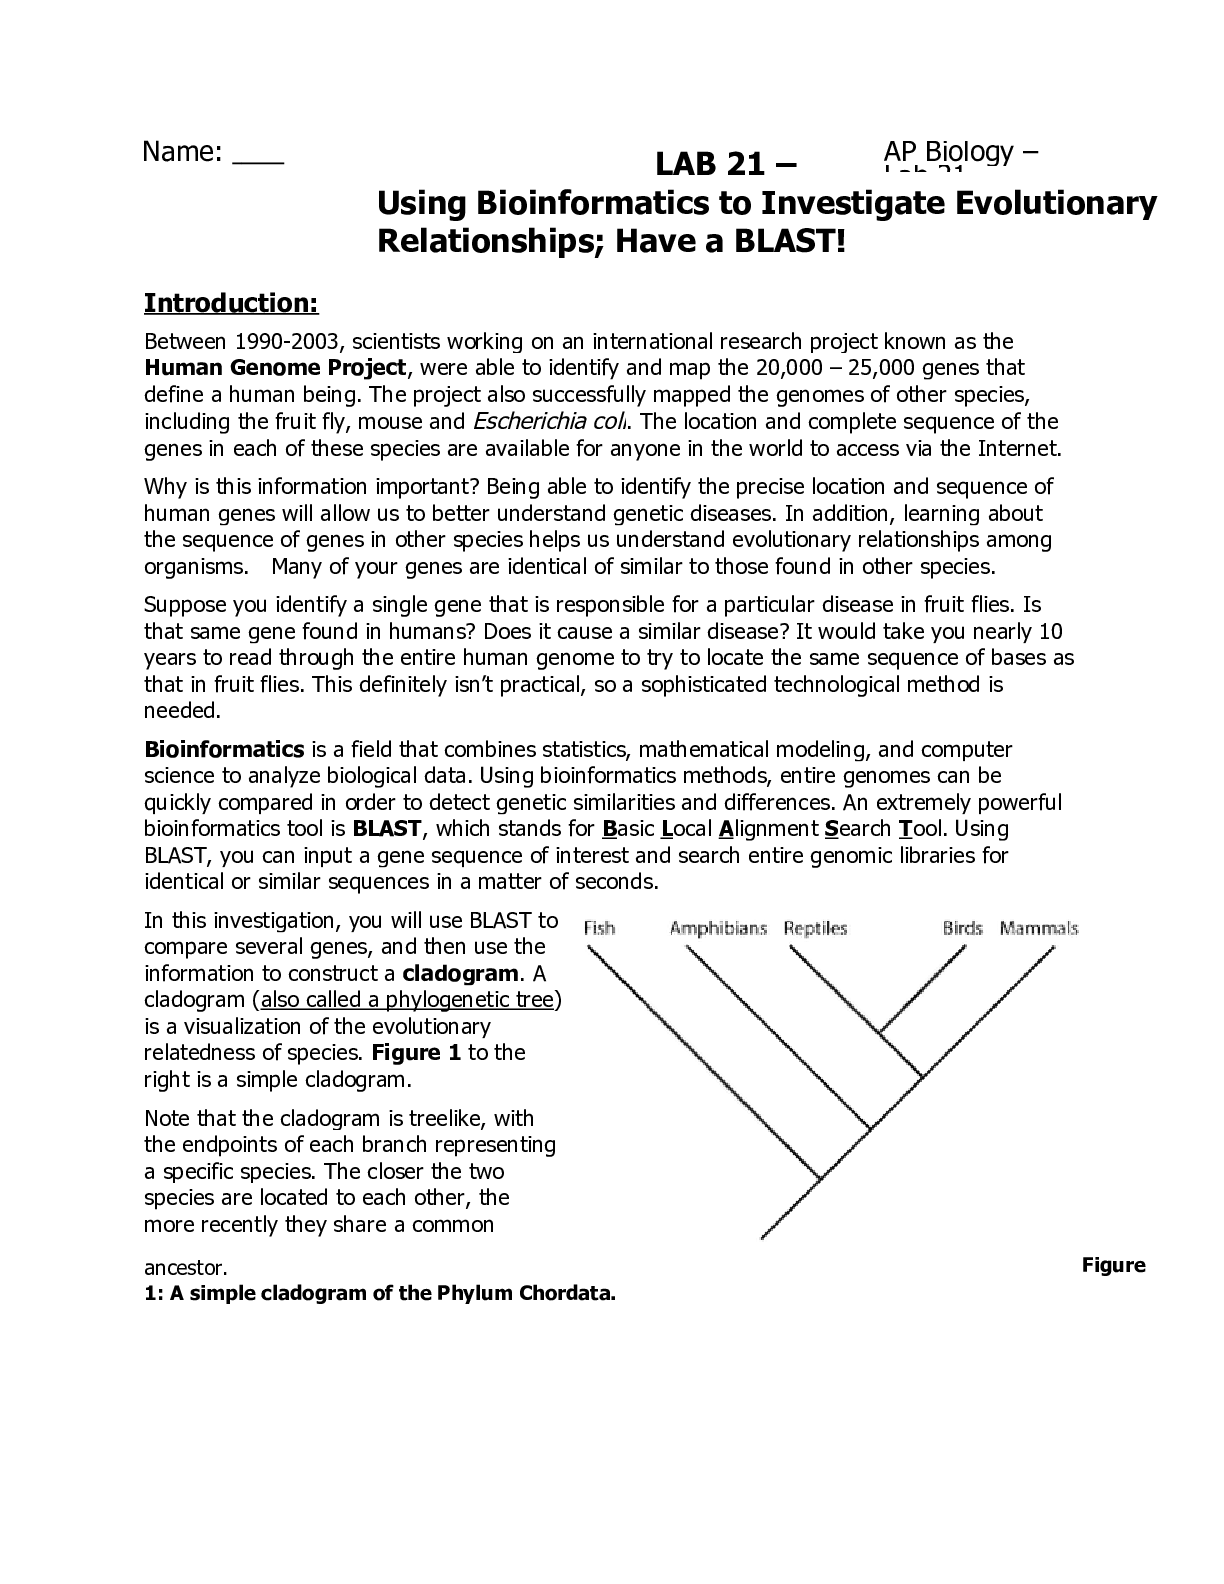
Using Bioinformatics to Investigate Evolutionary Relationships; Have a BLAST! Introduction: Between 1990-2003, scientists working on an international research project known as the Human Genome Pro ... ject, were able to identify and map the 20,000 – 25,000 genes that define a human being. The project also successfully mapped the genomes of other species, including the fruit fly, mouse and Escherichia coli. The location and complete sequence of the genes in each of these species are available for anyone in the world to access via the Internet. Why is this information important? Being able to identify the precise location and sequence of human genes will allow us to better understand genetic diseases. In addition, learning about the sequence of genes in other species helps us understand evolutionary relationships among organisms. Many of your genes are identical of similar to those found in other species. Suppose you identify a single gene that is responsible for a particular disease in fruit flies. Is that same gene found in humans? Does it cause a similar disease? It would take you nearly 10 years to read through the entire human genome to try to locate the same sequence of bases as that in fruit flies. This definitely isn’t practical, so a sophisticated technological method is needed. Bioinformatics is a field that combines statistics, mathematical modeling, and computer science to analyze biological data. Using bioinformatics methods, entire genomes can be quickly compared in order to detect genetic similarities and differences. An extremely powerful bioinformatics tool is BLAST, which stands for Basic Local Alignment Search Tool. Using BLAST, you can input a gene sequence of interest and search entire genomic libraries for identical or similar sequences in a matter of seconds. In this investigation, you will use BLAST to compare several genes, and then use the information to construct a cladogram. A cladogram (also called a phylogenetic tree) is a visualization of the evolutionary relatedness of species. Figure 1 to the right is a simple cladogram. Note that the cladogram is treelike, with the endpoints of each branch representing a specific species. The closer the two species are located to each other, the more recently they share a common ancestor. Figure 1: A simple cladogram of the Phylum Chordata. [Show More]
Last updated: 3 years ago
Preview 1 out of 13 pages
Buy this document to get the full access instantly
Instant Download Access after purchase
Buy NowInstant download
We Accept:

Reviews( 0 )
$7.00
Can't find what you want? Try our AI powered Search
Document information
Connected school, study & course
About the document
Uploaded On
Apr 10, 2021
Number of pages
13
Written in
All

Additional information
This document has been written for:
Uploaded
Apr 10, 2021
Downloads
0
Views
87


.png)


.png)


.png)

