Task 2
Are there differences in systolic blood pressure for people who are underweight, normal, overweight
or obese?
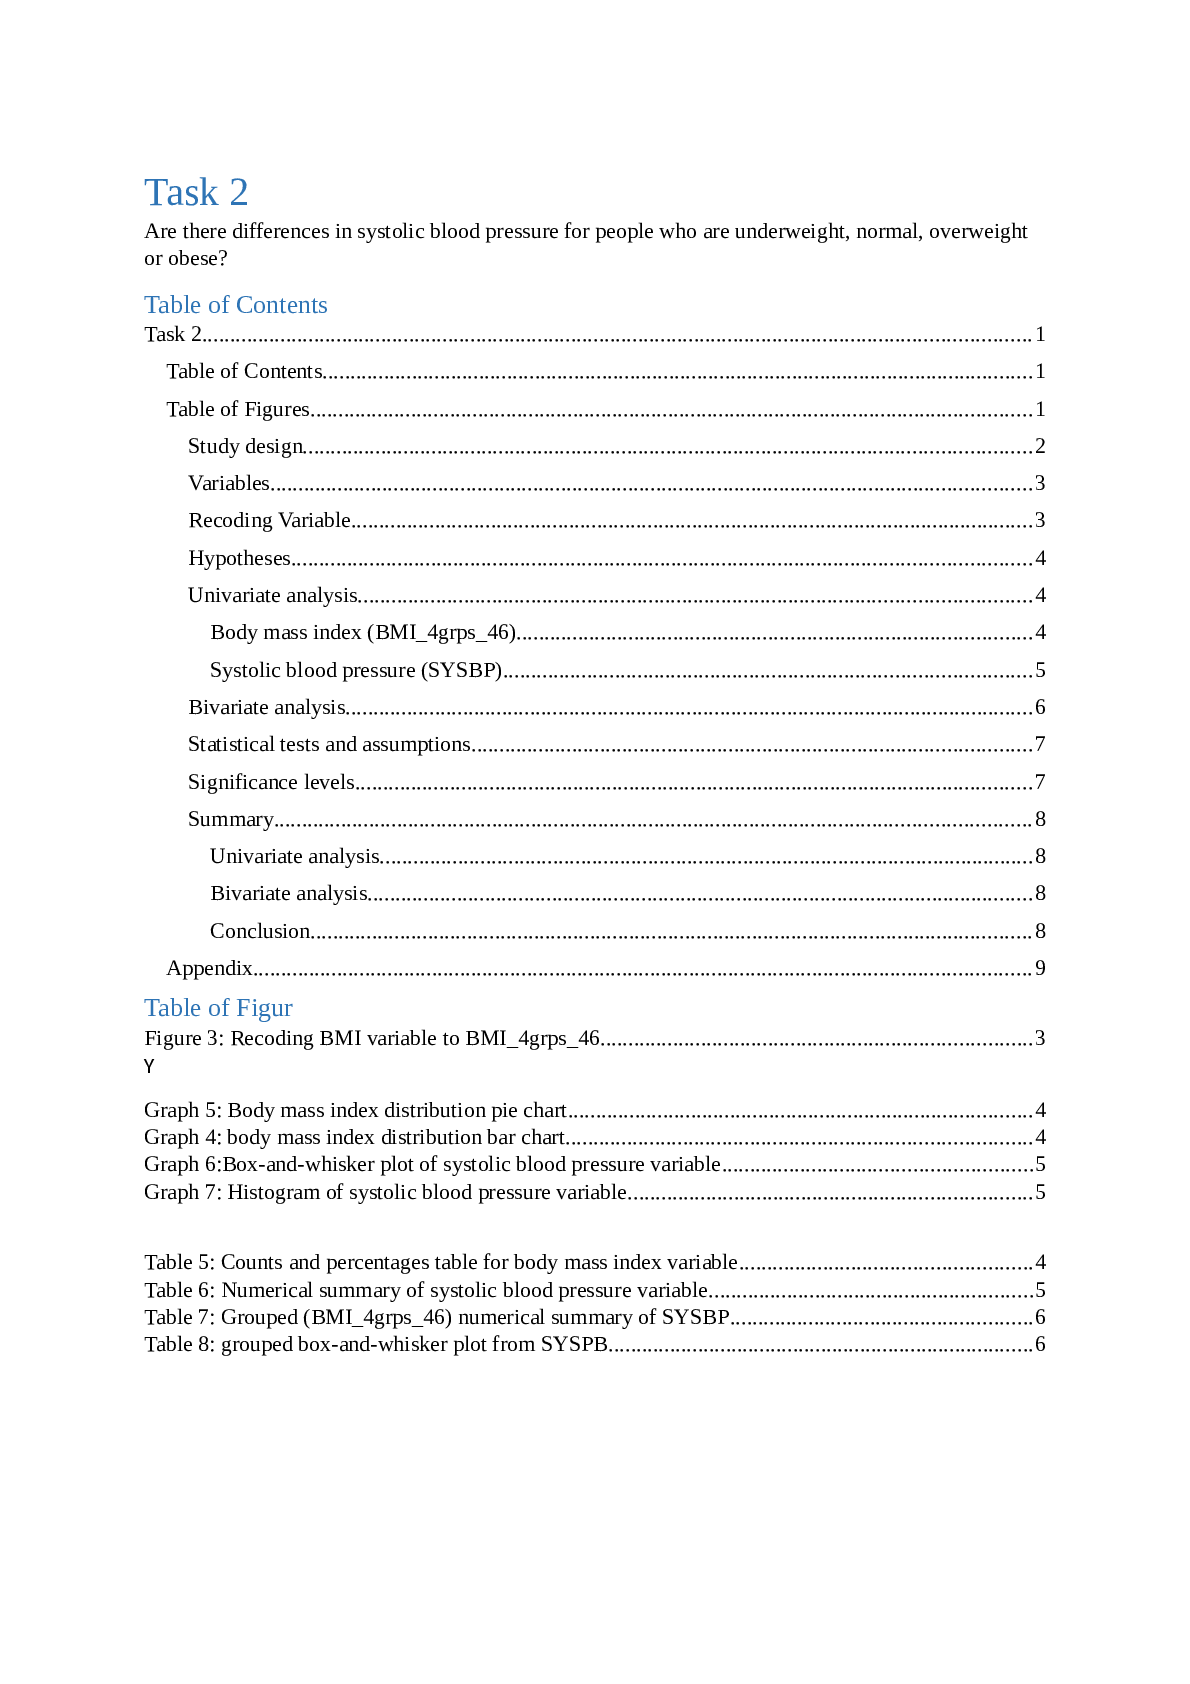
Table of Contents
Task 2...........................................................................
...
Task 2
Are there differences in systolic blood pressure for people who are underweight, normal, overweight
or obese?
Table of Contents
Task 2....................................................................................................................................................1
Table of Contents...............................................................................................................................1
Table of Figures.................................................................................................................................1
Study design..................................................................................................................................2
Variables........................................................................................................................................3
Recoding Variable..........................................................................................................................3
Hypotheses....................................................................................................................................4
Univariate analysis........................................................................................................................4
Body mass index (BMI_4grps_46)............................................................................................4
Systolic blood pressure (SYSBP)..............................................................................................5
Bivariate analysis...........................................................................................................................6
Statistical tests and assumptions....................................................................................................7
Significance levels.........................................................................................................................7
Summary.......................................................................................................................................8
Univariate analysis.....................................................................................................................8
Bivariate analysis.......................................................................................................................8
Conclusion.................................................................................................................................8
Appendix...........................................................................................................................................9
Table of Figur
Figure 3: Recoding BMI variable to BMI_4grps_46.............................................................................3
Y
Graph 5: Body mass index distribution pie chart...................................................................................4
Graph 4: body mass index distribution bar chart...................................................................................4
Graph 6:Box-and-whisker plot of systolic blood pressure variable.......................................................5
Graph 7: Histogram of systolic blood pressure variable........................................................................5
Table 5: Counts and percentages table for body mass index variable....................................................4
Table 6: Numerical summary of systolic blood pressure variable..........................................................5
Table 7: Grouped (BMI_4grps_46) numerical summary of SYSBP......................................................6
Table 8: grouped box-and-whisker plot from SYSPB............................................................................6Study desi
[Show More]

.png)