NR 503 Week 8 Final Exam Study Guide;
Chapter 2-4, 5-6, 7-8, 9-15, 16-20
Chapters 2-4
Which of the following is a condition which may occur during the incubation period?
Transmission of infection
Chicken pox is a hi
...
NR 503 Week 8 Final Exam Study Guide;
Chapter 2-4, 5-6, 7-8, 9-15, 16-20
Chapters 2-4
Which of the following is a condition which may occur during the incubation period?
Transmission of infection
Chicken pox is a highly communicable disease. It may be transmitted by direct contact with a person
infected with the varicella-zoster virus (VZV). The typical incubation time is between 10 to 20 days. A
boy started school 2 weeks after showing symptoms of chicken pox including mild fever, skin rash, &
fluid-filled blisters. One month after the boy returned to school, none of his classmates had been
infected by VZV. The main reason was:
Contact was after infectious period
The ability of a single person to remain free of clinical illness following exposure to an infectious agent
is known as:
Immunity
Which of the following is characteristic of a single-exposure, common-vehicle outbreak?
The epidemic curve has a normal distribution when plotted against the logarithm of time
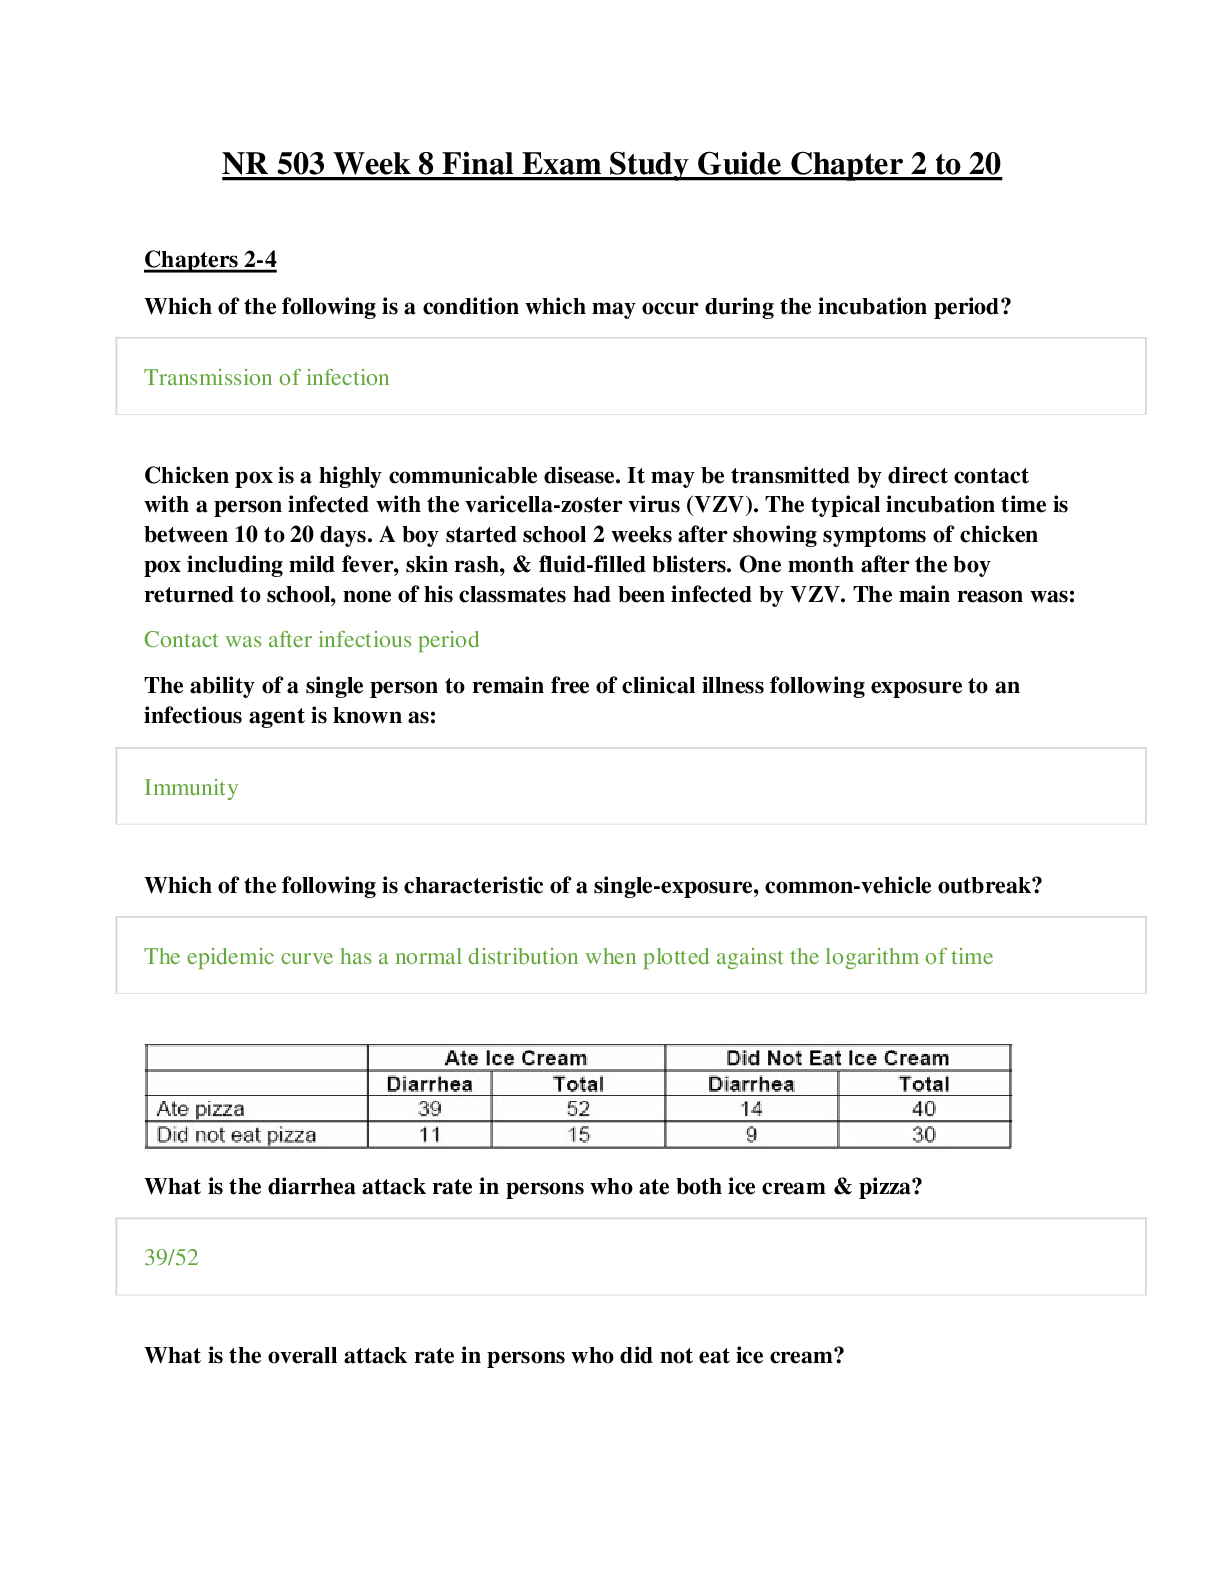
What is the diarrhea attack rate in persons who ate both ice cream & pizza?
39/52
What is the overall attack rate in persons who did not eat ice cream?33%
Which of the food items (or combination of items) is most likely to be the infective item(s)?
Ice cream only
Which of the following reasons can explain why a person who did not consume the infective food item
got sick?
They were directly exposed to persons who did eat the infective food item
Diarrhea is a general symptom consistent with a number of illnesses
There may have been an inaccurate recall of which foods were eaten (all of the above)
An outbreak of gastroenteritis occurred at a boarding school with a student enrollment of 846. Fiftyseven students reported symptoms including vomiting, diarrhea, nausea, & low-grade fever between
10 p.m. on September 24 & 8 p.m. on September 25. The ill students lived in dormitories that housed
723 of the students. The table below provides information on the number of students per type of
residence & the number reporting illnesses consistent with the described symptoms & onset time.
Calculate the attack rate among all students at the boarding school.
The answer is found by dividing the total number of cases (57) by the total number of students (846).
This equals 6.7%.
An outbreak of gastroenteritis occurred at a boarding school with a student enrollment of 846. Fiftyseven students reported symptoms including vomiting, diarrhea, nausea, & low-grade fever between
10 p.m. on September 24 & 8 p.m. on September 25. The ill students lived in dormitories that housed
723 of the students. The table below provides information on the number of students per type of
residence & the number reporting illnesses consistent with the described symptoms & onset time.
Calculate the attack rates for boys & girls separately.
For boys, the attack rate includes all cases (40 + 3) divided by the total number of students who are boys
(380 + 46). The attack rate is 10.1%.
For girls, the attack rate includes all cases (12 + 2) divided by the total number of students who are girls
(343 + 77). The attack rate is 3.3%.An outbreak of gastroenteritis occurred at a boarding school with a student enrollment of 846. Fiftyseven students reported symptoms including vomiting, diarrhea, nausea, & low-grade fever between
10 p.m. on September 24 & 8 p.m. on September 25. The ill students lived in dormitories that housed
723 of the students. The table below provides information on the number of students per type of
residence & the number reporting illnesses consistent with the described symptoms & onset time.
What is the proportion of total cases occurring in boys?
The proportion of cases occurring in boys is equal to the number of cases in boys divided by the total
number of cases (43/57). This equals 75.4%.
An outbreak of gastroenteritis occurred at a boarding school with a student enrollment of 846. Fiftyseven students reported symptoms including vomiting, diarrhea, nausea, & low-grade fever between
10 p.m. on September 24 & 8 p.m. on September 25. The ill students lived in dormitories that housed
723 of the students. The table below provides information on the number of students per type of
residence & the number reporting illnesses consistent with the described symptoms & onset time.
What is the proportion of total cases occurring in students who live in dormitories?
The proportion of cases occurring in dormitory residents is equal to the number of cases in residents
divided by the total number of cases (52/57). This equals 91.2%.
An outbreak of gastroenteritis occurred at a boarding school with a student enrollment of 846. Fiftyseven students reported symptoms including vomiting, diarrhea, nausea, & low-grade fever between
10 p.m. on September 24 & 8 p.m. on September 25. The ill students lived in dormitories that housed
723 of the students. The table below provides information on the number of students per type of
residence & the number reporting illnesses consistent with the described symptoms & onset time.
Which proportion is more informative for the purpose of the outbreak investigation?
Both proportions are useful. Dormitory residents account for over 90% of the cases indicating an
outbreak of an infectious agent that was transmitted at the school. Furthermore, over 75% of the cases
were boys indicating that the responsible agent was more likely to have been transmitted in the boys’
dormitory.
A group of researchers are interested in conducting a clinical trial to determine whether a new
cholesterol-lowering agent was useful in preventing coronary heart disease (CHD). They identified
12,327 potential participants for the trial. At the initial clinical exam, 309 were discovered to have
CHD. The remaining subjects entered the trial & were divided equally into the treatment & placebo
groups. Of those in the treatment group, 505 developed CHD after 5 years of follow-up while 477
developed CHD during the same period in the placebo group. What was the prevalence of CHD at the
initial exam?
The prevalence of CHD at the initial exam was 309 cases of CHD divided by 12,327 participants. This
equals a prevalence of 25.1 cases of CHD per 1,000 persons.
A group of researchers are interested in conducting a clinical trial to determine whether a new
cholesterol-lowering agent was useful in preventing coronary heart disease (CHD). They identified
12,327 potential participants for the trial. At the initial clinical exam, 309 were discovered to have
CHD. The remaining subjects entered the trial & were divided equally into the treatment & placebo
groups. Of those in the treatment group, 505 developed CHD after 5 years of follow-up while 477developed CHD during the same period in the placebo group. What was the incidence of CHD during
the 5-year study?
The incidence rate reflects the number of new cases developing in the population at risk. Since
prevalent CHD cases were excluded from the study, the population at risk was 12,018 (12,327 persons
less 309 cases of CHD). During the 5-year study period, 982 incident cases of CHD developed. This equals
an incidence rate of 81.7 cases of CHD per 1,000 persons.
Which of the following are examples of a population prevalence rate?
The number of persons with hypertension per 100,000 population
What would be the effect on age-specific incidence rates of uterine cancer if women with
hysterectomies were excluded from the denominator of incidence calculations assuming that most
women who have had hysterectomies are older than 50 years of age.
Rates would increase in women older than 50 years of age but may decrease in younger women as they
get older.
A survey was conducted among 1,000 r&omly sampled adult males in the United States in 2005. The
results from this survey are shown below.
The researchers stated that there was a doubling of risk of hypertension in each age group younger
than 60 years of age. You conclude that the researchers’ interpretation:
Is incorrect because prevalence rates are estimatedThe incidence & prevalence rates of a chronic childhood illness for a specific community are given
below.
Based on the data, which of the following interpretations best describes disease X?
The duration of disease is becoming shorter.
A prevalence survey conducted from January 1 through December 31, 2003 identified 580 new cases
of tuberculosis in a city of 2 million persons. The incidence rate of tuberculosis in this population has
historically been 1 per 4,000 persons each year. What is the incident rate of tuberculosis per 100,000
persons in 2003?
The answer is 29 new cases of tuberculosis per 100,000 persons. This is found by dividing the new cases
of tuberculosis by the total population at risk (580/2,000,000) & multiplying this rate by 100,000 to
st&ardize the rate.
A prevalence survey conducted from January 1 through December 31, 2003 identified 580 new cases
of tuberculosis in a city of 2 million persons. The incidence rate of tuberculosis in this population has
historically been 1 per 4,000 persons each year. Has the risk of tuberculosis increased or decreased
during 2003?
The risk of tuberculosis has increased over the historic incident rate. This comparison can be made by
st&ardizing the historic rate to a rate per 100,000 persons. To do this, multiply the numerator &
denominator by 25.
Which of the following is an advantage of active surveillance?
More accurate due to reduced reporting burden for health care providers
The population of a city on February 15, 2005, was 36,600. The city has a passive surveillance system
that collects hospital & private physician reports of influenza cases every month. During the period
between January 1 & April 1, 2005, 2,200 new cases of influenza occurred in the city. Of these cases,
775 persons were ill with influenza according to surveillance reports on April 1, 2005. The monthly
incidence rate of active cases of influenza for the 3-month period was:20 per 1,000 population
The population of a city on February 15, 2005, was 36,600. The city has a passive surveillance system
that collects hospital & private physician reports of influenza cases every month. During the period
between January 1 & April 1, 2005, 2,200 new cases of influenza occurred in the city. Of these cases,
775 persons were ill with influenza according to surveillance reports on April 1, 2005. The prevalence
rate of active influenza as of April 1, 2005, was:
20 per 1,000 population
The population of a city on February 15, 2005, was 36,600. The city has a passive surveillance system
that collects hospital & private physician reports of influenza cases every month. During the period
between January 1 & April 1, 2005, 2,200 new cases of influenza occurred in the city. Of these cases,
775 persons were ill with influenza according to surveillance reports on April 1, 2005. What can be
inferred about influenza cases occurring in the city?
The average duration of influenza is approximately 1 month
A study found that adults older than age 50 had a higher prevalence of pneumonia than those who
were younger than age 50. Which of the following is consistent with this finding?
Incidence rates do not vary by age, but older adults have pneumonia for a longer duration compared to
younger adults
Which of the following statements are true? More than one answer may be correct.
Prevalence rates are useful for public health planning
Incidence rates can be used to estimate prevalence when the mean duration of the disease is known
A disease has an incidence of 10 per 1,000 persons per year, & 80% of those affected will die within 1
year. Prior to the year 2000, only 50% of cases of the disease were detected by physician diagnosis
prior to death. In the year 2000, a lab test was developed that identified 90% of cases an average of 6
months prior to symptom onset; however, the prognosis did not improve after diagnosis. Comparing
the epidemiology of the disease prior to 2000 with the epidemiology of the disease after the
development of the lab test, which statement is true concerning the disease in 2000?Incidence is higher & prevalence is higher than in 1999
A disease has an incidence of 10 per 1,000 persons per year, & 80% of those affected will die within 1
year. Prior to the year 2000, only 50% of cases of the disease were detected by physician diagnosis
prior to death. In the year 2000, a lab test was developed that identified 90% of cases an average of 6
months prior to symptom onset; however, the prognosis did not improve after diagnosis. Which
statement is true concerning the duration of the disease after the development of the lab test?
Mean duration of a case of the disease is longer in 2000
A disease has an incidence of 10 per 1,000 persons per year, & 80% of those affected will die within 1
year. Prior to the year 2000, only 50% of cases of the disease were detected by physician diagnosis
prior to death. In the year 2000, a lab test was developed that identified 90% of cases an average of 6
months prior to symptom onset; however, the prognosis did not improve after diagnosis. Which
statement is true concerning the disease-specific mortality rate after the development of the lab test?
The mortality rate for the disease is the same in 2000
In a coastal area of a country in which a tsunami struck, there were 100,000 deaths in a population of
2.4 million for the year ending December 31, 2005. What was the all-cause crude mortality rate per
1,000 persons during 2005?
The answer is 41.7 per 1,000 persons. The rate is calculated by dividing 100,000 deaths by the
population of 2,400,000 persons. To express as a rate per 1,000 persons, the rate is multiplied by 1,000.
In an industrialized nation, there were 192 deaths due to lung diseases in miners ages 20 to 64 years.
The expected number of deaths in this occupational group, based on age-specific death rates for lung
diseases in all males ages 20 to 64 years, was 238 during 1990. What was the st&ardized mortality
ratio (SMR) for lung diseases in miners?
The answer is 81. The ratio is calculated by dividing 192 observed deaths by the 238 expected deaths for
this age group. To express it as an SMR, the ratio is often multiplied by 100.In 2001, a state enacted a law that required the use of safety seats for all children under 7 years of age
& m&atory seatbelt use for all persons. The table below lists the number of deaths due to motor
vehicle accidents (MVAs) & the total population by age in 2000 (before the law) & in 2005 (4 years
after the law was enacted).
What is the age-specific mortality rate due to MVAs for children ages 0 to 18 years in 2000?
6.1 per 1,000
In 2001, a state enacted a law that required the use of safety seats for all children under 7 years of age
& m&atory seatbelt use for all persons. The table below lists the number of deaths due to motor
vehicle accidents (MVAs) & the total population by age in 2000 (before the law) & in 2005 (4 years
after the law was enacted).
Using the pooled total of the 2000 & 2005 populations as the st&ard rate, calculate the age-adjusted
mortality rate due to MVAs in 2005.
The correct answer is 2.3 MVA deaths per 1,000 persons. The key to calculating the age-adjusted rate is
to pool the observed numbers for both time periods & to calculate the expected numbers of deaths in
the 2005 population assuming that a common rate applied to the population.
For example, for those under 7 years, the pooled rate equals (44 + 20) divided by (3,500 + 4,000). The
pooled rate for this group is 8.5 per 1,000 persons. When this rate is multiplied by the 4,000 children
under 7 years of age in 2005, the expected number of deaths is 34.13. Performing the same calculation
for each age group results in 111.7 deaths in those 7 to 18 years of age, 175.8 deaths in those 19 to 49
years, & 237.35 deaths for those 50 years or more. The total number of deaths expected in 2005 based
on this pooled rate is 558.98. Therefore, the age-adjusted overall rate for 2005 is 558.98 deaths divided
by 240,000 persons.
In 2001, a state enacted a law that required the use of safety seats for all children under 7 years of age
& m&atory seatbelt use for all persons. The table below lists the number of deaths due to motor
vehicle accidents (MVAs) & the total population by age in 2000 (before the law) & in 2005 (4 years
after the law was enacted).
Based on the information in the table, it was reported that there was an increased risk of death due to
MVAs in the state after the law was passed. These conclusions are:
Correct, because both the total & the age-adjusted mortality rates are higher in 2005 than in 2000
For colorectal cancer diagnosed at an early stage, the disease can have 5-year survival rates of greater
than 80%. Which answer best describes early stage colorectal cancer?Incidence rates will be much higher than mortality rates
The following table gives the mean annual age-specific mortality rates from measles during the first
25 years of life in successive 5-year periods. You may assume that the population is in a steady state
(i.e., migrations out are equal to migrations in).
The age-specific mortality rates for the cohort born in 1915-1919 are:
2.4 3.3 2.0 0.6 0.1
The following table gives the mean annual age-specific mortality rates from measles during the first
25 years of life in successive 5-year periods. You may assume that the population is in a steady state
(i.e., migrations out are equal to migrations in).
Based on the information above, one may conclude:
Children ages 5 to 9 had the highest rate of death in all periods
Which of the following characteristics indicate that mortality rates provide a reliable estimate of
disease incidence? More than one answer may be correct.
The case-fatality rate is high
The duration of disease is short
Which of the following statements are true? More than one answer may be correct.
A mortality rate is an example of an incidence rateAmong those who are 25 years of age, those who have been driving less than 5 years had 13,700
motor vehicle accidents in 1 year, while those who had been driving for more than 5 years had 21,680
motor vehicle accidents during the same time period. It was concluded from these data that 25-yearolds with more driving experience have increased accidents compared to those who started driving
later. This conclusion is:
Incorrect because rates are not reported
For a disease such as liver cancer, which is highly fatal & of short duration, which of the following
statements is true? Choose the best answer.
Incidence rates will be equal to mortality rates
The prevalence rate of a disease is two times greater in women than in men, but the incidence rates
are the same in men & women. Which of the following statements may explain this situation?
The case-fatality rate is lower for women
The table below describes the number of illnesses & deaths caused by plague in four communities.
The case-fatality rate associated with plague is lowest in which community?
Community C
The table below describes the number of illnesses & deaths caused by plague in four communities.
The proportionate mortality ratio associated with plague is lowest in which community?
Community DChapters 5-6
In a community-based hypertension testing program called HT-Aware, the detection level for high
blood pressure is set at 140 mmHg for systolic blood pressure. A separate testing program called HTWarning in the same community sets the level at 130 mmHg for high systolic blood pressure. Which
statements are likely to be true?
The number of false positives is greater with HT-Warning than with HT-Aware
The sensitivity of HT-Warning is greater than that of HT-Aware
A school nurse examined a population of 1,000 children in an attempt to detect nearsightedness. The
prevalence of myopia in this population is known to be 15%. The sensitivity of the examination is 60%
& its specificity is 80%. All children labeled as “positive” (i.e., suspected of having myopia) by the
school nurse are sent for examination by an optometrist. The sensitivity of the optometrist’s
examination is 98% & its specificity is 90%. How many children are labeled “positive” by the school
nurse?
There are 150 children with myopia in the school population (15% prevalence among 1,000 children).
The school nurse will identify 60% of those who truly have the condition, or 90 cases (60% sensitivity
multiplied by 150 myopic children). Further, the school nurse will incorrectly identify 170 false positive
cases of myopia among those who do not have the condition (80% specificity multiplied by 850 nonmyopic children). The sum of the cases labeled as positive by the school nurse equals 260 children (90
true myopic children plus 170 false positive children).
A school nurse examined a population of 1,000 children in an attempt to detect nearsightedness. The
prevalence of myopia in this population is known to be 15%. The sensitivity of the examination is 60%
& its specificity is 80%. All children labeled as “positive” (i.e., suspected of having myopia) by the
school nurse are sent for examination by an optometrist. The sensitivity of the optometrist’s
examination is 98% & its specificity is 90%. What is the positive predictive value (PPV) of the school
nurse’s exam?
The PPV of the school nurse’s exam is equal to the number of true positive cases divided by the total
number of those that the school nurse labels as positive. In this exam, the PPV is 34.6% (90 true myopic
children divided by 260 children labeled as myopic by the school nurse).
A school nurse examined a population of 1,000 children in an attempt to detect nearsightedness. The
prevalence of myopia in this population is known to be 15%. The sensitivity of the examination is 60%
& its specificity is 80%. All children labeled as “positive” (i.e., suspected of having myopia) by the
school nurse are sent for examination by an optometrist. The sensitivity of the optometrist’s
examination is 98% & its specificity is 90%. How many children will be labeled myopic following the
optometrist’s exam?
Since the optometrist will only test children who have been labeled as myopic by the school nurse, the
testing group for this sequential exam is 260 children. The optometrist labels 105 children as myopic.Among the 90 myopic children correctly referred by the school nurse, the optometrist identifies 88 of
them as myopic (98% sensitivity multiplied by 90 true cases of myopia). Further, the optometrist will
incorrectly identify 17 false positive cases among the 170 children referred by the school nurse who do
not have myopia. The sum of the cases labeled as positive by the optometrist equals 105 children (89
true cases plus 17 false positive cases).
A school nurse examined a population of 1,000 children in an attempt to detect nearsightedness. The
prevalence of myopia in this population is known to be 15%. The sensitivity of the examination is 60%
& its specificity is 80%. All children labeled as “positive” (i.e., suspected of having myopia) by the
school nurse are sent for examination by an optometrist. The sensitivity of the optometrist’s
examination is 98% & its specificity is 90%. What is the positive predictive value (PPV) of the
optometrist’s exam?
The PPV of the optometrist’s exam is equal to the number of true positive cases divided by the total
number that the optometrist labels as positive. The optometrist will only test 260 children referred by
the school nurse. Of these children, the optometrist will correctly identify 89 cases of myopia among
105 children labeled as positive for the condition. The PPV equals 83.8% (89 true myopic children
divided by 105 children labeled as positive).
A school nurse examined a population of 1,000 children in an attempt to detect nearsightedness. The
prevalence of myopia in this population is known to be 15%. The sensitivity of the examination is 60%
& its specificity is 80%. All children labeled as “positive” (i.e., suspected of having myopia) by the
school nurse are sent for examination by an optometrist. The sensitivity of the optometrist’s
examination is 98% & its specificity is 90%. What is the negative predictive value (NPV) of the
optometrist’s exam?
The NPV of the optometrist’s exam is 98.7%. The NPV equals the number of true negative cases divided
by all negative cases indicated by the exam. In this instance, the optometrist correctly identifies 153
children as negative for myopia; however, there are 2 false negative cases following the optometrist’s
exam (90 true cases referred by the school nurse less the 88 cases detected by the optometrist). The
NPV equals 153 divided by 155, or 98.7%.
A school nurse examined a population of 1,000 children in an attempt to detect nearsightedness. The
prevalence of myopia in this population is known to be 15%. The sensitivity of the examination is 60%
& its specificity is 80%. All children labeled as “positive” (i.e., suspected of having myopia) by the
school nurse are sent for examination by an optometrist. The sensitivity of the optometrist’s
examination is 98% & its specificity is 90%. What is the overall sensitivity of the sequential
examinations?
The overall sensitivity of the sequential exams is 58.7%; 88 true positive cases of myopia are found
following the optometrist’s exam among the 150 prevalent cases in the school population.
A school nurse examined a population of 1,000 children in an attempt to detect nearsightedness. The
prevalence of myopia in this population is known to be 15%. The sensitivity of the examination is 60%
& its specificity is 80%. All children labeled as “positive” (i.e., suspected of having myopia) by the
school nurse are sent for examination by an optometrist. The sensitivity of the optometrist’sexamination is 98% & its specificity is 90%. What is the overall specificity of the sequential
examinations?
The overall specificity of the sequential exams is 98%; 833 children will be correctly labeled as negative
for myopia among the 850 true negative cases. This is found by summing the number of true positives
after each exam (680 following that of the school nurse plus 153 following the optometrist) & dividing
by the true negative children in the population. This equals 833 divided by 850, or 98%.
A school nurse examined a population of 1,000 children in an attempt to detect nearsightedness. The
prevalence of myopia in this population is known to be 15%. The sensitivity of the examination is 60%
& its specificity is 80%. All children labeled as “positive” (i.e., suspected of having myopia) by the
school nurse are sent for examination by an optometrist. The sensitivity of the optometrist’s
examination is 98% & its specificity is 90%. What would be the positive predictive value (PPV) of the
exam for myopia if the optometrist tested all 1,000 children?
The PPV of the optometrist’s exam would be equal to the number of true positive cases divided by all
children labeled positive by the optometrist. Applying the sensitivity & specificity of the optometrist’s
exam to the 1,000 children would indicate that 147 true positive cases are labeled positive by the
optometrist. Additionally, the optometrist would find 85 false positive cases (850 true negative cases
multiplied by 90% specificity). The PPV would be 63.4% (147 true positive cases divided by 232 total
positives indicated by the optometrist).
Which of the following improves the reliability of diabetes screening tests?
Having the same lab analyze all samples
Taking more than one sample for each subject & averaging the results
Insuring that the instrument is st&ardized before each sample is analyzed (All of the above)
A prostate specific antigen (PSA) test is a quick screening test for prostate cancer. A researcher wants
to evaluate it using two groups. Group A consists of 1,500 men who had biopsy-proven
adenocarcinoma of the prostate while group B consists of 3,000 age- & race-matched men all of whom
showed no cancer at biopsy. The results of the PSA screening test in each group is shown in the table.
What is the sensitivity of the PSA screening test in the combined groups?
The sensitivity equals the number of true positives detected among all true positives. Since a biopsy is
the gold st&ard test for prostate cancer, all 1,500 men in group A are positive for prostate cancer. The
PSA test indicated that 1,155 of these men had prostate cancer, a sensitivity of 77%.
A prostate specific antigen (PSA) test is a quick screening test for prostate cancer. A researcher wants
to evaluate it using two groups. Group A consists of 1,500 men who had biopsy-proven
adenocarcinoma of the prostate while group B consists of 3,000 age- & race-matched men all of whom
showed no cancer at biopsy. The results of the PSA screening test in each group is shown in the table.What is the specificity of the screening test in the combined groups?
The specificity equals the number of true negatives detected among all true negatives. Among the 3,000
men who did not have prostate cancer, the test correctly identified 2,760 men as negative for prostate
cancer (3,000 minus 240 false positives). This gives a sensitivity of 92%.
A prostate specific antigen (PSA) test is a quick screening test for prostate cancer. A researcher wants
to evaluate it using two groups. Group A consists of 1,500 men who had biopsy-proven
adenocarcinoma of the prostate while group B consists of 3,000 age- & race-matched men all of whom
showed no cancer at biopsy. The results of the PSA screening test in each group is shown in the table.
What is the positive predictive value (PPV) of the screening test in the combined groups?
The PPV is 83%. This value is found by dividing 1,155 true positives by the total number of all positives
indicated by the PSA test (1,155 plus 24).
A prostate specific antigen (PSA) test is a quick screening test for prostate cancer. A researcher wants
to evaluate it using two groups. Group A consists of 1,500 men who had biopsy-proven
adenocarcinoma of the prostate while group B consists of 3,000 age- & race-matched men all of whom
showed no cancer at biopsy. The results of the PSA screening test in each group is shown in the table.
The PSA screening test is used in the same way in two equal-sized populations of men living in
different areas of the United States, but the proportion of false positives among those who have a
positive PSA test in the first population is lower than that among those who have a positive PSA test
in the second population. What is the likely explanation for this finding?
The prevalence of disease is higher in the first population
Test A has a sensitivity of 95% & a specificity of 90%. Test B has a sensitivity of 80% & a specificity of
98%. In a community of 10,000 people with 5% prevalence of the disease, Test A has always been
given before Test B. What is the best reason for changing the order of the tests?
The total number of false positives found by both tests is decreased if Test B is given first
Two neurologists, Drs. J & K, independently examined 70 magnetic resonance images (MRIs) for
evidence of brain tumors. As shown in the table below, the neurologists read each MRI as either
“positive” or “negative” for brain tumors.Based on the above information, the overall percent agreement between the two doctors including all
observations is:
62.9%
Two neurologists, Drs. J & K, independently examined 70 magnetic resonance images (MRIs) for
evidence of brain tumors. As shown in the table below, the neurologists read each MRI as either
“positive” or “negative” for brain tumors.
What is the estimate of kappa for the reliability of the two doctors’ test results?
24.9%
This table represents the results of coronary magnetic resonance (CMR) angiography compared to xray angiography (the gold st&ard in diagnosis of coronary artery disease) in a high-risk population of
patients scheduled to undergo x-ray angiography for suspected coronary artery disease.
In the general population, the prevalence of coronary artery disease is approximately 6%. Assuming
that this sample of patients is representative of the general population, the sensitivity of the CMR test
in the general population would be approximately:
Between 90% & 95%
This table represents the results of coronary magnetic resonance (CMR) angiography compared to xray angiography (the gold st&ard in diagnosis of coronary artery disease) in a high-risk population of
patients scheduled to undergo x-ray angiography for suspected coronary artery disease.
After reviewing the results of the test comparison, an epidemiologist decides that the specificity of
the test is too low. Using the same CMR images, he raises the cutoff value for a positive test to
increase the specificity. What is the likely effect on the sensitivity?
Sensitivity will decreaseIn comparing the mammography readings of two technicians who evaluated the same set of 600
mammograms for presence of breast cancer from a generally representative sample of women from
the population,
Overall percent agreement calculated for both readers may conceal significant disagreements regarding
positive tests
In a country with a population of 16 million people, 175,000 deaths occurred during the year ending
December 31, 2005. These included 45,000 deaths from tuberculosis (TB) in 135,000 persons who
were sick with TB. Assume that the population remained constant throughout the year. What was the
annual mortality rate for the country during 2005?
The annual mortality rate equals the number of deaths divided by the total population. In this example,
175,000 deaths occurred among 16 million persons. Dividing these numbers & multiplying by 100,000
gives a rate of 1,094 deaths per 100,000 persons, approximately 1% of the population.
In a country with a population of 16 million people, 175,000 deaths occurred during the year ending
December 31, 2005. These included 45,000 deaths from tuberculosis (TB) in 135,000 persons who
were sick with TB. Assume that the population remained constant throughout the year. What was the
case-fatality rate (CFR) from TB during 2005?
The CFR is the number of cause-specific deaths divided by all cases of the specific disease. In this
example, 45,000 TB deaths occurred in 135,000 persons with TB. This equals a CFR of 33%.
In a country with a population of 16 million people, 175,000 deaths occurred during the year ending
December 31, 2005. These included 45,000 deaths from tuberculosis (TB) in 135,000 persons who
were sick with TB. Assume that the population remained constant throughout the year. What is the
proportionate mortality ratio (PMR) for TB during 2005?
The PMR is the number of deaths due to a specific cause divided by all deaths. In this example, the PMR
equals 45,000 TB deaths divided by 175,000 deaths, or approximately 26%.
In a country with a population of 16 million people, 175,000 deaths occurred during the year ending
December 31, 2005. These included 45,000 deaths from tuberculosis (TB) in 135,000 persons who
were sick with TB. Assume that the population remained constant throughout the year. Not all
135,000 cases of TB were contracted during 2005. Which of the following statements is true?
None of the above
Which of the following statements pertains to relative survival?Is generally closer to observed survival rates in younger age groups
What was the probability of surviving the second year given survival to the end of the first year?
The probability of surviving the second year given survival to the end of the year indicates that we are
concerned with the survival proportion of those alive at the end of year 1. In this example, we have 950
persons alive at the beginning of year 2 (thus, the end of year 1). Of this group, 30 die by the end of the
second year. This gives a survival rate of 920 divided by 950, or 97%.
What was the cumulative probability of surviving after only 2 years of follow-up?
The cumulative survival is the total number of those surviving by the end of the second year divided by
all persons who were alive at the beginning of follow-up. In this example, there were 920 survivors
among the 1,000 persons who were alive at the beginning of observation. This equals a cumulative
survival of 92%. Alternatively, this cumulative survival can be calculated by multiplying the survival rates
for each period of interest. In this example 95% survival for year 1 multiplied by 97% survival for year 2
equals a cumulative survival of 92%.
An important assumption in this type of analysis is that:
No change has occurred in the effectiveness of treatment during the 3-year period
Complete the table. What is the probability that a person enrolled in the study will survive to the end
of the third year?The answer is 48.6%. Completing the table gives the following results for each column:
Column 5 from top to bottom: 350, 255, 184
Column 6 from top to bottom: 0.229, 0.228, 0.185
Column 7 from top to bottom: 0.771, 0.772, 0.815
Column 8 from top to bottom: 0.771, 0.596, 0.486
The cumulative survival at the end of the follow-up period equals the probability of survival during each
of the years of follow-up. In this example, multiplying 0.771 by 0.772, then multiplying this product by
0.815 equals the cumulative survival rate of 0.486.
Before reporting the results of this survival analysis, the investigators compared baseline
characteristics of the 38 people who withdrew from the study before its end to those who had
complete follow-up. This was done for which of the following reasons:
To check whether those remaining in the study represent the total study population
Which of the following is a key assumption involved in the use of life-table analysis?
The risk of disease does not change within each interval over the period of observation
Which of the following is a measure of disease prognosis?
Median survival time
In 2003, Sudden Acute Respiratory Syndrome (SARS) appeared in several countries, mainly in Asia.
The disease was determined to have been caused by a virus that could be spread from person –toperson from the index case occurring in mainl& China. This table reflects the total number of reported
cases of SARS & deaths among those cases as best as can be determined. What is the overall casefatality rate for the worldwide epidemic of SARS?
9.5%
In 2003, Sudden Acute Respiratory Syndrome (SARS) appeared in several countries, mainly in Asia.
The disease was determined to have been caused by a virus that could be spread from person –to
person from the index case occurring in mainl& China. This table reflects the total number of reported
cases of SARS & deaths among those cases as best as can be determined. Based on the table, we can
conclude that the case-fatality rate (CFR) in Vietnam:
Is almost one half that of the case-fatality rate in Singapore
In 2003, Sudden Acute Respiratory Syndrome (SARS) appeared in several countries, mainly in Asia.
The disease was determined to have been caused by a virus that could be spread from person –to
person from the index case occurring in mainl& China. This table reflects the total number of reported
cases of SARS & deaths among those cases as best as can be determined. Following a revision in the
case definition, more persons were found to have suffered from an infection with the SARS virus. The
inclusion of these cases, almost all asymptomatic, did not impact the total number of SARS fatalities.
What happened to the case-fatality rate (CFR) following this reclassification?
It was decreased
What is the probability of surviving the second year of the study given that a person survived the first
year?
The independent probability of surviving the second year for all persons who survived the first year is
found by dividing the number of survivors at the end of the period by the total number present at the
beginning of the period. In addition, for those who withdraw during the interval, only 50% of thesepersons should be counted as being present during the interval. The table should be completed with the
following values:
Column (B) from top to bottom: 248, 124, 55
Column (E) from top to bottom: 0.410, 0.470, 0.296
Column (F) from top to bottom: 0.590, 0.530, 0.704
Column (G) from top to bottom: 0.590, 0.313, 0.220
Therefore, the second year survival probability among all those surviving in the study past the first year
is 53%. The probability of dying during the second year equals the number of deaths during the interval
(55) divided by the total number of persons alive at the start of the interval less one half of those
withdrawing from the study (117). Subtracting this value from 100% results in a survival rate of 53% for
the interval.
For all people in the study, what is the probability of surviving to the end of the second year?
The cumulative probability of survival through the second year equals the probability of survival for the
first year multiplied by the probability for the second year. This equals 59% multiplied by 53%, or 31.3%.
What is the probability chance of surviving 3 years after diagnosis?
The cumulative survival probability for all 3 years equals the product of the independent interval survival
probabilities. In this example, 59% multiplied by 53% multiplied by 70.4% gives a cumulative survival
probability of 22%.
What is the total number of person-years of follow-up for patients in the study assuming a median
survival time of one half of the year for all persons dying during an interval & an observation time of
one half of the year for all persons withdrawing from the study?
This calculation involves attributing the correct amounts of person-years to each group during an
interval. For the first year of the study, 96 deaths occur. Using the median survival time, we can
calculate that these persons contributed 48 person-years of observation. Additionally, 28 persons
withdraw from the study. Again, allocating one half of the year to each of these patients results in 14
person-years. Of the remaining 124 persons who survive for the full year, they contribute 124 personyears of observation. The total person-time for the first year of the study is 186 person-years.
Continuing with this same approach for years 2 & 3 of the study, we arrive at a total of 321.5 personyears of observed study time.
Before reporting the results of this survival analysis, the investigators compared baseline
characteristics of the 44 people who withdrew from the study before its end to those who had
complete follow-up. This was done:
To check whether those withdrawing from the study are similar to persons remaining in the studyChapters 7-8
Which of the following statements best describe efficacy?
It is an estimate of the benefit of treatment under ideal conditions
It is an estimate of the reduction of disease in treated groups
A study is conducted for a pharmaceutical agent that has shown promise for reducing heart disease
among women. In order to more fully test the agent, an additional study is done restricting the
participants to be r&omized to those who have a history of hypertension. Which of the following
advantages cannot be claimed by the researchers?
The generalizability of the study is increased
A new drug treatment for cardiac thrombus claims to have a higher success rate than the current
drug. A strong sign of the potential success is the lack of internal hemorrhaging starting 2 days after
treatment. 168 patients who require treatment for cardiac thrombi are r&omized after agreeing to
participate in a trial of the new drug. The researchers were interested in whether the new drug
reduced the need for blood transfusions due to internal hemorrhage compared to the current
treatment. The following table summarizes the results of her study:
What is the incidence of needing a blood transfusion in the group of persons who were r&omized to
the new drug treatment?
51.2%
A new drug treatment for cardiac thrombus claims to have a higher success rate than the current
drug. A strong sign of the potential success is the lack of internal hemorrhaging starting 2 days after
treatment. 168 patients who require treatment for cardiac thrombi are r&omized after agreeing to
participate in a trial of the new drug. The researchers were interested in whether the new drug
reduced the need for blood transfusions due to internal hemorrhage compared to the current
treatment. The following table summarizes the results of her study:What is the number of persons who died in hospital in the study?
28
A new drug treatment for cardiac thrombus claims to have a higher success rate than the current
drug. A strong sign of the potential success is the lack of internal hemorrhaging starting 2 days after
treatment. 168 patients who require treatment for cardiac thrombi are r&omized after agreeing to
participate in a trial of the new drug. The researchers were interested in whether the new drug
reduced the need for blood transfusions due to internal hemorrhage compared to the current
treatment. The following table summarizes the results of her study:
What is the main advantage of the r&omization of the 168 study participants to one of the two drug
treatment groups?
Reduces the potential for selection bias in allocation of treatment group
A new drug treatment for cardiac thrombus claims to have a higher success rate than the current
drug. A strong sign of the potential success is the lack of internal hemorrhaging starting 2 days after
treatment. 168 patients who require treatment for cardiac thrombi are r&omized after agreeing to
participate in a trial of the new drug. The researchers were interested in whether the new drug
reduced the need for blood transfusions due to internal hemorrhage compared to the current
treatment. The following table summarizes the results of her study:
The researchers interpret the findings to conclude that the new drug treatment is more likely to result
in a blood transfusion & subsequent death. This statement is:
Correct
A r&omized, double-blind clinical trial of a varicella vaccine observed an estimated incidence of 25%
chickenpox episodes in persons receiving the vaccine, compared to 80% among persons receiving a
placebo. The estimated efficacy of the vaccine is:
68.8%
A multicenter double-blind r&omized study was carried out to compare the effect of drug X with that
of a placebo in patients surviving acute myocardial infarction (AMI). Treatment with the drug started
7 days after infarction in 1,884 patients, 52% of all persons who were evaluated for entry into thestudy. 945 participants were r&omized to treatment with drug X while 939 were assigned to the
placebo group. Patients were then followed for 12 months for reinfarction. There were 152 deaths in
the placebo group & 98 in the group receiving drug X.
After entry into the study, patients were first classified into three groups, those who had a previous
AMI, those with a first AMI who were at high risk for other cardiovascular diseases such as congestive
heart failure, & those with a first AMI who were at low risk for other cardiovascular diseases. Which
term best describes the study design?
R&omized clinical trial with stratified r&omization
A multicenter double-blind r&omized study was carried out to compare the effect of drug X with that
of a placebo in patients surviving acute myocardial infarction (AMI). Treatment with the drug started
7 days after infarction in 1,884 patients, 52% of all persons who were evaluated for entry into the
study. 945 participants were r&omized to treatment with drug X while 939 were assigned to the
placebo group. Patients were then followed for 12 months for reinfarction. There were 152 deaths in
the placebo group & 98 in the group receiving drug X.
After assignment to treatment group, 77% of those in the placebo group were men, while 80% of
those in the drug X group were men. Which statement is most likely to be true?
R&omization was successful since the investigators did not alter the selection of participants in either
group in order to ensure equal percentages of men
A multicenter double-blind r&omized study was carried out to compare the effect of drug X with that
of a placebo in patients surviving acute myocardial infarction (AMI). Treatment with the drug started
7 days after infarction in 1,884 patients, 52% of all persons who were evaluated for entry into the
study. 945 participants were r&omized to treatment with drug X while 939 were assigned to the
placebo group. Patients were then followed for 12 months for reinfarction. There were 152 deaths in
the placebo group & 98 in the group receiving drug X.
A preliminary analysis was conducted after 6 months & found that 87% of participants in the placebo
group & 85% of those in the drug X group had taken more than 90% of their prescribed dosages.
Which statement best describes this finding?
The characteristics of patients who failed to comply with the treatment dosages should be assessed as
they may differ from those who compliedA multicenter double-blind r&omized study was carried out to compare the effect of drug X with that
of a placebo in patients surviving acute myocardial infarction (AMI). Treatment with the drug started
7 days after infarction in 1,884 patients, 52% of all persons who were evaluated for entry into the
study. 945 participants were r&omized to treatment with drug X while 939 were assigned to the
placebo group. Patients were then followed for 12 months for reinfarction. There were 152 deaths in
the placebo group & 98 in the group receiving drug X.
Which of the following statements best describes the reason for conducting the study as a doubleblind trial?
Double blinding ensures that potential biases regarding selection, follow-up, & analysis can be reduced
A multicenter double-blind r&omized study was carried out to compare the effect of drug X with that
of a placebo in patients surviving acute myocardial infarction (AMI). Treatment with the drug started
7 days after infarction in 1,884 patients, 52% of all persons who were evaluated for entry into the
study. 945 participants were r&omized to treatment with drug X while 939 were assigned to the
placebo group. Patients were then followed for 12 months for reinfarction. There were 152 deaths in
the placebo group & 98 in the group receiving drug X.
The researchers conclude that treatment with drug X reduces mortality in patients who have had an
AMI. The researchers are:
Correct because the rate of death is decreased in the drug X group
The following data come from a study of approaches to smoking cessation. Smokers who want to quit
were r&omized to one of four groups: control group C who received no intervention assistance,
quitting guide group Q who received brochures about how to quit smoking, quitting guide & support
group QS who received quitting brochures as well as social support brochures listing benefits of
smoking cessation, & telephone support group T who received the brochures & a monthly phone call
from a counselor. Participants received mailed surveys at 8, 16, & 24 months after r&omization. The
results after 2 years are in the table below. What is the overall quit rate after 2 years of follow-up?
The overall quit rate after 2 years is 17.6%. This is estimated by summing the total number of those who
quit smoking (331) & dividing by all participants who returned the survey after 2 years (1877).
The following data come from a study of approaches to smoking cessation. Smokers who want to quit
were r&omized to one of four groups: control group C who received no intervention assistance,quitting guide group Q who received brochures about how to quit smoking, quitting guide & support
group QS who received quitting brochures as well as social support brochures listing benefits of
smoking cessation, & telephone support group T who received the brochures & a monthly phone call
from a counselor. Participants received mailed surveys at 8, 16, & 24 months after r&omization. The
results after 2 years are in the table below. Which group had the least success in terms of quitting
smoking?
Group QS
The following data come from a study of approaches to smoking cessation. Smokers who want to quit
were r&omized to one of four groups: control group C who received no intervention assistance,
quitting guide group Q who received brochures about how to quit smoking, quitting guide & support
group QS who received quitting brochures as well as social support brochures listing benefits of
smoking cessation, & telephone support group T who received the brochures & a monthly phone call
from a counselor. Participants received mailed surveys at 8, 16, & 24 months after r&omization. The
results after 2 years are in the table below. What is the main purpose of r&omization in this study?
To avoid assigning more persons who have tried & failed to quit in the past to the control group
Chapters 9-15
A study is planned to investigate the relationship of factors associated with maternal hypertension &
the risk of congenital birth defects in children born to these women. Which of the following would be
a reason for using a cohort study design?
The need to obtain data on the incidence of early fetal losses due to congenital birth defects
A researcher is interested in the etiology of myocardial infarction (MI) among men between 18 & 40
years of age. Her hypothesis concerns the influence of diets high in fat & subsequent development of
MI. What is the best study approach to address this hypothesis?
Prospective cohort study identifying a population of men in this age group, administering a dietary
survey & classifying men by high & low fat diet, then following both groups for the development of an MI
Which of the following is an advantage to the conduct of a cohort study?
The incidence of the disease is high in the exposed groupA cohort study is planned to investigate the potential adverse health effects of daily alcohol
consumption. In assessing the risk of liver cancer related to alcoholism, which of the following is not
an important methodologic consideration?
The difficulty of finding enough persons with liver cancer at the beginning of the study in whom alcohol
consumption could be determined
Which of the following is not an advantage of a retrospective cohort study?
Possible bias due to selection of the cohort is eliminated
In a study of the adverse effects of x-rays among children, a retrospective cohort study was done
using records from several large children’s hospitals for the period of 1980 to 1985. 10,000 children
were selected as a representative population of ill children seen at the hospitals during that time.
Subjects were classified according to whether or not they received an x-ray during their stay in the
hospital & were followed from their hospital stay through 2005 for the development of cancer. During
the follow-up period, 49 incident cancers occurred in 3,263 children who had received an x-ray, & 47
incident cancers occurred in the 6,737 children who had not received an x-ray during their
hospitalization. In this retrospective study, which of the following groups are eligible for selection into
the study?
Children receiving x-rays for broken bones in 1983
In a study of the adverse effects of x-rays among children, a retrospective cohort study was done
using records from several large children’s hospitals for the period of 1980 to 1985. 10,000 children
were selected as a representative population of ill children seen at the hospitals during that time.
Subjects were classified according to whether or not they received an x-ray during their stay in the
hospital & were followed from their hospital stay through 2005 for the development of cancer. During
the follow-up period, 49 incident cancers occurred in 3,263 children who had received an x-ray, & 47
incident cancers occurred in the 6,737 children who had not received an x-ray during their
hospitalization. What are the rates of cancer incidence in each exposure group?
The rate of cancer incidence in the x-ray exposed group is 15 per 1,000 (49 divided by 3,263 multiplied
by 1,000) & 7 per 1,000 in the nonexposed group (47 divided by 6,737 multiplied by 1,000).
In a study of the adverse effects of x-rays among children, a retrospective cohort study was done
using records from several large children’s hospitals for the period of 1980 to 1985. 10,000 children
were selected as a representative population of ill children seen at the hospitals during that time.
Subjects were classified according to whether or not they received an x-ray during their stay in thehospital & were followed from their hospital stay through 2005 for the development of cancer. During
the follow-up period, 49 incident cancers occurred in 3,263 children who had received an x-ray, & 47
incident cancers occurred in the 6,737 children who had not received an x-ray during their
hospitalization. What is the attributable risk of cancer due to x-ray in this study population? What is
the interpretation of this estimate?
The attributable risk equals the incidence rate in the exposed group minus the incidence rate in the
nonexposed group. In this instance, the attributable risk is 8 per 1,000. This estimate is interpreted to
mean that 8 of the 15 incident cases of cancer occurring in 1,000 children exposed to x-rays are due to
the exposure itself.
In a study of the adverse effects of x-rays among children, a retrospective cohort study was done
using records from several large children’s hospitals for the period of 1980 to 1985. 10,000 children
were selected as a representative population of ill children seen at the hospitals during that time.
Subjects were classified according to whether or not they received an x-ray during their stay in the
hospital & were followed from their hospital stay through 2005 for the development of cancer. During
the follow-up period, 49 incident cancers occurred in 3,263 children who had received an x-ray, & 47
incident cancers occurred in the 6,737 children who had not received an x-ray during their
hospitalization. What is the risk ratio for the effect of exposure on the development of cancer in this
study? What is the interpretation of this estimated ratio?
The risk ratio is found by dividing the rate of cancers for each exposure group. In this instance, 15 per
1,000 (0.015) divided by 7 per 1,000 (0.007) equals a risk ratio of 2.1. This indicates that the risk of
cancer is twice as high in children who received x-rays during their stay in the hospital.
In a study of the adverse effects of x-rays among children, a retrospective cohort study was done
using records from several large children’s hospitals for the period of 1980 to 1985. 10,000 children
were selected as a representative population of ill children seen at the hospitals during that time.
Subjects were classified according to whether or not they received an x-ray during their stay in the
hospital & were followed from their hospital stay through 2005 for the development of cancer. During
the follow-up period, 49 incident cancers occurred in 3,263 children who had received an x-ray, & 47
incident cancers occurred in the 6,737 children who had not received an x-ray during their
hospitalization. Which of the following issues should the investigators consider when interpreting
whether a causal association exists between cancer incidence & childhood x-ray?
Some study subjects were treated for cancer starting in 1980
Some study subjects had parents who were diagnosed with cancer
Some children received x-rays at other hospitals not included in this study
The children were different ages when they were admitted to the hospital (All of the above)
Which of the following may be a factor that would result from the inability to use r&omization in a
cohort study?
The possibility that a factor which leads to exposure may be causally associated with the disease6,750 people who were free of disease X were enrolled in a cohort study in 1985 & followed with
annual exams & interviews through 1995. Exposure to factor A was determined at study enrollment &
the participants were followed until 1995 to observe new cases of disease X. Data from the study at
the end of follow-up are shown in the following table. What is the incidence rate of disease X among
persons exposed to factor A?
0.04
6,750 people who were free of disease X were enrolled in a cohort study in 1985 & followed with
annual exams & interviews through 1995. Exposure to factor A was determined at study enrollment &
the participants were followed until 1995 to observe new cases of disease X. Data from the study at
the end of follow-up are shown in the following table. What is the relative risk for the effect of
exposure to factor A on disease X?
5.00
In 2002, investigators started a study of the association of cholesterol levels & stroke in a group of
2,000 healthy persons who had participated in a cholesterol screening program in 1992. The
investigators determined exposure categories using cholesterol levels in all persons that were
measured at the time of the screening program. A cutoff value of 200 mg/dL was used to define
“high” cholesterol while those with levels below 200 were identified as having “low” cholesterol.
Using this definition, 1,000 persons had “high” cholesterol levels while the remaining 1,000 persons
had “low” cholesterol. The investigators determined that 150 cases of stroke occurred by the end of
2004, with 113 cases occurring in the high cholesterol group. What is the study design that the
investigators used?
Retrospective cohort study
In 2002, investigators started a study of the association of cholesterol levels & stroke in a group of
2,000 healthy persons who had participated in a cholesterol screening program in 1992. The
investigators determined exposure categories using cholesterol levels in all persons that were
measured at the time of the screening program. A cutoff value of 200 mg/dL was used to define
“high” cholesterol while those with levels below 200 were identified as having “low” cholesterol.
Using this definition, 1,000 persons had “high” cholesterol levels while the remaining 1,000 persons
had “low” cholesterol. The investigators determined that 150 cases of stroke occurred by the end of
2004, with 113 cases occurring in the high cholesterol group. What type of risk measure should the
investigators calculate?Relative risk
In 2002, investigators started a study of the association of cholesterol levels & stroke in a group of
2,000 healthy persons who had participated in a cholesterol screening program in 1992. The
investigators determined exposure categories using cholesterol levels in all persons that were
measured at the time of the screening program. A cutoff value of 200 mg/dL was used to define
“high” cholesterol while those with levels below 200 were identified as having “low” cholesterol.
Using this definition, 1,000 persons had “high” cholesterol levels while the remaining 1,000 persons
had “low” cholesterol. The investigators determined that 150 cases of stroke occurred by the end of
2004, with 113 cases occurring in the high cholesterol group. Using the reported study data, what is
the estimate of the risk measure that was chosen?
3.1
In 2002, investigators started a study of the association of cholesterol levels & stroke in a group of
2,000 healthy persons who had participated in a cholesterol screening program in 1992. The
investigators determined exposure categories using cholesterol levels in all persons that were
measured at the time of the screening program. A cutoff value of 200 mg/dL was used to define
“high” cholesterol while those with levels below 200 were identified as having “low” cholesterol.
Using this definition, 1,000 persons had “high” cholesterol levels while the remaining 1,000 persons
had “low” cholesterol. The investigators determined that 150 cases of stroke occurred by the end of
2004, with 113 cases occurring in the high cholesterol group. What is a necessary assumption for the
study’s findings to be true?
The cholesterol level measured in 1992 is a valid determinant of exposure status during the entire study
period
The following data are from a prospective study that examined the relationship between smoking &
incidence of both myocardial infarction (heart attack) & breast cancer among women. What is the
proportion attributable risk of breast cancer among smokers?
60%
The following data are from a prospective study that examined the relationship between smoking &
incidence of both myocardial infarction (heart attack) & breast cancer among women. What is the
proportion attributable risk of breast cancer among smokers? What is the relative risk of myocardial
infarction for smokers?1.3
The following data are from a prospective study that examined the relationship between smoking &
incidence of both myocardial infarction (heart attack) & breast cancer among women. If the
proportion of smokers in this population is 30%, what is the population proportion attributable risk of
breast cancer due to smoking?
31%
A researcher is interested in the etiology of cervical cancer among women between 18 & 35 years of
age. Her hypothesis concerns the influence of sexually transmitted diseases such as human papilloma
virus (HPV) & subsequent development of cancer. What is the best study approach to address this
hypothesis?
Case-control study of women 18 to 35 years of age identified with cervical cancer in the hospital (cases)
compared to women admitted for other diseases (controls)
Suppose that 350 cervical cancer cases were identified & a r&om sample of women of the same age
range who were admitted to the hospital included 500 eligible controls. After independent blood tests
of all cases & controls, 90% of cases were positive for HPV antibodies while 63% of controls were
positive for antibodies to the virus. What is the appropriate ratio measure of association & its value?
The ratio of the odds of exposure among cases & controls equal to 4.1
Suppose that one third of all cervical cancer cases were smokers as were one third of all controls &
smoking status is independent of HPV infection. Is smoking a potential confounder in this study?
No, the chance of being a smoker among women with cervical cancer is the same as that of being a
smoker among women without cervical cancer
A case-control study was conducted to determine if an association exists between workers in uranium
mines & loss of fertility due to reduced sperm count. A group of 200 men with low sperm count were
identified from clinics located in areas with uranium mines. Each selected case was matched with a
r&omly selected male control on the following factors: race, age, area of residence, & smoking status.
What is the purpose of matching?Previous studies have shown that there are racial differences in low sperm count
The following numbers of matched pairs were reported: 4 matched pairs in which both men worked in
a uranium mine, 9 pairs in which the case had mine exposure but the control did not, 2 pairs in which
the case had no mine exposure but the control did, & 185 pairs in which neither man had worked in a
uranium mine. What is the odds ratio for reduced sperm count among the uranium miners?
4.5
A case-control study of the relationship between high-fat diet & diabetes was performed. The results
of the study are shown below, stratified by gender. What is the crude odds ratio for the association
between high-fat diet & diabetes in this study?
0.7
A case-control study of the relationship between high-fat diet & diabetes was performed. The results
of the study are shown below, stratified by gender. What is the odds ratio among men only?
0.5
A case-control study of the relationship between high-fat diet & diabetes was performed. The results
of the study are shown below, stratified by gender. What is the odds ratio among women only?
1.2
A case-control study of the relationship between high-fat diet & diabetes was performed. The results
of the study are shown below, stratified by gender. Based on the responses above, what is the most
appropriate measure of association to present when reporting the results of this study?
The separate stratum-specific odds ratios
A case-control study of the relationship between high-fat diet & diabetes was performed. The results
of the study are shown below, stratified by gender. Which of the following is demonstrated by the
stratified odds ratio shown above?Effect modification by gender
When incidence density sampling is used in a case-control study, which of the following is an
important consideration?
A subject selected as a control may later be selected as a case
A recent prospective study on baldness & coronary heart disease (CHD) concluded that there was no
association between the two, despite earlier cross-sectional studies which showed that baldness was
associated with CHD when the two were determined at the same time in men. Which Bradford-Hill
criterion is being tested by the newer study?
Temporality
A study examined the relation between use of estrogen replacement therapy (ERT) & ovarian cancer
mortality using a prospective design. Of 24,231 eligible women, none had a prior history of cancer,
hysterectomy, or ovarian surgery at enrollment in 1982. During 12 years of follow-up, 44 deaths from
ovarian cancer occurred. In the published results, the authors note that 12,543 were excluded from
the original cohort due to missing information for prior history variables. Which of the following is of
greatest concern when interpreting the study results?
Selection bias
A study examined the relation between use of estrogen replacement therapy (ERT) & ovarian cancer
mortality using a prospective design. Of 24,231 eligible women, none had a prior history of cancer,
hysterectomy, or ovarian surgery at enrollment in 1982. During 12 years of follow-up, 44 deaths from
ovarian cancer occurred. In the published results, the authors note that 12,543 were excluded from
the original cohort due to missing information for prior history variables.
Age at menopause is a potential factor associated with use of ERT. The study investigators created
three categories for age at menopause: less than 45 years, 46 through 54 years, & 55 years or more.
After stratifying on age at menopause, the researchers reported relative risks of 0.97, 1.00 (referent),
& 0.93 for each age group, respectively. Which of the following is true?
Age at menopause is unlikely to be a strong confounder of the relationship between ERT use & ovarian
cancer mortalityA case-control study was conducted to assess whether occupational radiation exposure among men
was associated with Down syndrome in their children. The investigators matched cases & controls on
age of the mother at childbirth by 5-year categories. Why was this done?
To adjust for potential confounding by maternal age
A case-control study was conducted to assess whether occupational radiation exposure among men
was associated with Down syndrome in their children. The investigators matched cases & controls on
age of the mother at childbirth by 5-year categories. When possible, information on paternal radiation
exposure was taken from employment records rather than from subject interviews. Why was this
done?
To minimize recall bias of exposure
An epidemiologist was interested in determining whether aspirin was associated with an increased
risk of gastrointestinal (GI) bleeding. She relied on primary physicians to identify 600 patients at a
hospital who were taking a daily dose of aspirin & 600 other patients who were not taking aspirin.
Subjects were followed for 1 year to detect any occurrences of GI bleeding. Due to publicity about the
risk of bleeding associated with aspirin, primary physicians treating patients at the hospital followed
their patients who were taking aspirin more closely than they were unexposed subjects. Which of the
following describes the impact that this may have on the epidemiologist’s study?
Would result in differential classification of outcome
An epidemiologist was interested in determining whether aspirin was associated with an increased
risk of gastrointestinal (GI) bleeding. She relied on primary physicians to identify 600 patients at a
hospital who were taking a daily dose of aspirin & 600 other patients who were not taking aspirin.
Subjects were followed for 1 year to detect any occurrences of GI bleeding. Due to publicity about the
risk of bleeding associated with aspirin, primary physicians treating patients at the hospital followed
their patients who were taking aspirin more closely than they were unexposed subjects.
Suppose that the study was repeated with a second physician who was responsible for verifying a
diagnosis of GI bleeding in the patients. This physician was informed that all patients were using
aspirin. If the likelihood of diagnosing the outcome among unexposed subjects was increased while all
other diagnostic probabilities remained the same, what impact would this have on the bias?The bias would decrease toward the null
Matching is employed in a case-control study in order to ensure that:
Variables associated with the outcome under study are controlled for in both the case & control groups
The effect of exposure to high-density automobile traffic either as a bicyclist or pedestrian was
compared to minimal or no exposure to automobile traffic. It is hypothesized that direct exposure to
automobile traffic has an effect on acute myocardial infarction (MI). This association was studied with
500 incident cases of MI diagnosed in the emergency rooms of several hospitals & compared to 1,000
other subjects who visited the same emergency rooms for reasons other than cardiovascular &
respiratory diseases. All subjects were asked to report the amount of time that they spent exposed to
high-density traffic over the past month prior to their hospital visit.
What type of study design is this?
Case-control
The effect of exposure to high-density automobile traffic either as a bicyclist or pedestrian was
compared to minimal or no exposure to automobile traffic. It is hypothesized that direct exposure to
automobile traffic has an effect on acute myocardial infarction (MI). This association was studied with
500 incident cases of MI diagnosed in the emergency rooms of several hospitals & compared to 1,000
other subjects who visited the same emergency rooms for reasons other than cardiovascular &
respiratory diseases. All subjects were asked to report the amount of time that they spent exposed to
high-density traffic over the past month prior to their hospital visit.
After completing the recruitment, the investigators compiled their data in the following table:
Using the appropriate measure of association, as compared to the group with no traffic exposure,
which of the following is a true statement concerning MI?
The estimated risk of MI was higher for those exposed rarely than for those exposed daily to automobile
traffic
The effect of exposure to high-density automobile traffic either as a bicyclist or pedestrian was
compared to minimal or no exposure to automobile traffic. It is hypothesized that direct exposure to
automobile traffic has an effect on acute myocardial infarction (MI). This association was studied with500 incident cases of MI diagnosed in the emergency rooms of several hospitals & compared to 1,000
other subjects who visited the same emergency rooms for reasons other than cardiovascular &
respiratory diseases. All subjects were asked to report the amount of time that they spent exposed to
high-density traffic over the past month prior to their hospital visit.
Which of the following may explain the reason for the observed association?
Confounding by exercise level for those with daily exposure to automobile traffic
Which of the following is an advantage of the case-control study design?
It is possible to study more than one exposure
A large case-control study using multiple recruitment centers was conducted comparing 2,987 lung
smoker cases to 3,013 other hospitalized persons selected as controls. One objective was to study the
association between occupational exposure to chemicals & lung cancer. After compiling the data, the
investigators noted that 90% of persons with lung cancer were smokers while 67% of the controls
were smokers. The most practical & efficient way to eliminate differences between the cases &
controls with regard to smoking would be to:
Classify subjects according to smoking status & compare occupational chemical exposures by each
stratum of smoking
An investigator is interested in studying the adverse effects of exposure to toxic metals on neurologic
diseases such as Alzheimer’s disease. In assessing this risk, all of the following are important
considerations for a prospective study design except:
The difficulty in finding sufficient numbers of persons with neurologic disease in whom past metal
exposures could be measured at the beginning of the study
A history of dietary supplement with calcium was recorded among 10,000 women over the age of 50.
The women were followed for 2 years to determine if they experienced hip fracture. Calcium
supplementation was reported by 31% of women who experienced hip fracture & by 46% of all other
women. In a case-control study with equal numbers of cases & controls, what is the number of
women with a hip fracture who are not taking calcium supplements?
3,450A history of dietary supplement with calcium was recorded among 10,000 women over the age of 50.
The women were followed for 2 years to determine if they experienced hip fracture. Calcium
supplementation was reported by 31% of women who experienced hip fracture & by 46% of all other
women. What are the odds of a hip fracture among women who are taking calcium supplements?
0.67
A history of dietary supplement with calcium was recorded among 10,000 women over the age of 50.
The women were followed for 2 years to determine if they experienced hip fracture. Calcium
supplementation was reported by 31% of women who experienced hip fracture & by 46% of all other
women. What is the measure of association between calcium supplementation & hip fracture?
Odds ratio = 0.53
In a study of 100 cases of colon cancer in women, there were 200 age- & race-matched controls. The
suspected etiologic factor was higher-than-average consumption of red meat. The absolute risk of
colon cancer in persons with this level of consumption is:
Cannot be calculated
Why are controls needed in a case-control study?
They do not have the outcome of interest & allow for estimation of exposure frequency among those
without the disease
When is odds ratio obtained in a case-control study a reliable approximation of the relative risk for
the general population?
The exposure distribution among cases is representative of all persons with disease
The exposure opportunity for controls is equivalent to the distribution of exposure opportunities for the
population without the disease
When the disease under investigation is rare in the population (All of the above)
In a published epidemiologic study investigating infertility related to sexually transmitted diseases
(STD), the authors state that 5% of identified cases refused enrollment, 10% of identified cases were
lost to follow-up prior to data collection, & 10% of interviewed cases had missing data for one or more
key variables describing exposure. Based on this information, which of the following statements is
most likely to be true?There is a potential for selection bias which could be differential with respect to cases & controls
In a published epidemiologic study investigating infertility related to sexually transmitted diseases
(STD), the authors state that 5% of identified cases refused enrollment, 10% of identified cases were
lost to follow-up prior to data collection, & 10% of interviewed cases had missing data for one or more
key variables describing exposure. After data were gathered for the study, the investigators decided
to restrict the analysis to women only, rather than including both men & women in the study.
Assuming that sex is a confounder of the exposure–disease relationship under investigation, this
decision would have which of the following effects?
Increase internal validity
In a published epidemiologic study investigating infertility related to sexually transmitted diseases
(STD), the authors state that 5% of identified cases refused enrollment, 10% of identified cases were
lost to follow-up prior to data collection, & 10% of interviewed cases had missing data for one or more
key variables describing exposure.
In the primary analysis of the study, the investigators measured exposure as a dichotomous variable
(any history of STD compared to no history of STD). In subsequent analyses, the investigators looked
at the relationship between specific STDs & infertility. They noted the following measures of
association: for past history of gonorrhea, the odds ratio was 2.4 with a 95% confidence interval of 1.3
to 4.4. For past history of chlamydia, the odds ratio was 1.8 with a 95% confidence interval from 1.2 to
2.1. These results indicate that:
The odds ratio for chlamydia is more precise than the odds ratio for gonorrhea
If an investigator is analyzing the results of a clinical trial, then applying the “intention to treat” rule
means that which type of bias is most likely to result?
Misclassification bias
Investigators wanted to know if some military personnel are more error prone than others & would
be a poor risk for training as a pilot. A study was done in which individuals who had injuries during
basic training were compared to individuals who had not had an injury during training. Both groups
were asked to recall episodes during childhood when they had had accidents that resulted in an
injury. The individuals with a training injury reported more incidents during childhood when they had
an injury. Therefore, the military comm& concluded that some persons are more likely to be errorprone & that individuals with a childhood injury should be excluded from pilot training.
One comm&ing officer disagreed with this conclusion. He asked the investigators to design a second
study in which all individuals were asked about childhood injuries prior to the start of basic training.
The group who reported having a childhood injury was compared to the group who had not had a
childhood injury to determine which group had a higher rate of injuries during basic training. At the
end of follow-up, there was no difference in the rate of injuries experienced by each group.
What type of design was used for the first study?
Case-control
Investigators wanted to know if some military personnel are more error prone than others & would
be a poor risk for training as a pilot. A study was done in which individuals who had injuries during
basic training were compared to individuals who had not had an injury during training. Both groups
were asked to recall episodes during childhood when they had had accidents that resulted in an
injury. The individuals with a training injury reported more incidents during childhood when they had
an injury. Therefore, the military comm& concluded that some persons are more likely to be error
prone & that individuals with a childhood injury should be excluded from pilot training.
One comm&ing officer disagreed with this conclusion. He asked the investigators to design a second
study in which all individuals were asked about childhood injuries prior to the start of basic training.
The group who reported having a childhood injury was compared to the group who had not had a
childhood injury to determine which group had a higher rate of injuries during basic training. At the
end of follow-up, there was no difference in the rate of injuries experienced by each group.
What type of study design was used for the second study?
Prospective cohort
Investigators wanted to know if some military personnel are more error prone than others & would
be a poor risk for training as a pilot. A study was done in which individuals who had injuries during
basic training were compared to individuals who had not had an injury during training. Both groups
were asked to recall episodes during childhood when they had had accidents that resulted in an
injury. The individuals with a training injury reported more incidents during childhood when they had
an injury. Therefore, the military comm& concluded that some persons are more likely to be error
prone & that individuals with a childhood injury should be excluded from pilot training.
One comm&ing officer disagreed with this conclusion. He asked the investigators to design a second
study in which all individuals were asked about childhood injuries prior to the start of basic training.
The group who reported having a childhood injury was compared to the group who had not had achildhood injury to determine which group had a higher rate of injuries during basic training. At the
end of follow-up, there was no difference in the rate of injuries experienced by each group.
Which study better tests the hypothesis that there is a relationship between childhood injury &
subsequent injury during basic training?
Prospective cohort study
Investigators wanted to know if some military personnel are more error prone than others & would
be a poor risk for training as a pilot. A study was done in which individuals who had injuries during
basic training were compared to individuals who had not had an injury during training. Both groups
were asked to recall episodes during childhood when they had had accidents that resulted in an
injury. The individuals with a training injury reported more incidents during childhood when they had
an injury. Therefore, the military comm& concluded that some persons are more likely to be error
prone & that individuals with a childhood injury should be excluded from pilot training.
One comm&ing officer disagreed with this conclusion. He asked the investigators to design a second
study in which all individuals were asked about childhood injuries prior to the start of basic training.
The group who reported having a childhood injury was compared to the group who had not had a
childhood injury to determine which group had a higher rate of injuries during basic training. At the
end of follow-up, there was no difference in the rate of injuries experienced by each group.
Which of the following may explain why the two studies observed different results concerning the
association between childhood injury & training injury?
Potential recall bias in the case-control study
In a study of oral contraceptive (OC) use & hypertension, male interviewers for the study found a
lower prevalence of OC use among participants than did female interviewers using the same
questionnaire. Which term best describes this finding?
Nondifferential misclassification
A matched case-control study of sunscreen use during childhood & melanoma results in an odds ratio
of 1.0. Cases of melanoma were matched by sex & race to controls who were identified by r&om digit
dialing. What is the most likely explanation for the study’s null finding?
Information bias concerning past sunscreen useAmong patients with liver cancer, current alcohol drinkers have a worse prognosis for survival than
nondrinkers. What would be the impact on the odds ratio for a case-control study of current alcohol
use & liver cancer mortality if prevalent cases were included with incident cases of the cancer?
Decrease the odds ratio when prevalent cases are included
In a cohort study, the reported relative risk was 2.0; however, the investigators concluded that the
study likely had a bias away from the null hypothesis, but they concluded that an association did exist
between the exposure & the outcome. The true relative risk is most likely:
1.5
In a case-control study of maternal cigarette smoking as a risk factor for low birth weight, the
investigators concluded that mothers of children with low birth weight were more likely to report
smoking during pregnancy relative to mothers of children with normal birth weight. The reporting
error most likely caused the odds ratio to:
Increase above the true value
In a case-control study of obesity & adult-onset asthma, controls are matched to cases on the basis of
race & gender. This approach to selection is intended to decrease the influence of which type of bias?
Confounding
In a case-control study of computer display exposure & glaucoma, cases & controls were also asked
about television watching habits. Errors in recall of exposure to video screens occurred with equal
frequency among cases & controls. Which one of the following biases likely occurred?
Nondifferential misclassification
In a case-control study of computer display exposure & glaucoma, cases & controls were also asked
about television watching habits. Errors in recall of exposure to video screens occurred with equal
frequency among cases & controls. What is the most likely effect of this bias on the measure of
association reported by the study?Underestimated the true relationship
In a case-control study of computer display exposure & glaucoma, cases & controls were also asked
about television watching habits. Errors in recall of exposure to video screens occurred with equal
frequency among cases & controls. Which of the following methods for adjusting for confounding by
age is most likely to affect the generalizability of the study findings?
Restriction of study subjects to those less than 50 years old
In a cohort study of occupational exposure to a chemical & subsequent incidence of bladder cancer, all
workers who smoked were more likely to die of other causes before bladder cancer was diagnosed.
What was the effect of this premature mortality on the measure of association reported by the study?
Underestimated the true relationship
Which of the following statements about person-years is not true?
It is a valid denominator for estimates of risk for individuals
Chapters 16-20
A large company institutes a new wellness program aimed at improving the health of its 50,000
employees. As a part of the program, all employees are given physical examinations & screening tests.
One of the tests given to male employees is the prostate specific antigen (PSA) test with all employees
testing positive being referred to their private physician for a thorough examination involving the
st&ard test, a digital rectal examination (DRE). What will happen to the apparent incidence rate of
prostate cancer in the company during the first year of this program?
Incidence rate will increase
A large company institutes a new wellness program aimed at improving the health of its 50,000
employees. As a part of the program, all employees are given physical examinations & screening tests.
One of the tests given to male employees is the prostate specific antigen (PSA) test with all employees
testing positive being referred to their private physician for a thorough examination involving the
st&ard test, a digital rectal examination (DRE). On referral to their private physician, approximately30% of men with a positive PSA are found to be negative for prostate cancer following the DRE. What
is the sensitivity of the PSA test if DRE is assumed to be the gold st&ard?
Cannot be calculated due to missing information
The following table shows data describing age-st&ardized incidence rates for cervical & breast cancer
among Irish women living in Irel&, Irish immigrants to the United States, & daughters of Irish
immigrants in the United States. The rates are reported for two age categories: adult women younger
than 40 years of age & older than 40 years of age. Which cancer appears to be determined primarily
by environmental factors?
Cervical
The following table shows data describing age-st&ardized incidence rates for cervical & breast cancer
among Irish women living in Irel&, Irish immigrants to the United States, & daughters of Irish
immigrants in the United States. The rates are reported for two age categories: adult women less than
40 years of age & greater than 40 years of age. Which cancer appears to be determined primarily by
genetic factors?
Neither
The following table shows data describing age-st&ardized incidence rates for cervical & breast cancer
among Irish women living in Irel&, Irish immigrants to the United States, & daughters of Irish
immigrants in the United States. The rates are reported for two age categories: adult women less than
40 years of age & greater than 40 years of age. Among women less than 40 years of age, what is the
relative risk for cervical cancer comparing daughters of Irish immigrants to women in Irel&?
1.50The following table shows data describing age-st&ardized incidence rates for cervical & breast cancer
among Irish women living in Irel&, Irish immigrants to the United States, & daughters of Irish
immigrants in the United States. The rates are reported for two age categories: adult women less than
40 years of age & greater than 40 years of age. What is the proportion of cervical cancer risk in Irish
women under 40 years of age that is attributable to moving to the United States?
24%
The following table shows data describing age-st&ardized incidence rates for cervical & breast cancer
among Irish women living in Irel&, Irish immigrants to the United States, & daughters of Irish
immigrants in the United States. The rates are reported for two age categories: adult women less than
40 years of age & greater than 40 years of age. Which cancer has a greater risk after the onset of
menopause?
Breast
The data in the table below are from a case-control study of a genetic factor associated with
neurologic disease. Cases are newly diagnosed persons with the rare neurologic condition, &
population controls were used for comparison. Investigators have hypothesized that a single point
mutation in a gene on the 10th chromosome is strongly related to the disease. In the table, subjects
who are homozygous for the mutation are denoted as m/m; subjects with only one mutated gene
(heterozygous for the mutation) are denoted as A/m; & subjects with two normal alleles (homozygous
for the absence of the mutation) are denoted as A/A. The unexposed category for the study is the A/A
genotype. The neurologic condition is thought to be autosomal dominant with respect to the gene;
therefore, one copy of the m allele should induce the development of the condition. What is the odds
ratio for subjects with at least one copy of the mutant allele?
75.4
The data in the table below are from a case-control study of a genetic factor associated with
neurologic disease. Cases are newly diagnosed persons with the rare neurologic condition, &
population controls were used for comparison. Investigators have hypothesized that a single point
mutation in a gene on the 10th chromosome is strongly related to the disease. In the table, subjects
who are homozygous for the mutation are denoted as m/m; subjects with only one mutated gene
(heterozygous for the mutation) are denoted as A/m; & subjects with two normal alleles (homozygousfor the absence of the mutation) are denoted as A/A. The unexposed category for the study is the A/A
genotype. The neurologic condition is thought to be autosomal dominant with respect to the gene;
therefore, one copy of the m allele should induce the development of the condition.
Using the odds ratio calculated above, what is the population attributable risk percent for the
mutation?
89%
The data in the table below are from a case-control study of a genetic factor associated with
neurologic disease. Cases are newly diagnosed persons with the rare neurologic condition, &
population controls were used for comparison. Investigators have hypothesized that a single point
mutation in a gene on the 10th chromosome is strongly related to the disease. In the table, subjects
who are homozygous for the mutation are denoted as m/m; subjects with only one mutated gene
(heterozygous for the mutation) are denoted as A/m; & subjects with two normal alleles (homozygous
for the absence of the mutation) are denoted as A/A. The unexposed category for the study is the A/A
genotype. The neurologic condition is thought to be autosomal dominant with respect to the gene;
therefore, one copy of the m allele should induce the development of the condition.
Does this study confirm the hypothesis that the condition is caused by an autosomal dominant
mutation? Why or why not?
No, the odds of disease among heterozygotes is 0.46
The basis for the healthy worker effect is that:
Employment status is correlated with health status
Epidemiologists were interested in investigating the relationship between exercise & development of
coronary heart disease (CHD) among women. Women ages 45 to 55 years were interviewed to
determine their exercise habits at entry into the study. They were then followed for 15 years to
determine the incidence of CHD in the cohort. What proportion of women who developed CHD had
exercised once per week?The best answer is 60%. 67 cases of CHD occurred during the 15-year follow-up period. 40 of the cases
(60%) developed in women who exercised once per week
Epidemiologists were interested in investigating the relationship between exercise & development of
coronary heart disease (CHD) among women. Women ages 45 to 55 years were interviewed to
determine their exercise habits at entry into the study. They were then followed for 15 years to
determine the incidence of CHD in the cohort. Complete the table by calculating the incidence rates
per 10,000 person-years & the rate ratios.
Rates per 10,000 person-years: 7.00, 3.41, 1.59 by increasing exercise frequency.
Rate Ratios: Referent, 0.49, 0.23 by increasing exercise frequency.
To calculate the rates per 10,000 person-years, divide the number of incident CHD cases by the total
person-years exposed & multiply by 10,000 to st&ardize the rates. For example, among women who
reported no exercise, 23 cases divided by 32,843 person-years gives a rate of 0.0007 events per personyear. After multiplying by 10,000, the rate equals 7.00 events per 10,000 person-years.
To estimate the rate ratio, one group must be designated the referent group. All estimated ratios are
relative to this group’s rate. In this study, the nonexposed group was comprised of women who
reported no exercise at baseline. The rate ratio comparing the group exercising once per week to this
referent category equals 3.41 divided by 7.00, or 0.49.
Epidemiologists were interested in investigating the relationship between exercise & development of
coronary heart disease (CHD) among women. Women ages 45 to 55 years were interviewed to
determine their exercise habits at entry into the study. They were then followed for 15 years to
determine the incidence of CHD in the cohort. The investigators concluded that these data
demonstrate a causal relationship between exercise & subsequent CHD. Which of the Hill criteria best
applies to this data?
Dose-response
Epidemiologists were interested in investigating the relationship between exercise & development of
coronary heart disease (CHD) among women. Women ages 45 to 55 years were interviewed to
determine their exercise habits at entry into the study. They were then followed for 15 years to
determine the incidence of CHD in the cohort. Other epidemiologists disagreed that this was a causal
finding. What error do they claim that the study investigators made when interpreting the study
findings?
Exposure is likely to be misclassified during the follow-up period
A cross-sectional study finds that persons younger than 70 years of age have a higher prevalence of
pneumonia than those older than age 70. Which of the following is the best explanation for this
observation?Incidence rates may be equal in both age categories; however, persons older than 70 have a shorter
duration of pneumonia compared to those younger than 70
Meat consumption may be a risk factor for colon cancer. This hypothesis was investigated by
collecting data on the amount of red meat consumed in regions of the United States & the colon
cancer rates in those areas. The data are shown below:
From this data, the researchers concluded that there is a significant dose-response association
between red meat consumption & incident colon cancer. This observation may be incorrect because:
The meat consumption habits of persons with colon cancer are not reported
Meat consumption may be a risk factor for colon cancer. This hypothesis was investigated by
collecting data on the amount of red meat consumed in regions of the United States & the colon
cancer rates in those areas. The data are shown below:
Case-control study
Retrospective cohort study
Prospective cohort study (All of the above)
Which of the following are characteristics of a disease that are important for the conduct of an
effective screening program? More than one answer may be correct.
High prevalence of the disease
The disease has a severe effect on health
Treatment reduces the duration of the disease
Which factor can increase the positive predictive value (PPV) estimated for a screening program?
Selection of a screening population at high risk for the disease
When evaluating disease screening programs, what is a potential bias of the measure of their
effectiveness when compared to symptom-based diagnostic approaches?Lead-time bias due to early detection of incurable disease
What is the epidemiologic transition?
Reduction in proportion of deaths due to infectious diseases in the first part of the 20th century
For a cross-sectional study to be a valid test of a hypothesis, which of the following must be true?
Exposure is constant over time
Which of the following measures is best suited to the evaluation of a screening program over time?
Cause-specific mortality rate
After a hospital in a major city adds a high-risk pregnancy & neonatal intensive care unit (NICU), the
rate of adverse childbirth outcomes doubles. Administrators are concerned that this indicates that the
new unit is ineffectively run. Which of the following is a reason that this concern may be unfounded?
The type of population served by the new unit has changed
In a study of immigrants to a new country, the rate of cardiovascular disease (CVD) in migrants is
equivalent to the rate of CVD in their home country. This rate is lower than the rate for first
generation family members & for their country of adoption. Which of the following could explain this
observation?
Migrants tend to maintain similar lifestyles to their country of origin
A large cohort study of 1,000 adult pairs of twins was conducted. Seventy-two pairs of twins were
concordant for the disease under investigation, & 94 pairs of twins were discordant for the disease. In
the remaining twin pairs, neither adult had the disease. What is the concordance rate for this disease
among all twin pairs with at least one affected member?
43%A large cohort study of 1,000 adult pairs of twins was conducted. 72 pairs of twins were concordant
for the disease under investigation while 94 pairs of twins were discordant for the disease. In the
remaining twin pairs, neither adult had the disease. From this observation, what is the most likely
interpretation?
Cannot be determined from these data
Within a large manufacturing company, the division responsible for the production of agricultural
chemicals has an annual rate of lung cancer equal to 17.3 cases per 100,000 persons. The rate of lung
cancer for the rest of the company not exposed to agricultural chemical production is 13.6 cases per
100,000 persons. What inference can be made concerning the association of agricultural chemical
production & lung cancer within this company?
The association is not real due to confounding by other risk factors for lung cancer
For an etiologic factor to be judged to be causally related to a disease, which of the following must be
true?
Exposure to the etiologic factor must precede the onset of the disease
[Show More]