Mathematics > QUESTIONS & ANSWERS > MATH 225N – MATH CHAMBERLAIN COLLEGE OF NURSING Week 8 questions and answers (All)
MATH 225N – MATH CHAMBERLAIN COLLEGE OF NURSING Week 8 questions and answers
Document Content and Description Below
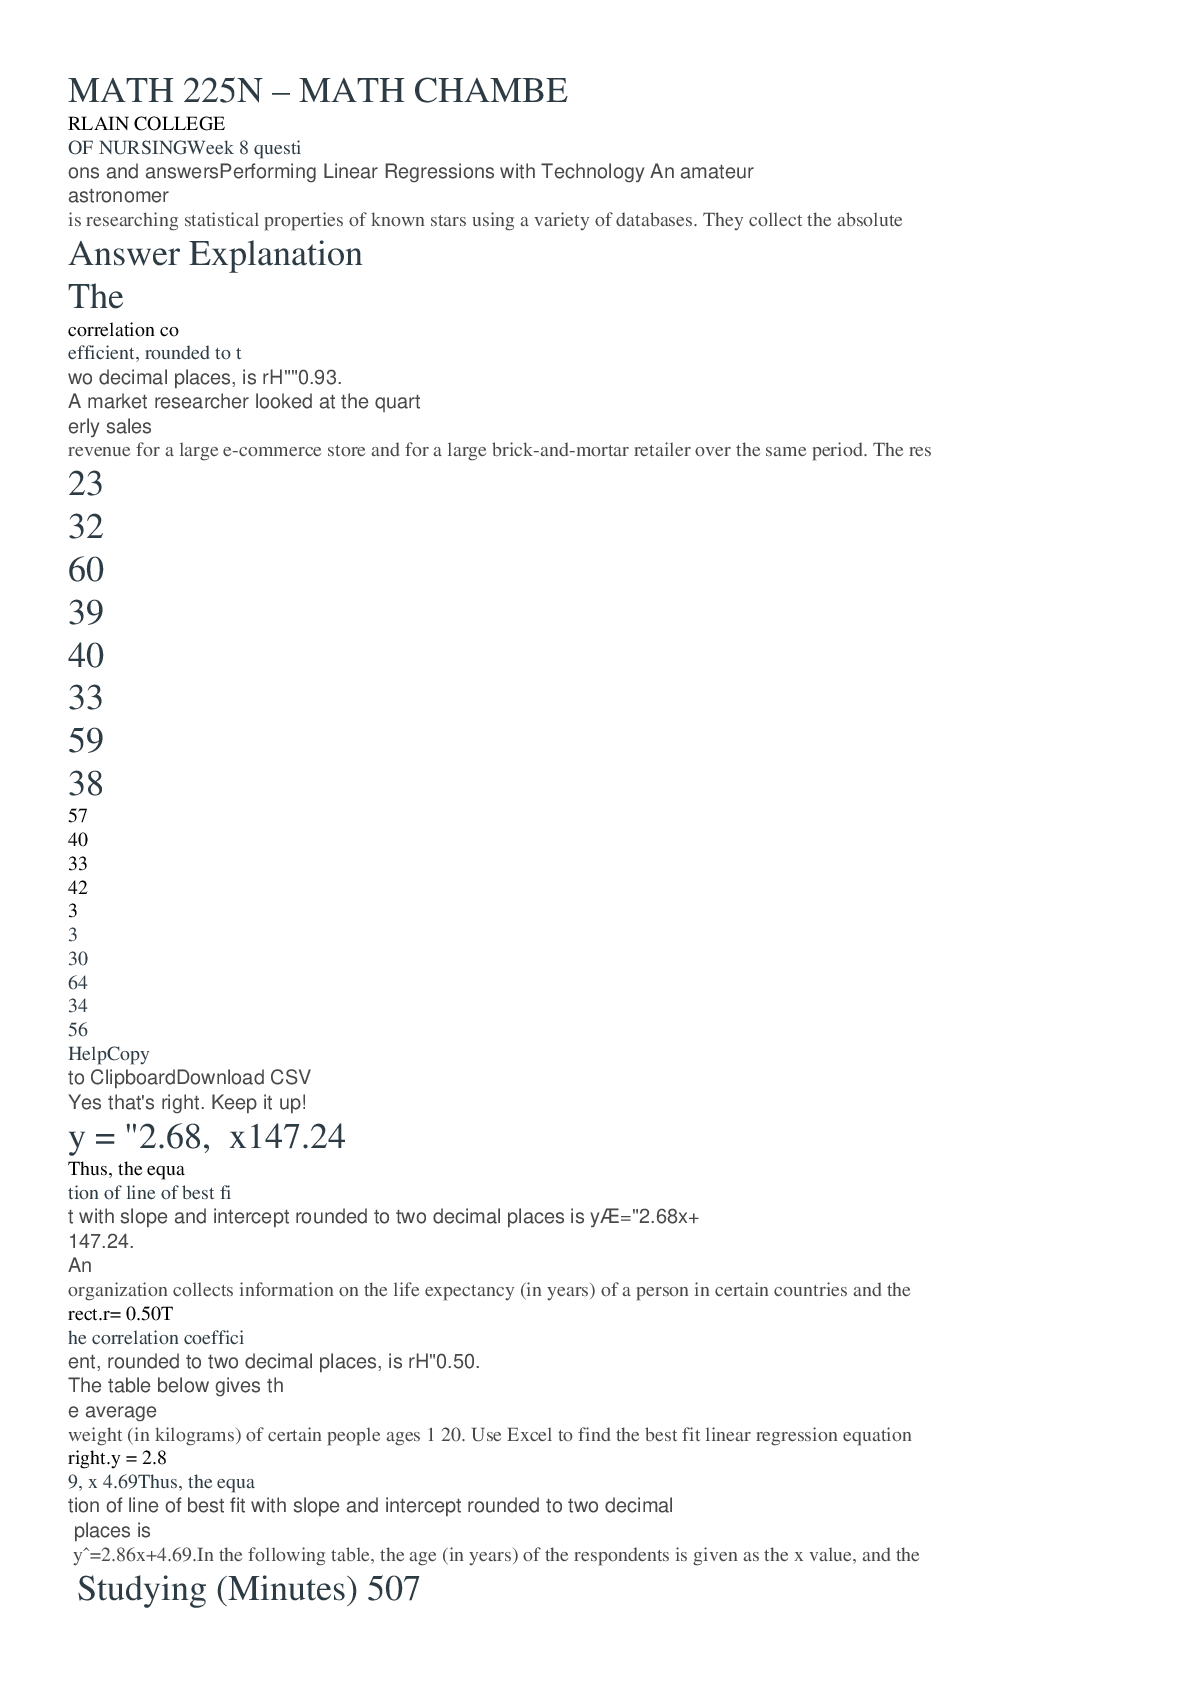
Performing Linear Regressions with Technology An amateur astronomer is researching statistical properties of known stars using a variety of databases. They collect the absolute magnitude or MV and... stellar mass or M⊙ for 30 stars. The absolute magnitude of a star is the intensity of light that would be observed from the star at a distance of 10 parsecs from the star. This is measured in terms of a particular band of the light spectrum, indicated by the subscript letter, which in this case is V for the visual light spectrum. The scale is logarithmic and an MV that is 1 less than another comes from a star that is 10 times more luminous than the other. The stellar mass of a star is how many times the sun's mass it has. The data is provided below. Use Excel to calculate the correlation coefficient r between the two data sets, rounding to two decimal places. A market researcher looked at the quarterly sales revenue for a large e-commerce store and for a large brick-and-mortar retailer over the same period. The researcher recorded the revenue in millions of dollars for 30 quarters. The data are provided below. Use Excel to calculate the correlation coefficient r between the two data sets. Round your answer to two decimal places. The table below contains the geographic latitudes, x, and average January temperatures, y, of 20cities. Use Excel to find the best fit linear regression equation. Round the slope and intercept to two decimal places. x y 46 23 32 60 39 40 33 59 38 57 40 33 42 33 30 64 34 56 HelpCopy to ClipboardDownload CSV An organization collects information on the life expectancy (in years) of a person in certain countries and the fertility rate per woman in those countries. The data for 21 randomly selected countries for the year 2011 is given below. Use Excel to find the best fit linear regression equation, where fertility rate is the explanatory variable. Round the slope and intercept to two decimal places. An economist is trying to understand whether there is a strong link between CEO pay ratio and corporate revenue. The economist gathered data including the CEO pay ratio and corporate revenue for 30 companies for a particular year. The pay ratio data is reported by the companies and represents the ratio of CEO compensation to the median employee salary. The data are provided below. Use Excel to calculate the correlation coefficient r between the two data sets. Round your answer to two decimal places. A researcher is interested in whether the variation in the size of human beings is proportional throughout each part of the human. To partly answer this question they looked at the correlation between the foot length (in millimeters) and height (in centimeters) of 30 randomly selected adult males. The data is provided below. Use Excel to calculate the correlation coefficient r between the two data sets. Round your answer to two decimal places The table below gives the average weight (in kilograms) of certain people ages 1–20. Use Excel to find the best fit linear regression equation, where age is the explanatory variable. Round the slope and intercept to two decimal places. In the following table, the age (in years) of the respondents is given as the x value, and the earnings (in thousands of dollars) of the respondents are given as the y value. Use Excel to find the best fit linear regression equation in thousands of dollars. Round the slope and intercept to three decimal places PREDICITONS USING LINEAR REGRESSION Question The table shows data collected on the relationship between the time spent studying per day and the time spent reading per day. The line of best fit for the data is yˆ=0.16x+36.2. Assume the line of best fit is significant and there is a strong linear relationship between the variables Studying (Minutes) 507090110 Reading (Minutes) 44485054 (a) According to the line of best fit, what would be the predicted number of minutes spent reading for someone who spent 67 minutes studying? Round your answer to two decimal places. Substitute 67 for x into the line of best fit to estimate the number of minutes spent reading for someone who spent 67 minutes studying: yˆ=0.16(67)+36.2=46.92. Question The table shows data collected on the relationship between the time spent studying per day and the time spent reading per day. The line of best fit for the data is yˆ=0.16x+36.2. Nomenclature • When using regression lines to make predictions, if the x-value is within the range of observed x-values, one can conclude the prediction is both reliable and reasonable. That is, the prediction is accurate and possible. For example, if a prediction were made using x=1995 in the video above, one could conclude the predicted y-value is both reliable (quite accurate) and reasonable (possible). This is an example of interpolation. • When using regression lines to make predictions, if the x-value is outside the range of observed x-values, one cannot conclude the prediction is both reliable and reasonable. That is, the prediction is will be much less accurate and the prediction may, or may not, be possible. For example, x=2020 is not within the range of 1950 to 2000. Therefore, the prediction is much less reliable (not as accurate) even though it is reasonable (it is possible that a person will live to be 79.72 years old). This is an example of extrapolation. Reasonable Predictions Note that not all predictions are reasonable using Question Erin is studying the relationship between the average number of minutes spent reading per day and math test scores and has collected the data shown in the table. The line of best fit for the data is yˆ=0.8x+51.2. According to the line of best fit, what would be the predicted test score for someone who spent 70 minutes reading? Is it reasonable to use this line of best fit to make this prediction? Minutes 3035404550 Test Score 7578858890 ________________________________________ That's not right - let's review the answer. ________________________________________ The predicted test score is 95.2, and the estimate is not reasonable. The predicted test score is 95.2, and the estimate is reasonable. The predicted test score is 107.2, and the estimate is not reasonable. The predicted test score is 107.2, and the estimate is reasonable Data is collected on the relationship between the average number of minutes spent exercising per day and math test scores. The data is shown in the table and the line of best fit for the data is yˆ=0.42x+64.6. Assume the line of best fit is significant and there is a strong linear relationship between the variables. Minutes 25303540 Test Score 75778081 (a) According to the line of best fit, what would be the predicted test score for someone who spent 38 minutes exercising? Round your answer to two decimal places. ________________________________________ What is the value of the intercept of the regression line, b rounded to one decimal place. Linear Regression Equations The scatter plot below shows data relating competitive chess players' ratings and their IQ. Which of the following patterns does the scatter plot show? Correct! You nailed it. ________________________________________ positive linear pattern positive linear pattern with deviations negative linear pattern negative linear pattern with deviations no pattern Answer Explanation Correct answer: no pattern Here, there is no visible pattern or relationship between the x-values (IQ) and y-values (chess ratings). Jamie owns a house painting service. For each house, she charges $70 plus $40 per hour of work. A linear equation that expresses the total amount of money Jamie earns per house is y=70+40x. What are the independent and dependent variables? What is the y-intercept and the slope? ________________________________________ Well done! You got it right. ________________________________________ The independent variable (x) is the amount, in dollars, Jamie earns for a house. The dependent variable (y) is the amount of time Jamie paints a house. Jamie charges a one-time fee of $40 (this is when x=0), so the y-intercept is 40. Jamie earns $70 for each hour she works, so the slope is 70. The independent variable (x) is the amount, in dollars, Jamie earns for a house. The dependent variable (y) is the amount of time Jamie paints a house. Jamie charges a one-time fee of $70 (this is when x=0), so the y-intercept is 70. Jamie earns $40 for each hour she works, so the slope is 40. The independent variable (x) is the amount of time Jamie paints a house. The dependent variable (y) is the amount, in dollars, Jamie earns for a house. Jamie charges a one-time fee of $40 (this is when x=0), so the y-intercept is 40. Jamie earns $70 for each hour she works, so the slope is 70. The independent variable (x) is the amount of time Jamie paints a house. The dependent variable (y) is the amount, in dollars, Jamie earns for a house. Jamie charges a one-time fee of $70 (this is when x=0), so the y-intercept is 70. Jamie earns $40 for each hour she works, so the slope is 40. Answer Explanation Correct answer: The independent variable (x) is the amount of time Jamie paints a house. The dependent variable (y) is the amount, in dollars, Jamie earns for a house. Jamie charges a one-time fee of $70 (this is when x=0), so the y-intercept is 70. Jamie earns $40 for each hour she works, so the slope is 40. The independent variable (x) is the amount of time Jamie paints a house because it is the value that changes. She may work different amounts per house, and her earnings are dependent on how many hours she works. This is why the amount, in dollars, Jamie earns for a house is the dependent variable (y). The y-intercept is 70 (b=70). This is her one-time fee. The slope is 40 (a=40). This is the increase for each hour she works. George is an avid plant lover and is concerned about the lack of daffodils that grow in his backyard. He finds the growth of the daffodils, G, is dependent on the percent of aluminum measured in the soil, x, and can be modeled by the function G(x)=16−4x. Draw the graph of the growth function by plotting its G-intercept and another point. ________________________________________ Correct! You nailed it. ________________________________________ 0, 16 4, 0 Answer Explanation $$0, 16 $$7, −12 The function G(x)=16−4x is a linear equation, so its graph is a straight line that can be drawn by plotting 2 points and connecting them. Its G intercept occurs when x=0, so G(0)=16, and (0,16) is the G-intercept. To find another point, plug in another x value into the function G(x). For example, when x=7, we have G(7)=16−4(7)=−12. So, (7,−12) is another point on the graph of G(x). What percent of aluminum in the soil must there be for the daffodils to grow only by 5 centimeters? • Round your final answer to the nearest whole number. ________________________________________ Great work! That's correct. ________________________________________ 3 percent Answer Explanation For the daffodils to grow only by 5 centimeters, the growth must be 5. So, we must find the percent of aluminum in the soil, x, so that G(x)=5. For G(x)=5, we have 16−4x=5, −4x=−11, x=−11/−4, x=2.75, x≈3. The scatter plot below shows data relating total income and the number of children a family has. Which of the following patterns does the scatter plot show? A scatterplot has a horizontal axis labeled Number of children from negative 1 to 7 in increments of 1 and a vertical axis labeled Income left-parenthesis thousands right-parentheses from 0 to 200 in increments of 50. A series of plotted points loosely forms a line that falls from left to right and passes through the points left-parenthesis 0 comma 180 right-parentheses and left-parenthesis 6 comma 25 right-parentheses. All coordinates are approximate. ________________________________________ Perfect. Your hard work is paying off ? ________________________________________ Positive linear pattern Positive linear pattern with deviations Negative linear pattern Negative linear pattern with deviations No pattern Answer Explanation Correct answer: Negative linear pattern with deviations We can see that as the x-values (number of children) increase, the y-values (income) decrease. So it is a negative relationship. But there are points that deviate from the negative linear pattern, so it is a weaker pattern, instead of a strong one. Question A gym teacher finds that the distance students run in miles per week in gym class, D, is dependent on the time students warm-up beforehand in minutes per week, x, and can be modeled by the function D(x)=2+0.5x. Draw the graph of the distance function by plotting its D-intercept and another point. Answer 1: ________________________________________ That's not right - let's review the answer. ________________________________________ $$0, 14 $$11, 3 Answer 2: ________________________________________ Not quite - review the answer explanation to help get the next one. ________________________________________ 0, 14 11, 3 Answer Explanation 0, 2 6, 5 The function D(x)=2+0.5x is a linear equation, so its graph is a straight line that can be drawn by plotting 2 points and connecting them. Its D intercept occurs when x=0, so D(0)=2, and (0,2) is the D-intercept. To find another point, plug in another x value into the function D(x). For example, when x=6, we have D(6)=2+0.5(6)=5. So, (6,5) is another point on the graph of D(x) How long did a student warm-up in order for them to run 10 miles per week in gym class? ________________________________________ Great work! That's correct. ________________________________________ $$16 minutes Answer Explanation Correct answers: • $16\ \text{minutes}$16 minutes For a student to run 10 miles per week in gym class, the distance must be 10. So, we must find the amount of warm-up time, x, so that D(x)=10. For D(x)=10, we have, 2+0.5x=10, 0.5x=8, x=8/0.5=16. An owner of multiple online clothing stores explored the relationship between the percent of on-call service representatives and the percent of purchases over $75 at the same stores. The owner collects information from 6of their online stores, shown in the table below. Use the graph below to plot the points and develop a linear relationship between the percent of on-call service representatives and the percent of purchases over $75. Store Number % of On-call service reps % of purchase over $75 1 20 20 2 35 25 3 50 40 4 55 35 5 60 40 6, 75, 34 ________________________________________ Yes that's right. Keep it up! ________________________________________ The percent of on-call service representatives is the x-coordinate, while the percent of purchases over $75 is the y-coordinate. So, the table of values corresponds to the points (20,20), (35,25), (50,40), (55,35), (60,40), (75,54). ON THIS QUESTION, IT’S ASKING YOU TO GRAPH THE %OF ONCALL SRVC WITH %OF PURCHASE Using the linear relationship graphed above, estimate the percent of over $75 purchases if there are 40% on-call service representatives. Answer 1: ________________________________________ Not quite - review the answer explanation to help get the next one. ________________________________________ $$60% Answer 2: ________________________________________ That's not right - let's review the answer. ________________________________________ $$67.5% Answer Explanation Correct answers: • 30% Based on the linear relationship that is graphed, when the percent of on-call service representatives is 40%, the line has a value between 25 and 35. A government agency explored the relationship between the percent of companies that are technology related and the percent of higher paying jobs. The researchers collects information from 5 states, shown in the table below. Use the graph below to plot the points and develop a linear relationship between the percent of technology companies and the percent of higher paying jobs. State number % of tech com. % of higher paying jobs 1 20 25 2 35 30 3 50 45 4 55 65 5 60 70 Answer 2: ________________________________________ Great work! That's correct. ________________________________________ Answer Explanation The percent of tech companies is the x-coordinate, while the percent of higher paying jobs is the y-coordinate. So, the table of values corresponds to the points (20,25), (35,30), (50,45), (55,65), (60,70). Using the linear relationship graphed above, estimate the percent of higher paying jobs if there are 30% technology companies. ________________________________________ Well done! You got it right. ________________________________________ 32.5% Answer Explanation Correct answers: • 30% Based on the linear relationship that is graphed, when the percent of technology companies is 30%, the line has a value between 25 and 35. Question: A random sample of 11 employees produced the following data where x is the number of shifts worked in 8 weeks, and y is the number of breaks taken. X = explanatory variable Y = outcome of the study # of breaks taken per shifts worked x y 27 15 29 19 30 19 32 17 33 20 35 22 36 20 37 23 39 22 21 24 43 20 What is the equation of the regression line? y = 0.381z + 6.9 Question: A random sample of 11 university students produced the following data where x is the minutes spent studying per day, and y is the first exam score (out a maximum of 100 points). x y 11 39 13 55 14 43 17 46 19 69 22 75 24 77 25 78 28 77 31 93 34 92 What is the value of the intercept of the regression line, b rounded to one decimal place. Answer: 16.4 Independent (x) Dependent (y) 11 39 Slope (β1) 2.369324 13 55 y-Intercept (β0) 16.372817 14 43 Correlation Coefficient (r) 0.940900 17 46 Coefficient of Determination (r2) 0.885293 19 69 Standard Error 6.802371 22 75 24 77 [Show More]
Last updated: 2 years ago
Preview 1 out of 13 pages
Buy this document to get the full access instantly
Instant Download Access after purchase
Buy NowInstant download
We Accept:

Reviews( 0 )
$11.00
Can't find what you want? Try our AI powered Search
Document information
Connected school, study & course
About the document
Uploaded On
Aug 21, 2020
Number of pages
13
Written in

Additional information
This document has been written for:
Uploaded
Aug 21, 2020
Downloads
0
Views
233

 (Diane Pacitti etc.png)