Math 225n Statistics
Question
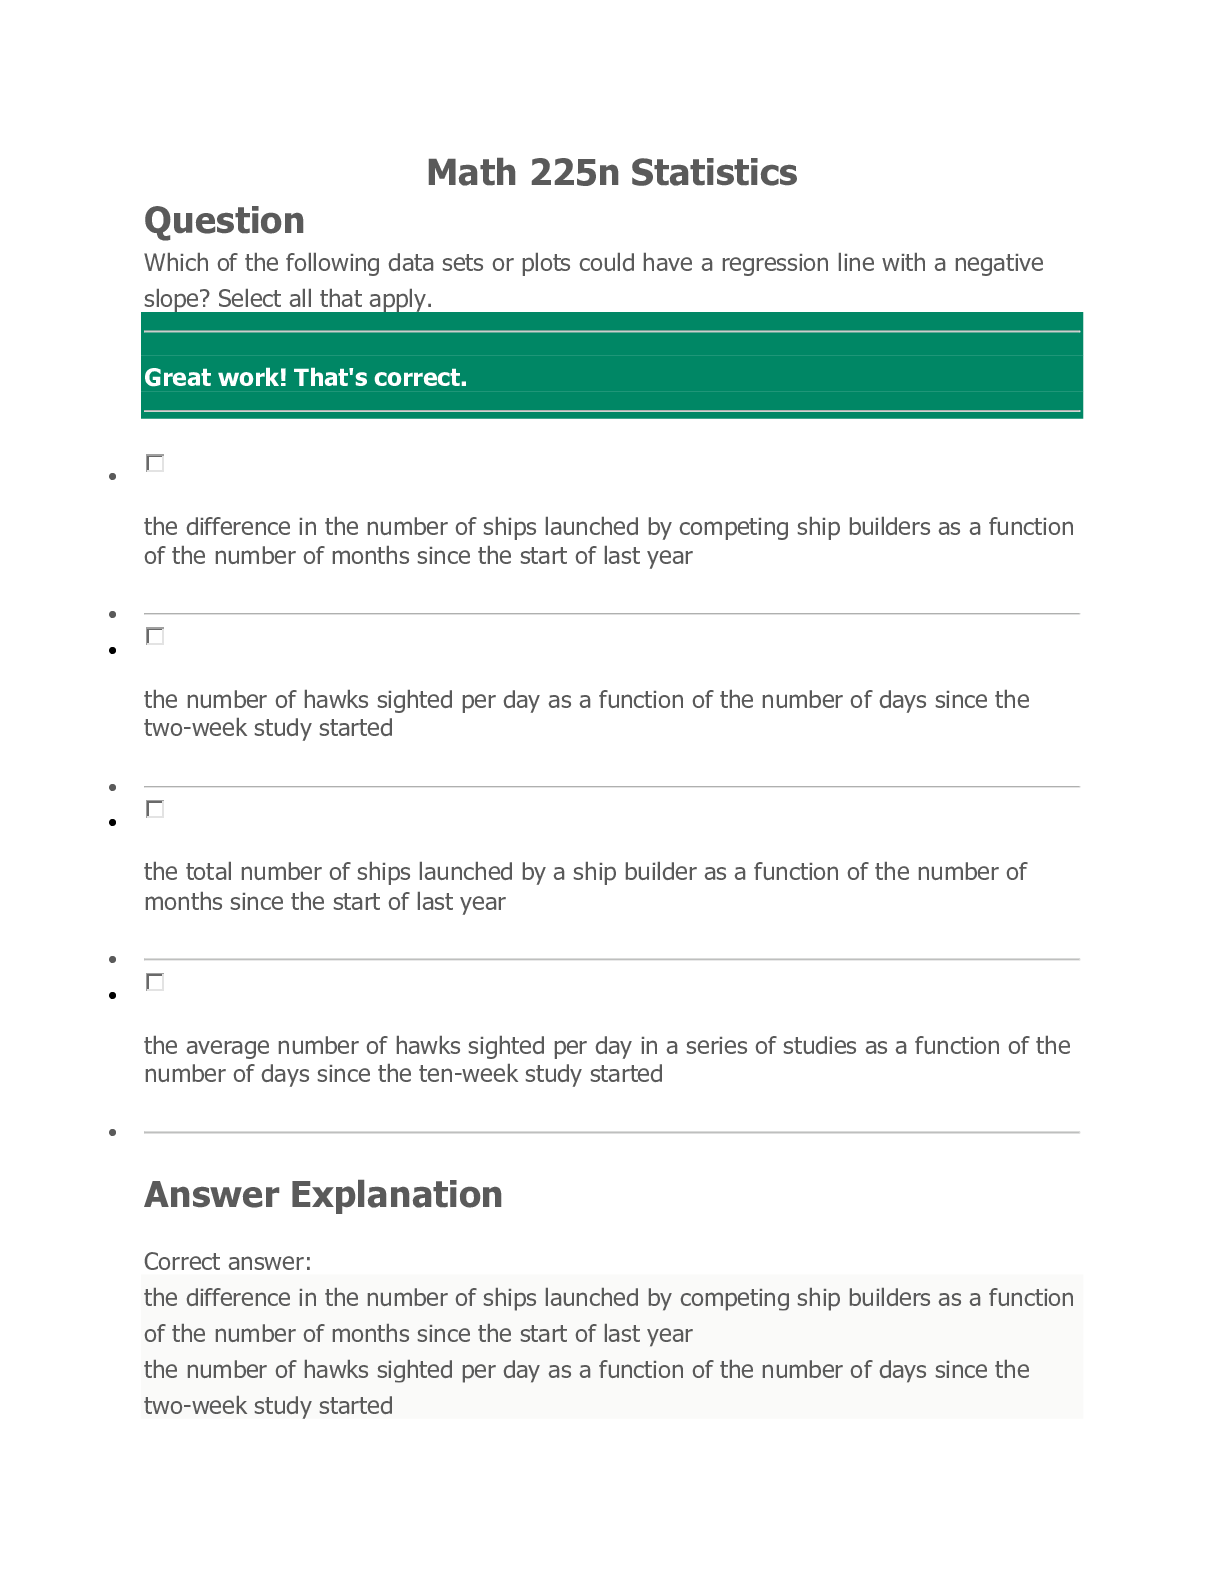
Which of the following data sets or plots could have a regression line with a negative slope? Select all that apply.
________________________________________
Great work! That's correct.
...
Math 225n Statistics
Question
Which of the following data sets or plots could have a regression line with a negative slope? Select all that apply.
________________________________________
Great work! That's correct.
________________________________________
•
the difference in the number of ships launched by competing ship builders as a function of the number of months since the start of last year
• ________________________________________
•
the number of hawks sighted per day as a function of the number of days since the two-week study started
• ________________________________________
•
the total number of ships launched by a ship builder as a function of the number of months since the start of last year
• ________________________________________
•
the average number of hawks sighted per day in a series of studies as a function of the number of days since the ten-week study started
• ________________________________________
Answer Explanation
Correct answer:
the difference in the number of ships launched by competing ship builders as a function of the number of months since the start of last year
the number of hawks sighted per day as a function of the number of days since the two-week study started
the average number of hawks sighted per day in a series of studies as a function of the number of days since the ten-week study started
The slope is related to the increase or decrease of the dependent variable as a function of the independent variable. If the dependent variable can decrease, then the slope can be negative, such as with the difference in the number of ships launched.
Question
The scatter plot below shows the average cost of a designer jacket in a sample of years between 2000 and 2015. The least squares regression line modeling this data is given by yˆ=−4815+3.765x.
A scatterplot has a horizontal axis labeled Year from 2005 to 2015 in increments of 5 and a vertical axis labeled Price ($) from 2660 to 2780 in increments of 20. The following points are plotted: (2003, 2736); (2004, 2715); (2007, 2675); (2009, 2719); (2013, 270). All coordinates are approximate.
Interpret the slope of the least squares regression line.
________________________________________
Yes that's right. Keep it up!
________________________________________
The average cost of a designer jacket decreased by $3.765 each year between 2000 and 2015.
The average cost of a designer jacket increased by $3.765 each year between 2000 and 2015.
The average cost of a designer jacket decreased by $4815 each year between 2000 and 2015.
The average cost of a designer jacket increased by $4815 each year between 2000 and 2015.
Answer Explanation
Correct answer:
The average cost of a designer jacket increased by $3.765 each year between 2000 and 2015.
Since the slope of the line is positive 3.765, the average increase in cost is $3.765 per year.
Question
The scatter plot below shows data for the average cost of a high-end computer (y, in dollars) in the year x years since 2000. The least squares regression line is given by yˆ=−1677+314x.
A coordinate plane has a horizontal x-axis labeled Year from 4 to 12 in increments of 2 and a vertical y-axis labeled Cost in dollars from 0 to 2000 in increments of 500. The following points are plotted: left-parenthesis 6 comma 250 right-parenthesis, left-parenthesis 7 comma 550 right-parenthesis, left-parenthesis 9 comma 1000 right-parenthesis, left-parenthesis 10 comma 1300 right-parenthesis, and left-parenthesis 11 comma 2000 right-parenthesis. A line rises from left to right, passing through left-parenthesis 7 comma 550 right-parenthesis and left-parenthesis 10 comma 1500 right-parenthesis. All coordinate are approximate.
Interpret the slope of the least squares regression line.
________________________________________
Great work! That's correct.
________________________________________
On average, the average cost of a high-end computer is predicted to decrease by $314 each year.
On average, the average cost of a high-end computer is predicted to increase by $314 each year.
The average cost of a high-end computer increases by $314 each year.
On average, the average cost of a high-end computer is predicted to decrease by $1677 each year.
Answer Explanation
Correct answer:
On average, the average cost of a high-end computer is predicted to increase by $314 each year.
Since the slope of the line is positive 314, on average, the average cost of a high-end computer is predicted to increase by $314 each year.
Question
Which of the following data sets or plots could have a regression line with a negative slope?
________________________________________
That's not right - let's review the answer.
________________________________________
•
the number of miles a ship has traveled as a function of the number of years since it was launched
• ________________________________________
•
the number of miles a ship has traveled each year as a function of the number of years since it was launched
• ________________________________________
•
the number of cats living in an abandoned lot as a function of the number of years since the building was torn down
• ________________________________________
•
the number of cats born each year in an abandoned lot as a function of the number of years since the building was torn down
• ________________________________________
Answer Explanation
Correct answer:
the number of miles a ship has traveled each year as a function of the number of years since it was launched
the number of cats born each year in an abandoned lot as a function of the number of years since the building was torn down
The slope is related to the increase or decrease of the dependent variable as a function of the independent variable. If the dependent variable can decrease, then the slope can be negative, such as with the number of cats born each year.
Your answer:
the number of miles a ship has traveled as a function of the number of years since it was launched
The distance a ship has traveled can only increase, so the slope of the line can only be positive.
the number of miles a ship has traveled each year as a function of the number of years since it was launched
Question
A survey regarding truck engines found a positive correlation between the size of the engine and horsepower the engine produces. Answer the following question based only on this information.
True or false: It can be concluded that trucks with larger engines have greater horsepower.
________________________________________
Not quite - review the answer explanation to help get the next one.
________________________________________
True
False
Answer Explanation
Correct answer:
False
Correlation does not prove causation. There could be a third variable associated with size of the engine that causes the truck to have greater horsepower. For example, it could be that manufacturers anticipate that consumers who want trucks with greater horsepower also prefer trucks with large engines and therefore choose to make trucks with larger horsepower.
Question
Which of the following data sets or plots could have a regression line with a negative y-intercept? Select all that apply.
________________________________________
Not quite right - check out the answer explanation.
________________________________________
•
the percent change in the land area in the arctic circle covered by ice as a function of the tons of CO2 produced by humans
• ________________________________________
•
the change in the square mileage in the arctic circle covered by ice as a function of the tons of CO2 produced by humans
• ________________________________________
•
the number of people living on a volcanic island as a function of the number of days since the last volcanic eruption
• ________________________________________
•
the difference in the number of ships launched by competing ship builders as a function of the number of months since the start of last year
• ________________________________________
Answer Explanation
Correct answer:
the percent change in the land area in the arctic circle covered by ice as a function of the tons of CO2 produced by humans
the change in the square mileage in the arctic circle covered by ice as a function of the tons of CO2 produced by humans
the difference in the number of ships launched by competing ship builders as a function of the number of months since the start of last year
The y-intercept is a measure of the data when the independent variable is zero. The y-intercept can be negative only if the dependent variable is negative, such as in percent change.
Your answer:
the change in the square mileage in the arctic circle covered by ice as a function of the tons of CO2 produced by humans
the number of people living on a volcanic island as a function of the number of days since the last volcanic eruption
There cannot be a negative number of people living on the island, so the y-intercept must be positive.
Question
True or False: The more time it takes to travel a road, the longer the road is.
________________________________________
Correct! You nailed it.
________________________________________
True
False
Answer Explanation
Correct answer:
False
Although there is a correlation between the values, assuming that an increase in travel time causes an increase in length is incorrect. A confounding variable that is ignored is speed. A person could take long time to travel on a short road if he was traveling slowly
Question
A large observational study asks participants about caffeine consumption and sleep duration. The study finds that people with the largest caffeine intake have the shortest sleep duration.
Identify the relation between caffeine consumption and sleep duration.
________________________________________
Perfect. Your hard work is paying off ?
________________________________________
Caffeine consumption and sleep duration are correlated.
An increase in caffeine consumption causes a decrease in sleep duration.
A decrease in sleep duration causes an increase in caffeine consumption.
There is no relation between caffeine consumption and sleep duration.
Answer Explanation
Correct answer:
Caffeine consumption and sleep duration are correlated.
The study finds only a correlation between the two variables. It says nothing about one causing the other. It also does not rule out a third variable affecting caffeine consumption or sleep duration.
[Show More]


.png)

x.png)


![Preview of NURS 6541 Week 7 Quiz [Completed A]](https://scholarfriends.com/storage/NURS 6541 Week 7 Quiz.png)