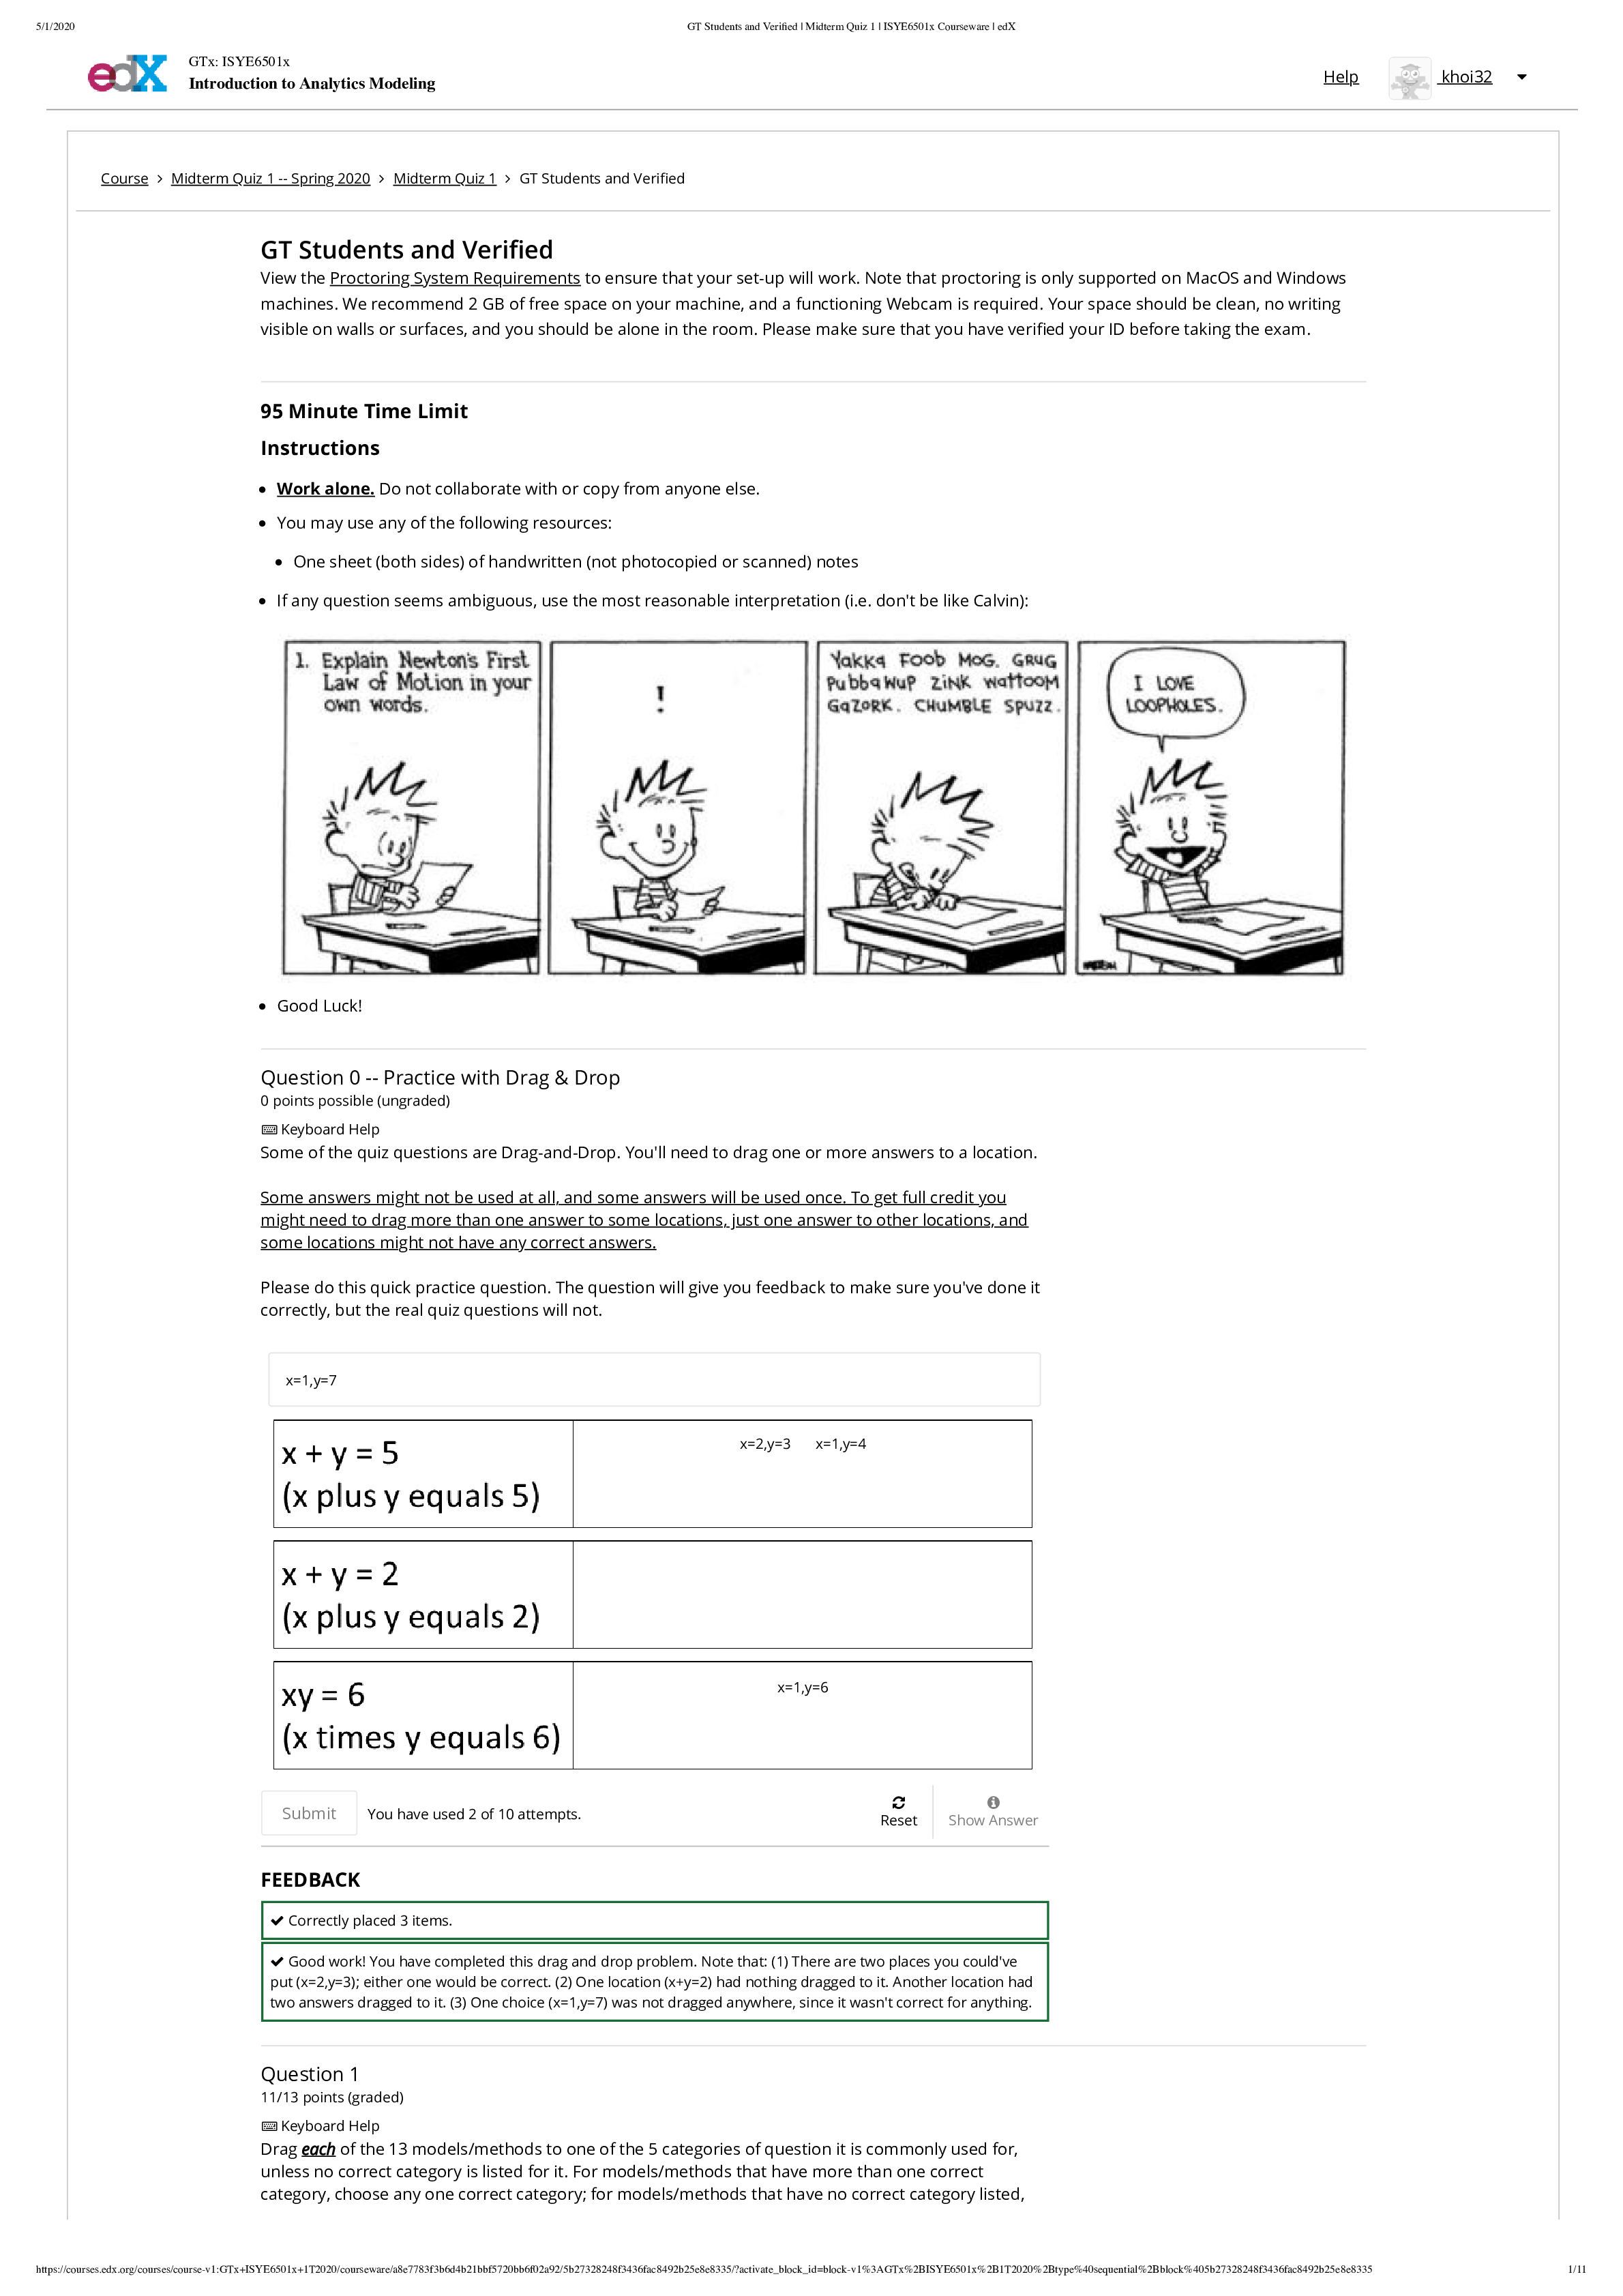
Question 0 -- Practice with Drag & Drop
0 points possible (ungraded)
Keyboard Help
Some of the quiz questions are Drag-and-Drop. You'll need to drag one or more answers to a location.
Some answers might not be used
...
Question 0 -- Practice with Drag & Drop
0 points possible (ungraded)
Keyboard Help
Some of the quiz questions are Drag-and-Drop. You'll need to drag one or more answers to a location.
Some answers might not be used at all, and some answers will be used once. To get full credit you
might need to drag more than one answer to some locations, just one answer to other locations, and
some locations might not have any correct answers.
Please do this quick practice question. The question will give you feedback to make sure you've done it
correctly, but the real quiz questions will not.
FEEDBACK
Correctly placed 3 items.
Good work! You have completed this drag and drop problem. Note that: (1) There are two places you could've
put (x=2,y=3); either one would be correct. (2) One location (x+y=2) had nothing dragged to it. Another location had
two answers dragged to it. (3) One choice (x=1,y=7) was not dragged anywhere, since it wasn't correct for anything.
Submit You have used 2 of 10 attempts. Reset Show Answer
Question 1
11/13 points (graded)
Keyboard Help
Drag each of the 13 models/methods to one of the 5 categories of question it is commonly used for,
unless no correct category is listed for it. For models/methods that have more than one correct
category, choose any one correct category; for models/methods that have no correct category listed,
x=1,y=7
x=2,y=3 x=1,y=4
x=1,y=65/1/2020 GT Students and Verified | Midterm Quiz 1 | ISYE6501x Courseware | edX
https://courses.edx.org/courses/course-v1:GTx+ISYE6501x+1T2020/courseware/a8e7783f3b6d4b21bbf5720bb6f02a92/5b27328248f3436fac8492b25e8e8335/?activate_block_id=block-v1%3AGTx%2BISYE6501x%2B1T2020%2Btype%40sequential%2Bblock%405b27328248f3436fac8492b25e8e8335 2/11
Question 2
3.0/3.0 points (graded)
Select all of the following models that are designed for use with attribute/feature data (i.e., not time-series data):
You have used 1 of 1 attempt
Information for Questions 3a, 3b, 3c
Figures A and B show the training data for a soft classiÕcation problem, using two predictors (x and x ) to separate
between black and white points. The dashed lines are the classiÕers found using SVM. Figure A uses a linear kernel,
and Figure B uses a nonlinear kernel that required Õtting 16 parameter values.
do not drag them.
FEEDBACK
Correctly placed 11 items.
Misplaced 2 items.
Good work! You have completed this drag and drop problem.
Final attempt was used, highest score is 11.0
Submit You have used 1 of 1 attempts. Reset Show Answer
Exponential smoothing
ARIMA
k-means
Principal component analysis
Linear regression
k-nearest-neighbor
Random forest
CUSUM
Logistic regression
Support vector machine
GARCH
Submit
1 2
CUSUM Principal component analysis
Support vector machine
k-means
ARIMA CART Exponential smoothing k-nearest-neighbor
Linear regression Logistic regression Random forest
Cross validation
GARCH5/1/2020 GT Students and Verified | Midterm Quiz 1 | ISYE6501x Courseware | edX
https://courses.edx.org/courses/course-v1:GTx+ISYE6501x+1T2020/courseware/a8e7783f3b6d4b21bbf5720bb6f02a92/5b27328248f3436fac8492b25e8e8335/?activate_block_id=block-v1%3AGTx%2BISYE6501x%2B1T2020%2Btype%40sequential%2Bblock%405b27328248f3436fac8492b25e8e8335 3/11
Answers are displayed within the problem
Figure A Figure B
Question 3a
3.0/3.0 points (graded)
3a. Select all of the following statements that are true.
You have used 1 of 1 attempt
Question 3b
2.25/3.0 points (graded)
3b. Select all of the following statements that are true.
You have used 1 of 1 attempt
Question 3c
3.0/3.0 points (graded)
3c. Select all of the following statements that are true.
You have used 1 of 1 attempt
Question 3d
0.99/3.0 points (graded)
In the soft classiÕcation SVM model where we select coeÞcients ... to minimize
Figure A's classiÕer is based only on the value of ?1.
Figure A's classiÕer is more likely to be over-Õt than Figure B's classiÕer.
Figure A's classiÕer has a narrower margin than Figure B's classiÕer in the training data.
Figure A's classiÕer incorrectly classiÕes exactly 4 white points as black in the training data.
Figure A shows that the black point (7.2,1.4) is an outlier.
Submit
Figure B's more-complex classiÕer shows that it is a better analysis than Figure A.
Figure B's classiÕer would probably perform worse on test data than on the training data.
Figure B's classiÕer incorrectly classiÕes exactly 5 black points in the training data.
Figure B shows that the black point (7.2,1.4) is an outlier
[Show More]