Statistics > Summary > STAT 200 Week 6, Verified Answers Well Explained, Already Graded A+ (All)
STAT 200 Week 6, Verified Answers Well Explained, Already Graded A+
Document Content and Description Below
Last updated: 3 years ago
Preview 1 out of 11 pages
Instant download

Buy this Document to get the Full Access Instantly
Provided by Students Who Aced it
We Verify Document Content to Gurantee Accuracy
Reviews( 0 )
Document information
Connected school, study & course
About the document
Uploaded On
Sep 20, 2021
Number of pages
11
Written in
All

Additional information
This document has been written for:
Uploaded
Sep 20, 2021
Downloads
0
Views
177
Document Keyword Tags
Recommended For You
Get more on Summary »
STAT 200 Week 2 Homework |Latest Questions And Answers {Comple...

Quiz Submissions - Week 1: Quiz 1 - STAT 200 6372 Introduction...

STAT 200 FINAL EXAM 1 ; Latest Complete Solutions with shown w...

STAT 200 STAT200 MIDTERM EXAM ANSWERS (2021) - UMUC (all solut...
STAT 200 Week 6, Verified Answers Well Explained, Already Grad...
STAT 200 Week 6, Verified Answers Well Explained, Already Grad...

STAT 200 Week 4 Homework Problems Complete Guide 100% CORRECT...

University of Maryland - STAT 200; Week 7 Homework Problems, A...

1.png)
(answered) STAT 200 Week 7 Homework|STAT 200 STAT200 WEEK 7 HO...

STAT 200 FINAL EXAM 1 ; Latest Complete Solutions with shown w...
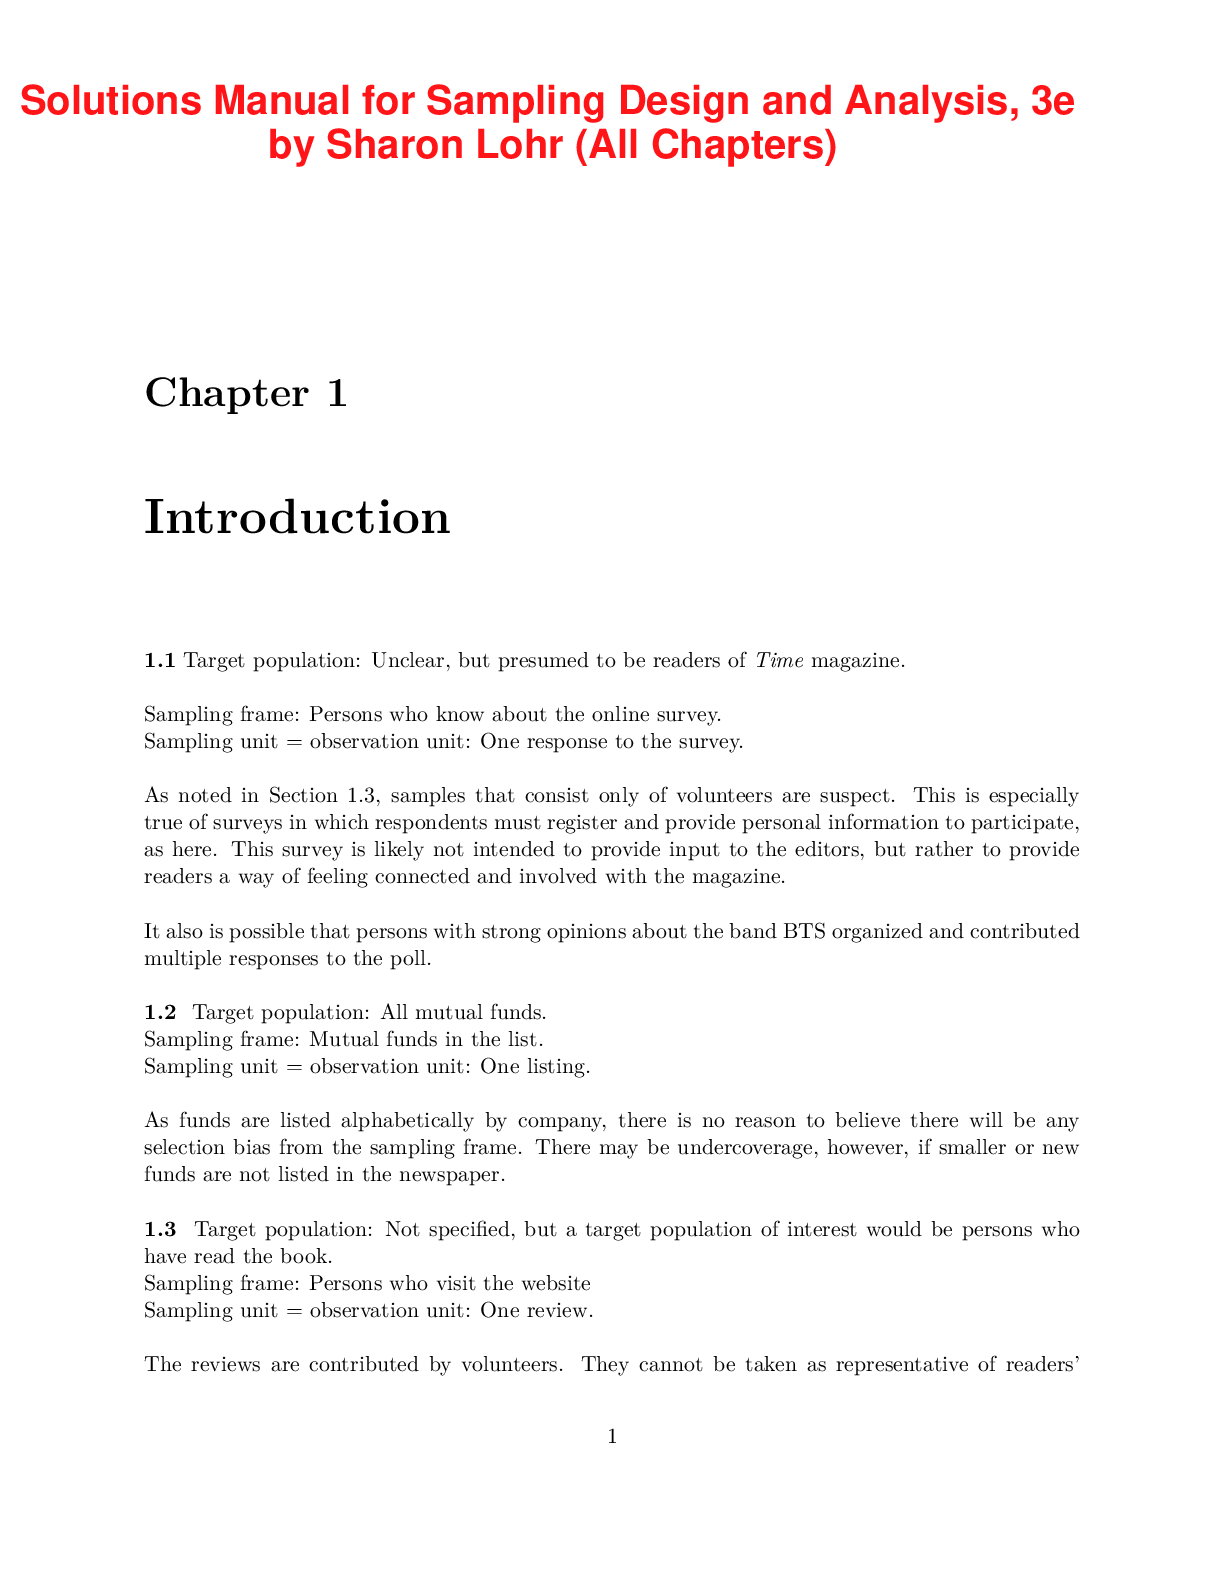
Sampling Design and Analysis, 3e by Sharon Lohr (Solutions Man...
.png)
Business Statistics, 4e Norean Sharpe, Richard Veaux, Paul Vel...
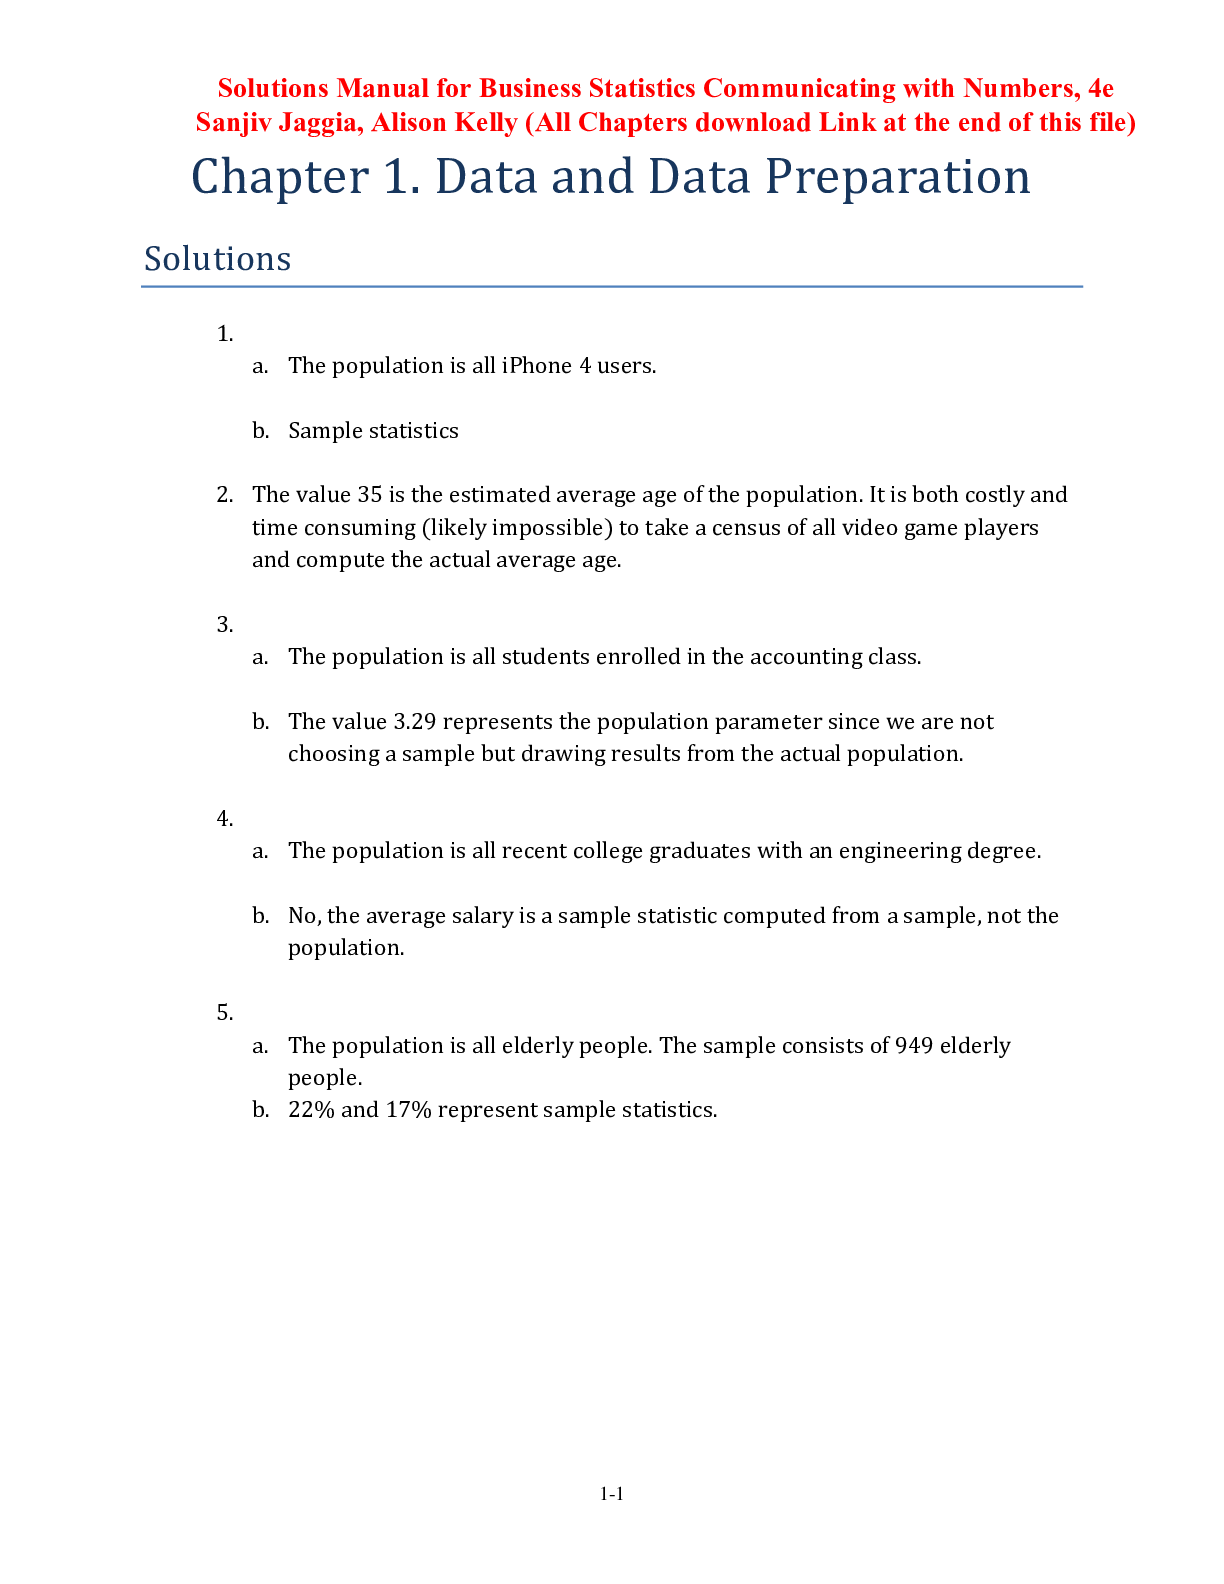
Solutions Manual for Business Statistics Communicating with Nu...

BIOS242 / BIOS 242 Final Study Guide Chapter 1 -9 : Fundamen...


.png)


.png)