Action Digital
(Industry 1)
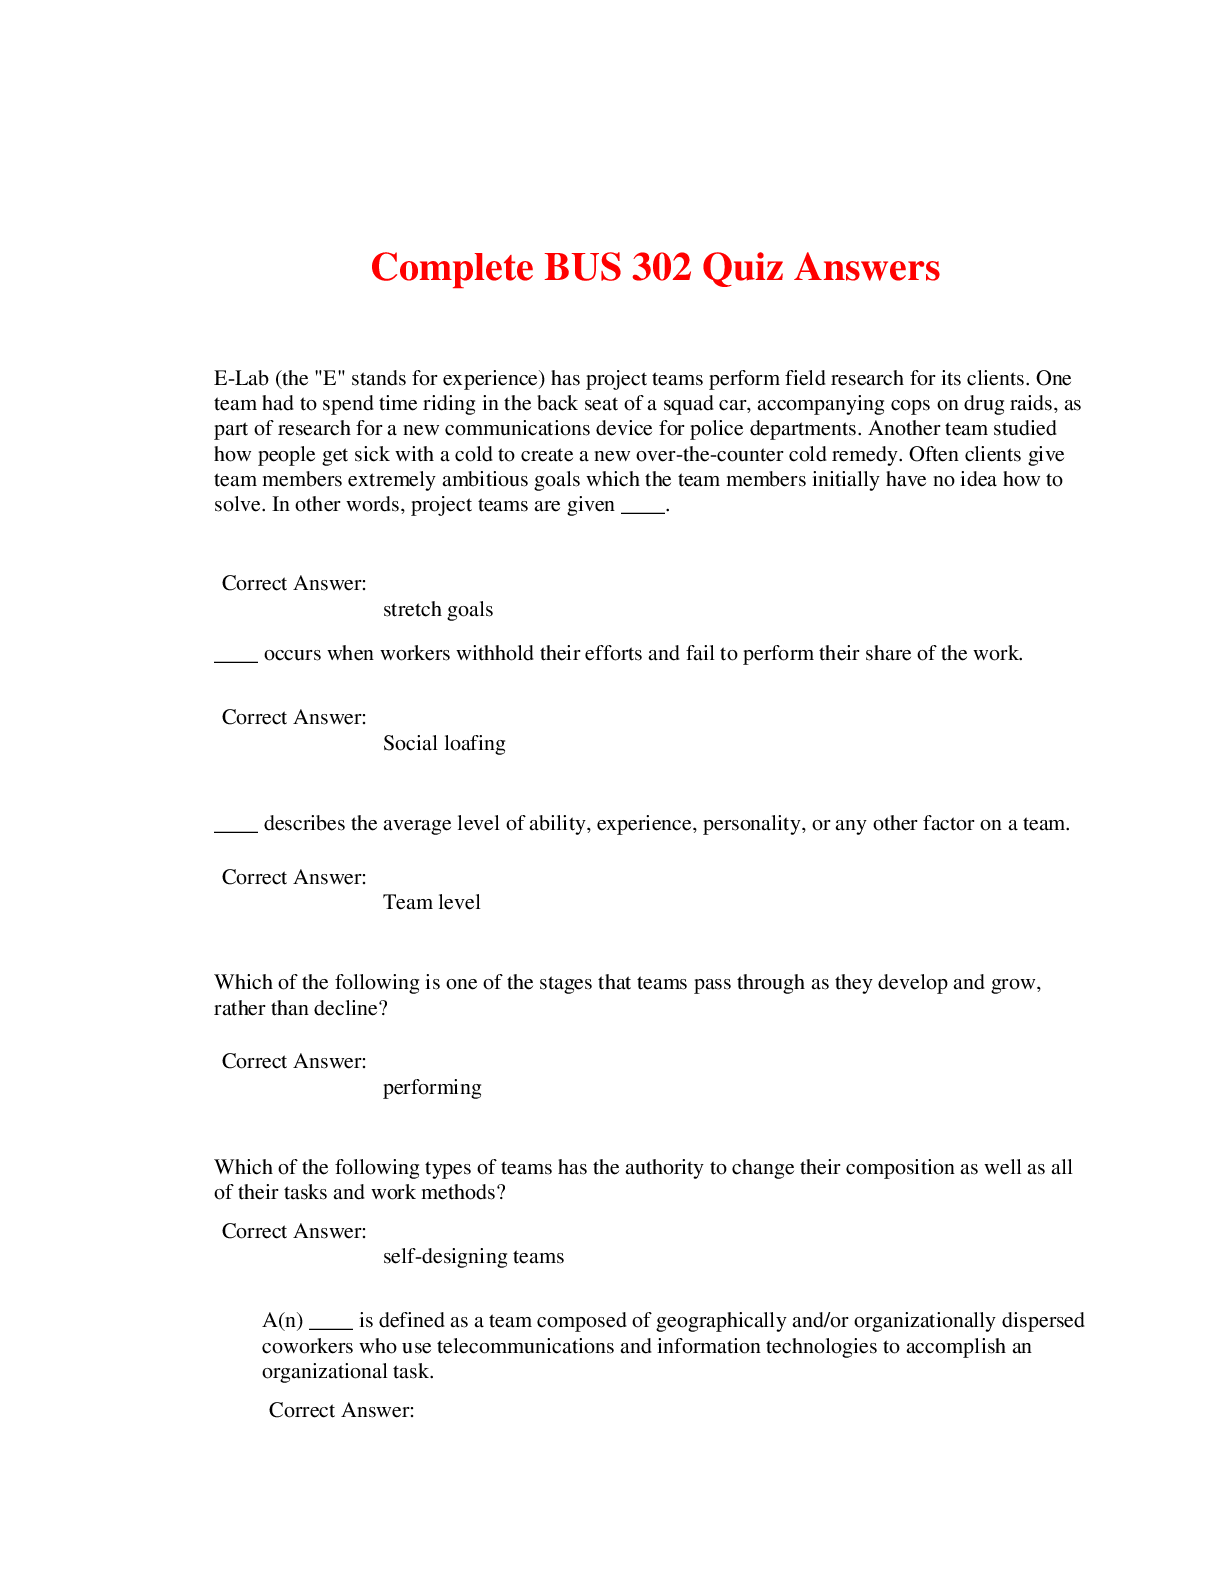
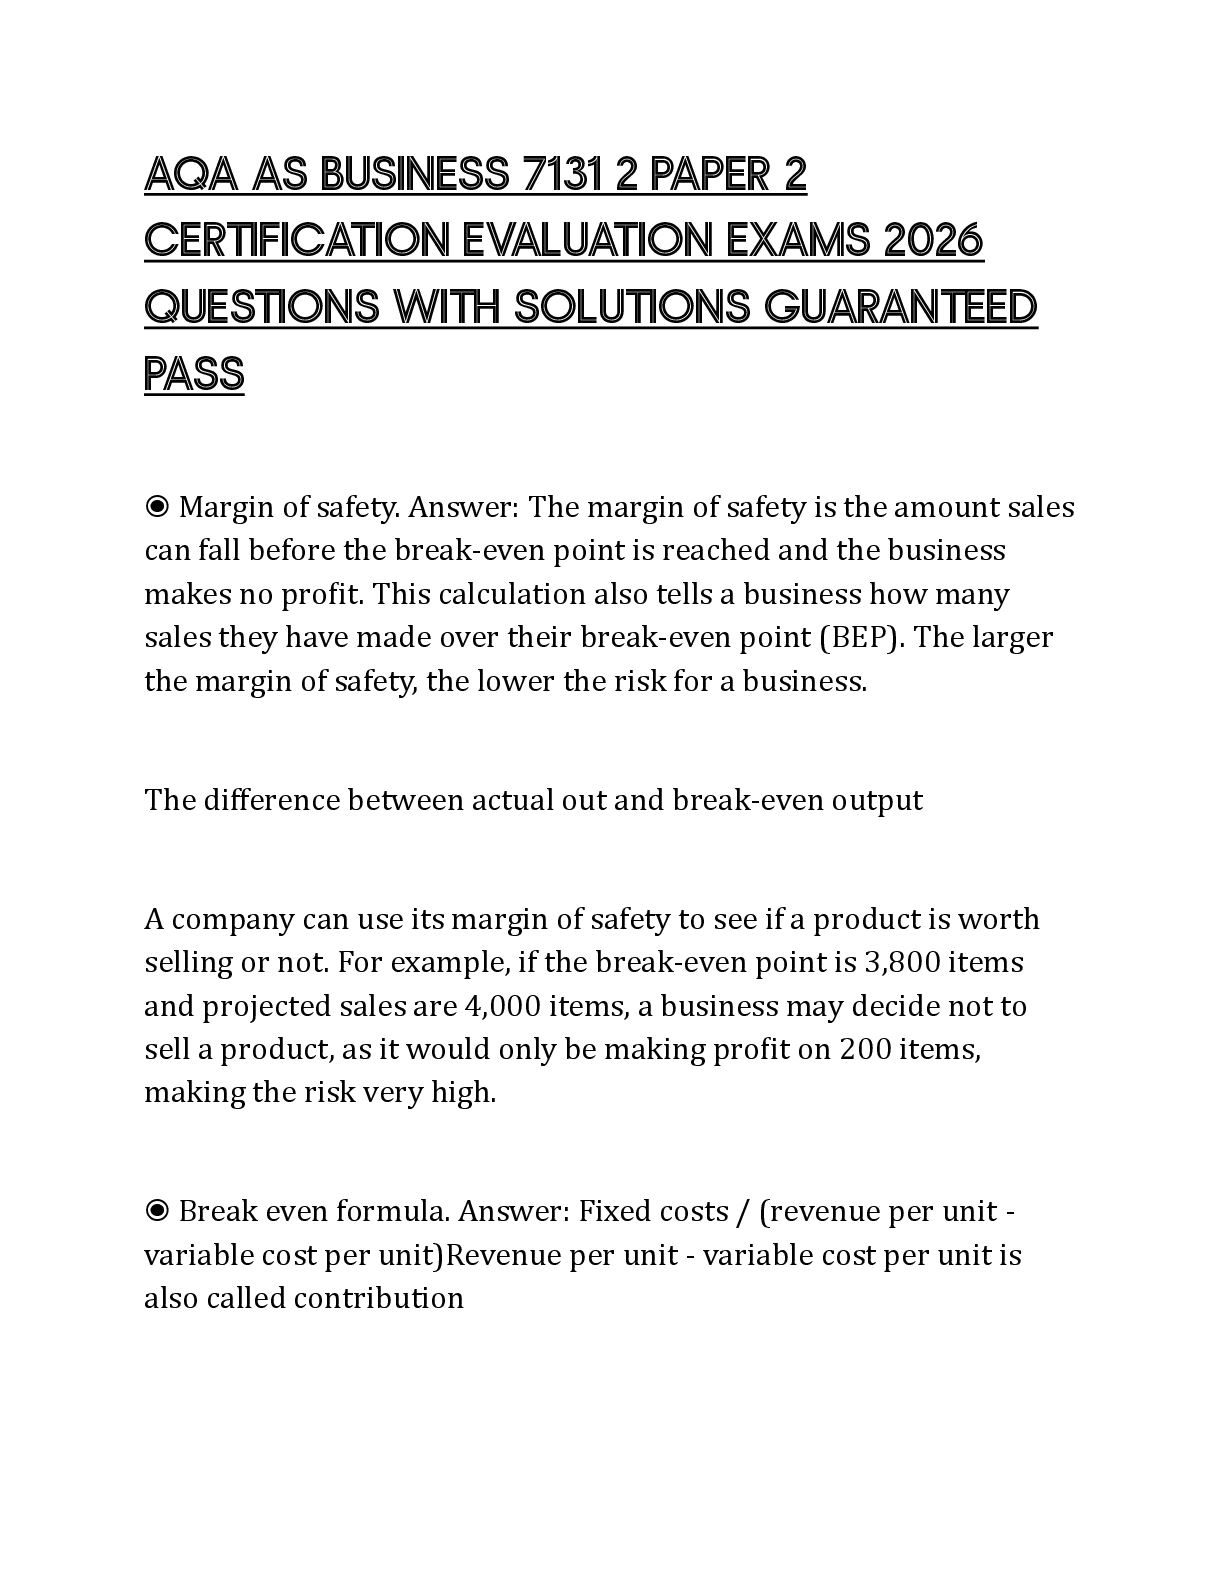
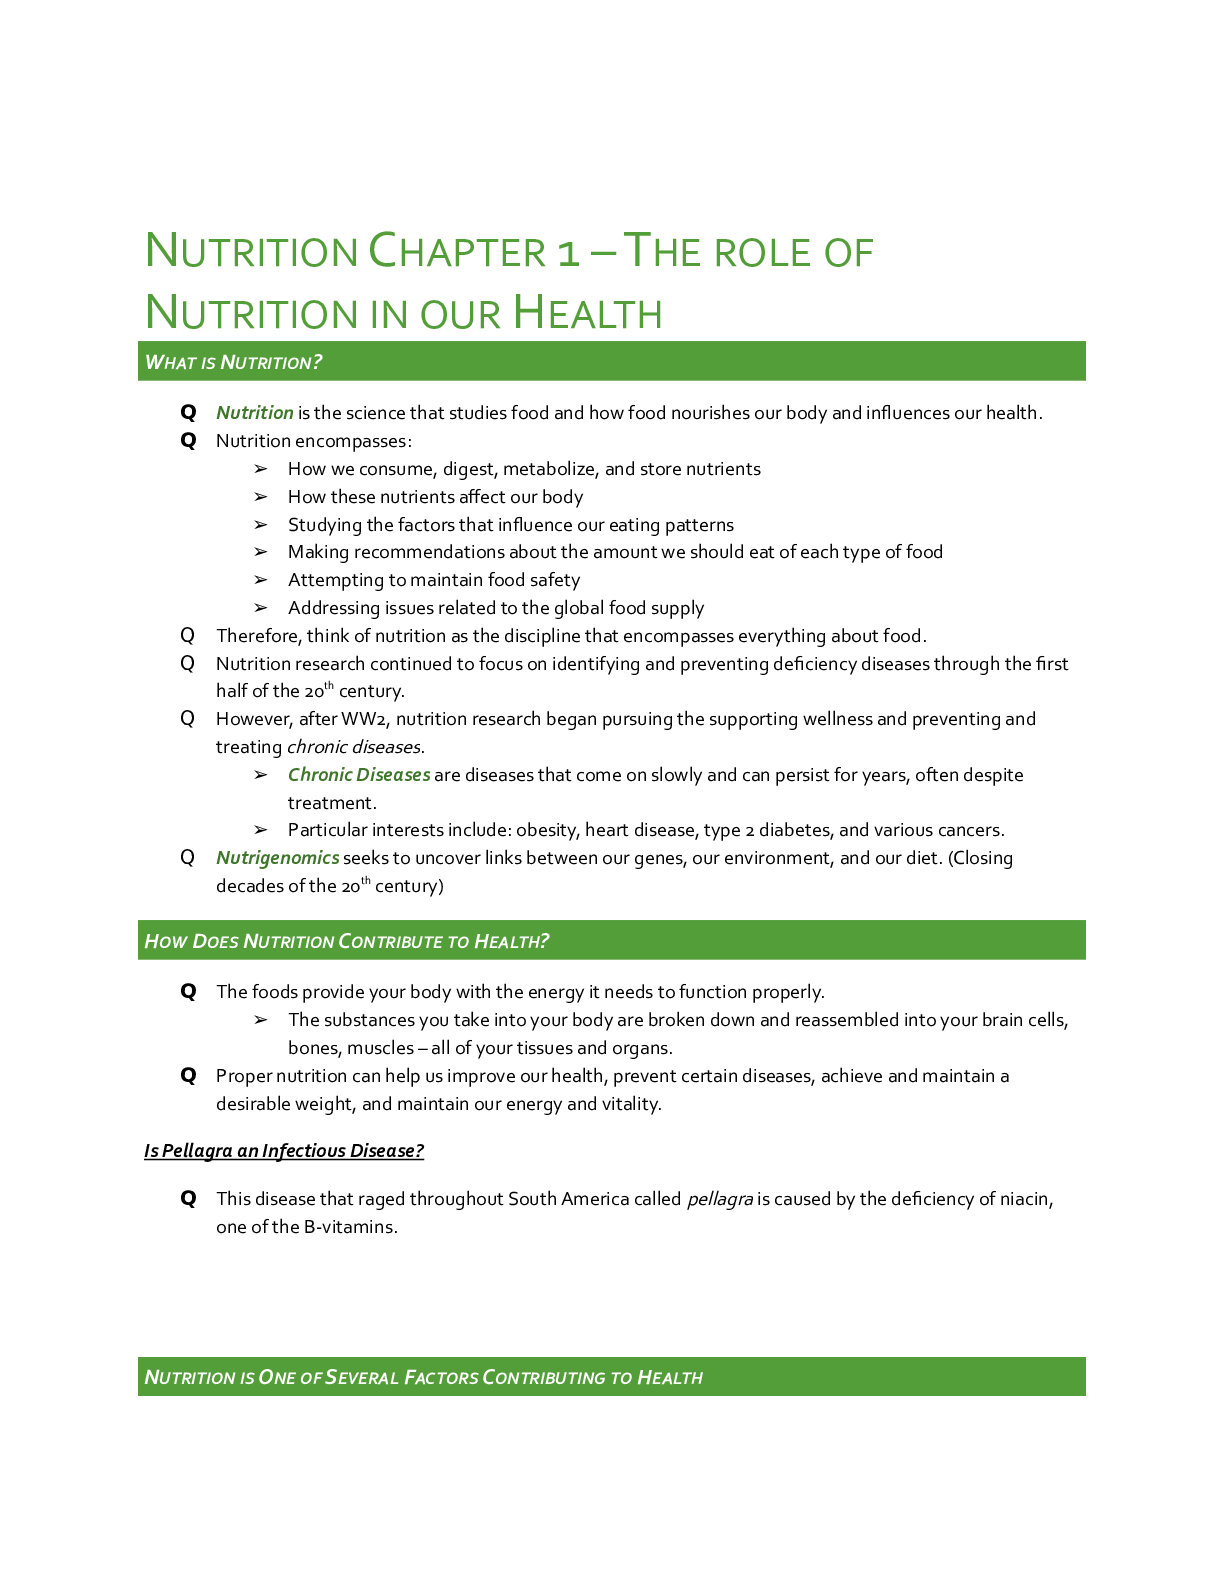
PERFORMANCE HIGHLIGHTS Year 8
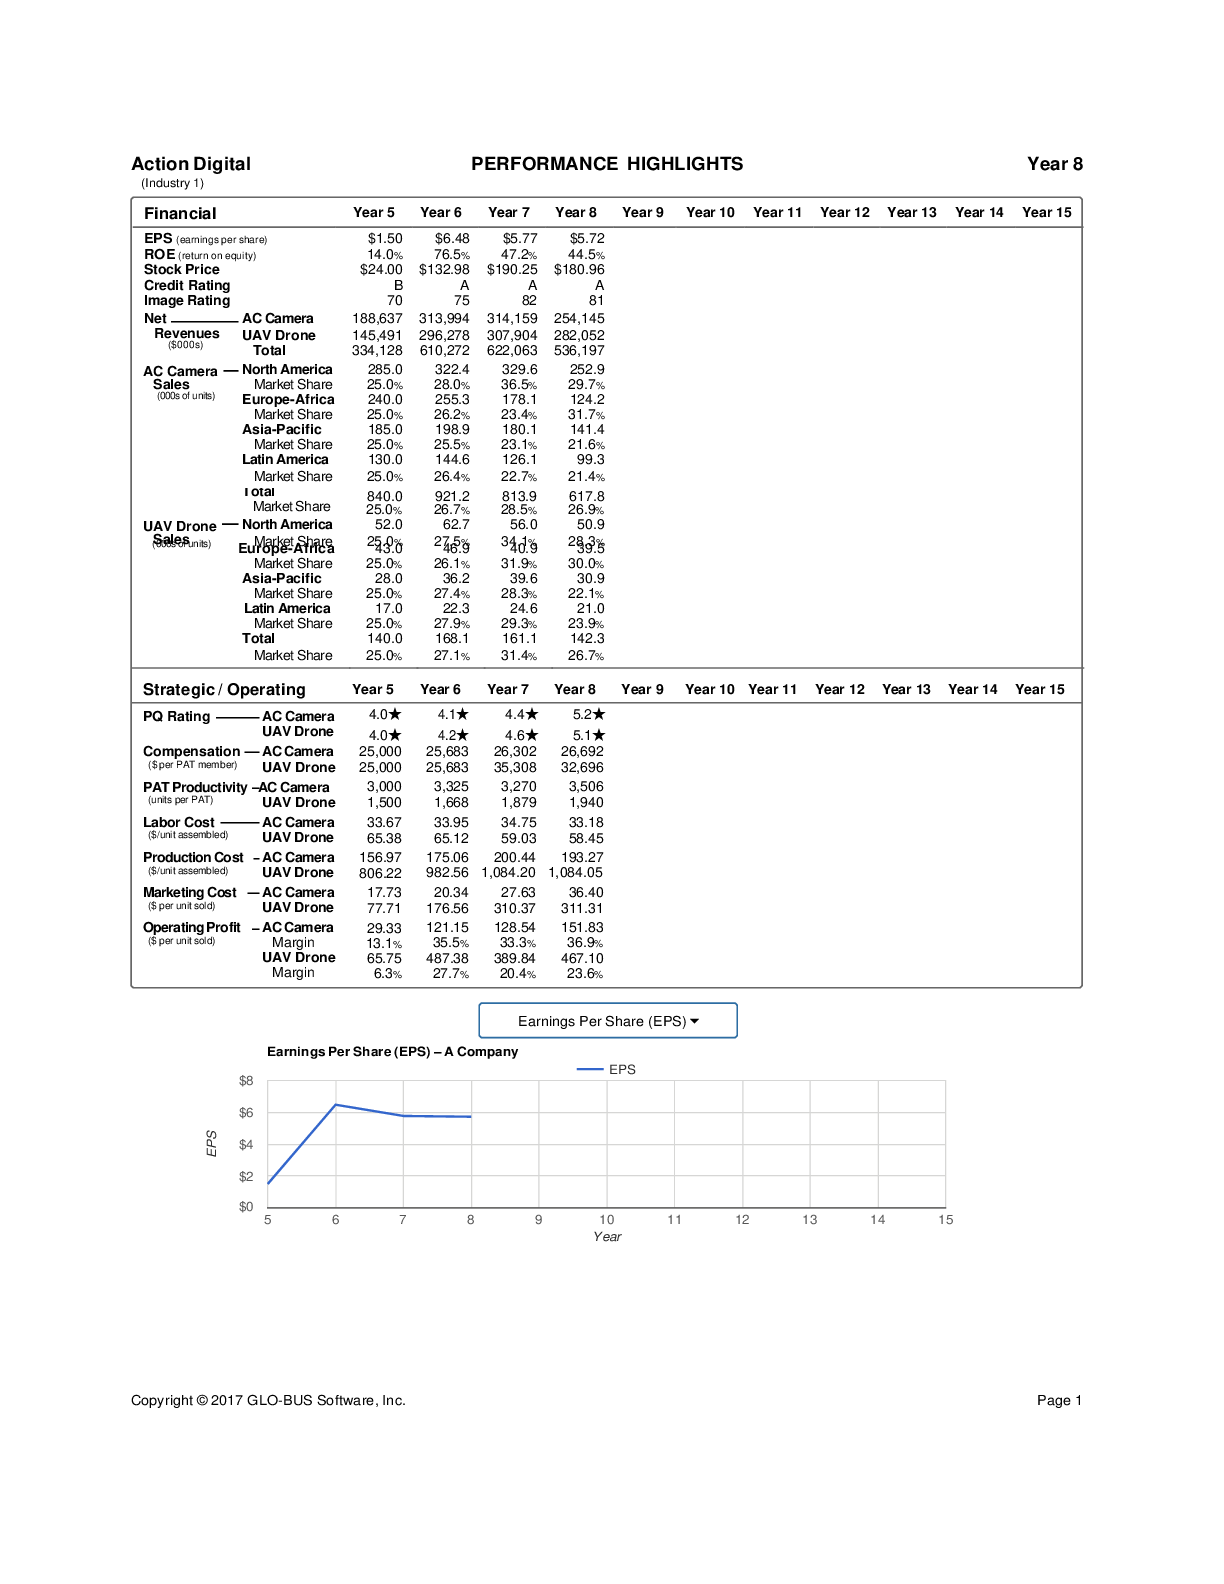
Financial Year 5 Year 6 Year 7 Year 8 Year 9 Year 10 Year 11 Year 12 Year 13 Year 14 Year 15
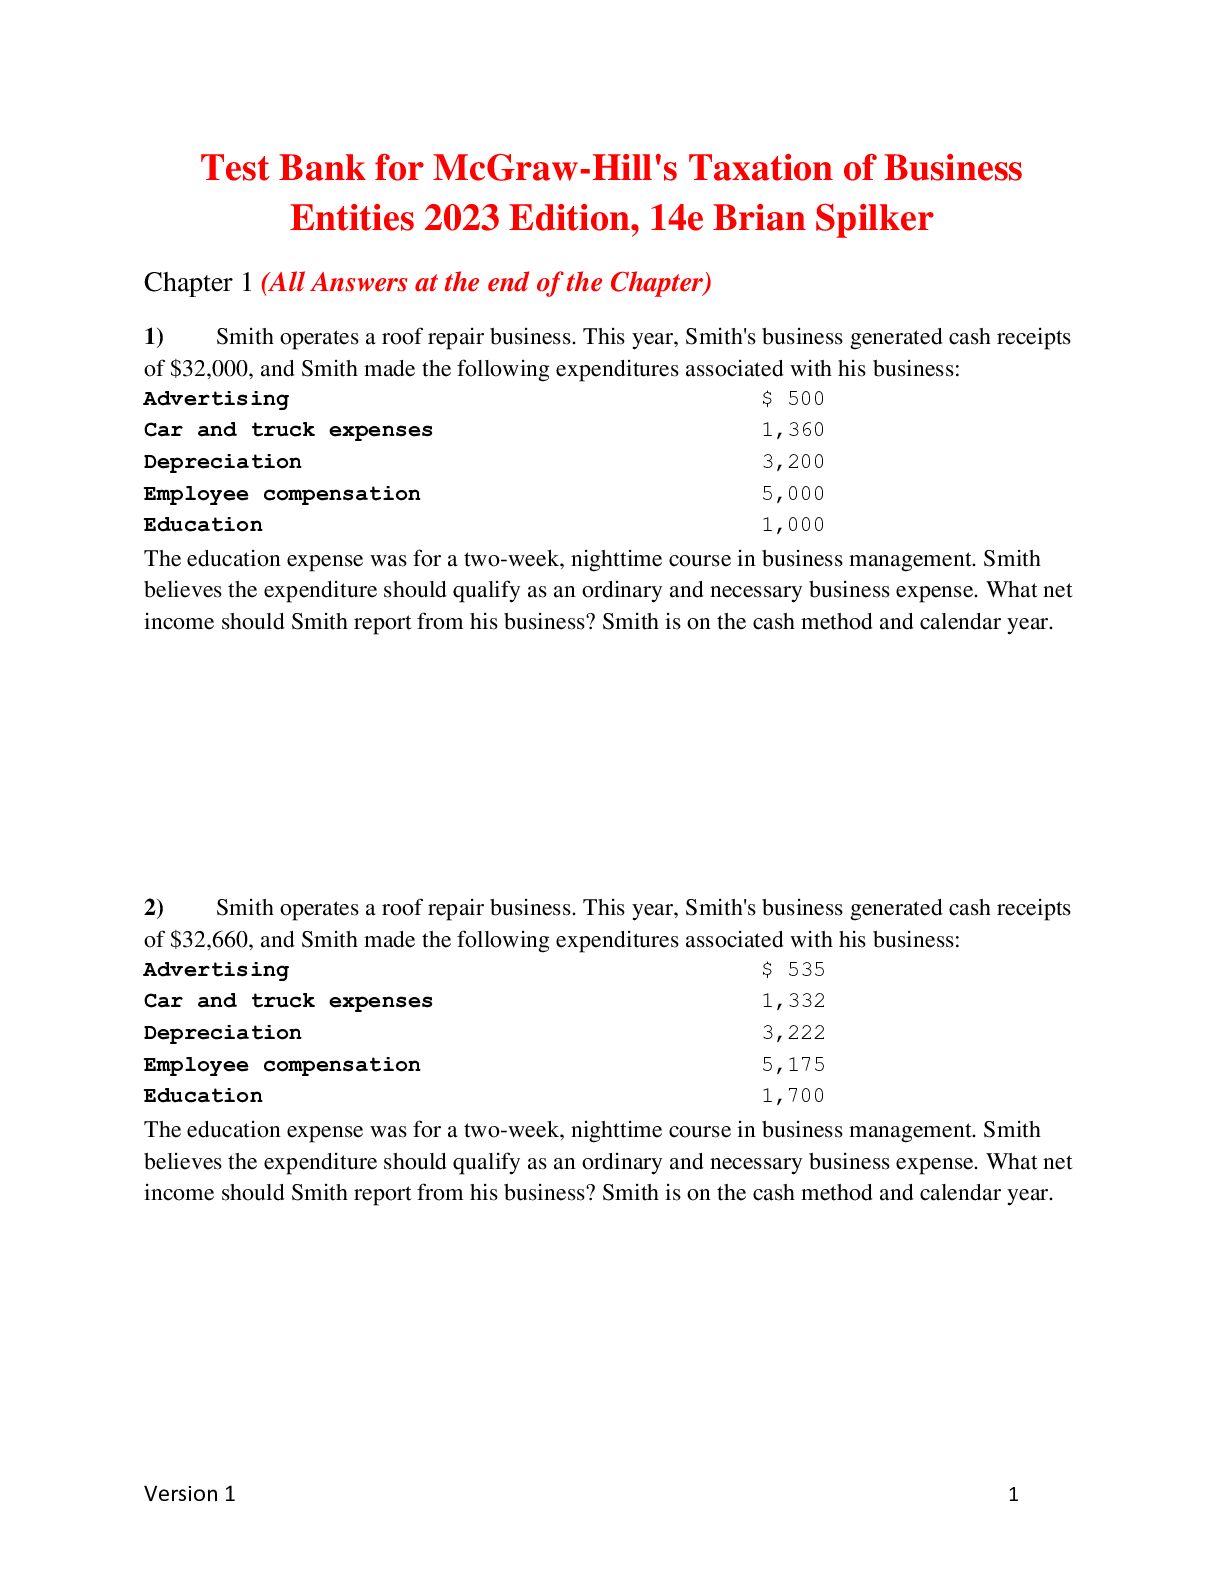
EPS (earnings per share) $1.50 $6.48 $5.77 $5.72
ROE (return o
...
Action Digital
(Industry 1)
PERFORMANCE HIGHLIGHTS Year 8
Financial Year 5 Year 6 Year 7 Year 8 Year 9 Year 10 Year 11 Year 12 Year 13 Year 14 Year 15
EPS (earnings per share) $1.50 $6.48 $5.77 $5.72
ROE (return on equity) 14.0% 76.5% 47.2% 44.5%
Stock Price $24.00 $132.98 $190.25 $180.96
Credit Rating
Image Rating
B
70
A
75
A
82
A
81
Net AC Camera 188,637 313,994 314,159 254,145
Revenues UAV Drone 145,491 296,278 307,904 282,052
(000s of units) Europe-Africa 43.0 46.9 40.9 39.5
Market Share 25.0% 26.1% 31.9% 30.0%
Asia-Pacific 28.0 36.2 39.6 30.9
Market Share 25.0% 27.4% 28.3% 22.1%
Latin America 17.0 22.3 24.6 21.0
Market Share 25.0% 27.9% 29.3% 23.9%
Total 140.0 168.1 161.1 142.3
Market Share 25.0% 27.1% 31.4% 26.7%
Earnings Per Share (EPS) – A Company
$8
EPS
$6
$4
$2
$0
5 6 7 8 9 10 11 12 13 14 15
Year
Copyright © 2017 GLO-BUS Software, Inc. Page 1
Earnings Per Share (EPS)
EPS
Total 334,128 610,272 622,063 536,197
North America 285.0 322.4 329.6 252.9
Market Share 25.0% 28.0% 36.5% 29.7%
Europe-Africa 240.0 255.3 178.1 124.2
Market Share 25.0% 26.2% 23.4% 31.7%
Asia-Pacific 185.0 198.9 180.1 141.4
Market Share 25.0% 25.5% 23.1% 21.6%
Latin America 130.0 144.6 126.1 99.3
Market Share 25.0% 26.4% 22.7% 21.4%
Total
Market Share
840.0
25.0%
921.2
26.7%
813.9
28.5%
617.8
26.9%
North America 52.0 62.7 56.0 50.9
Market Share 25.0% 27.5% 34.1% 28.3%
Action Digital
(Industry 1)
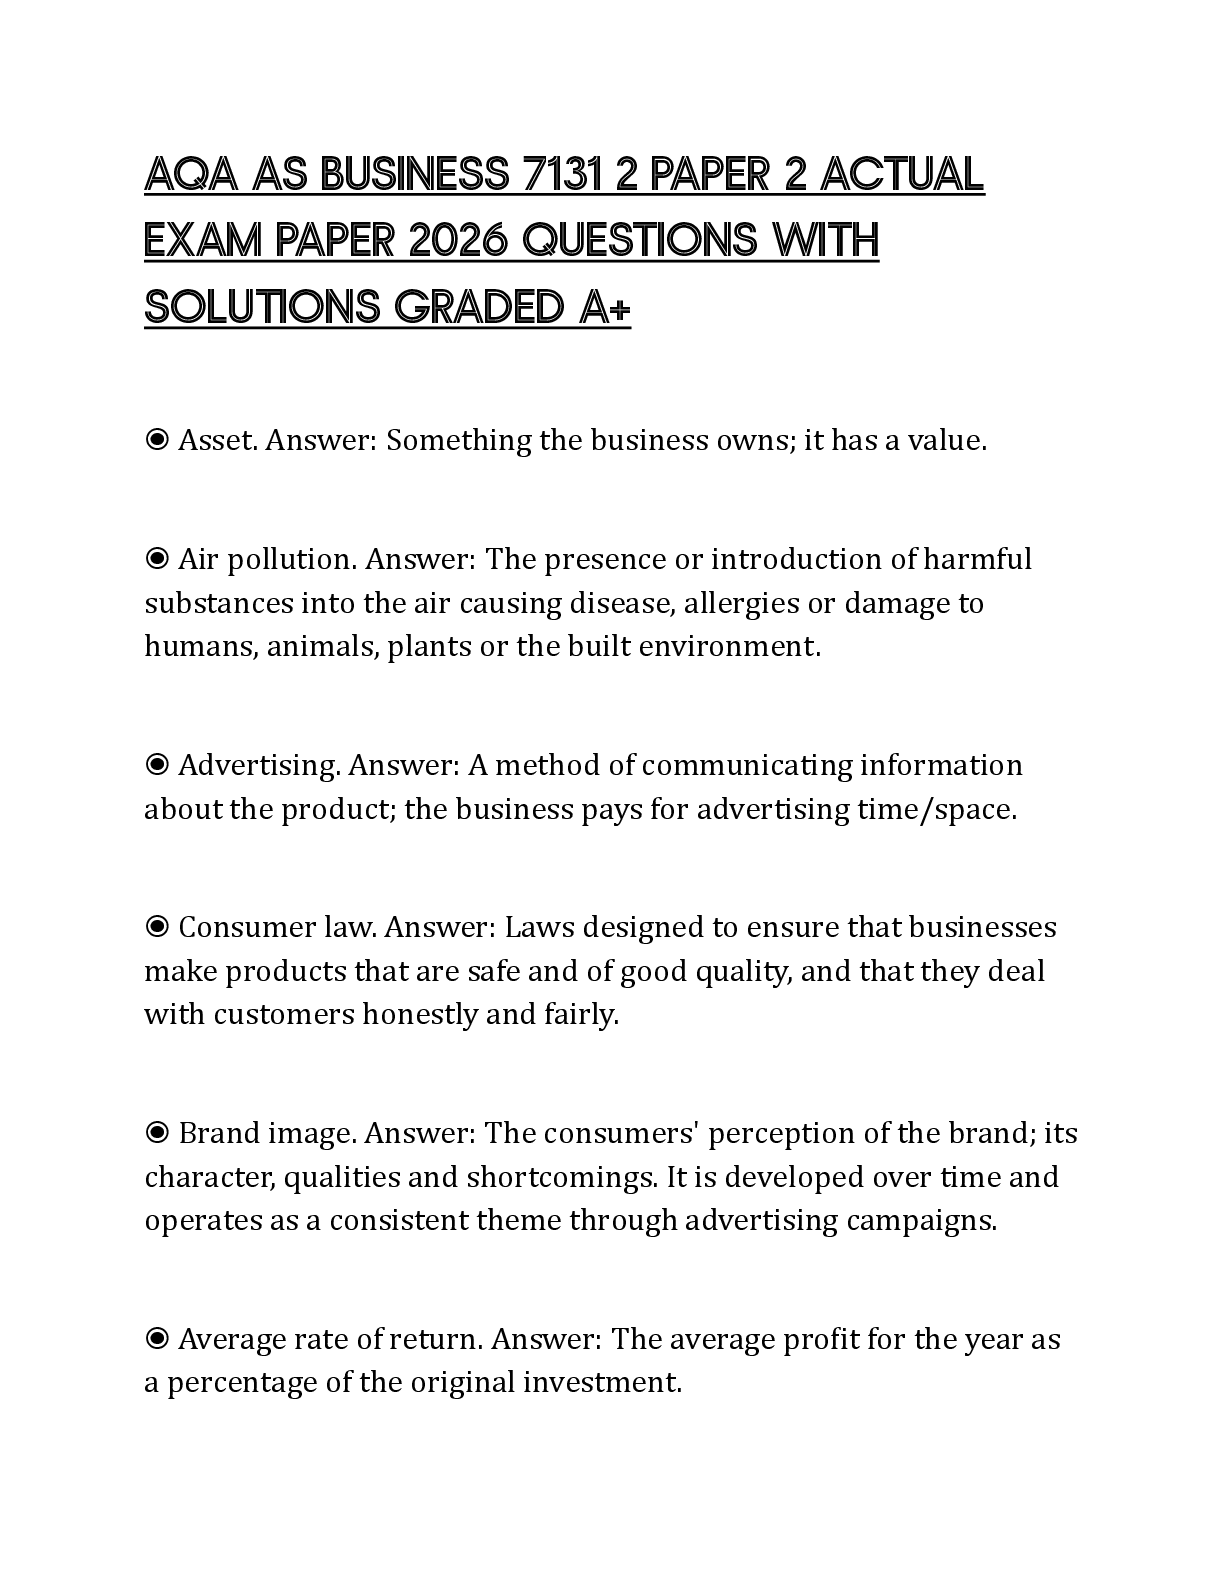
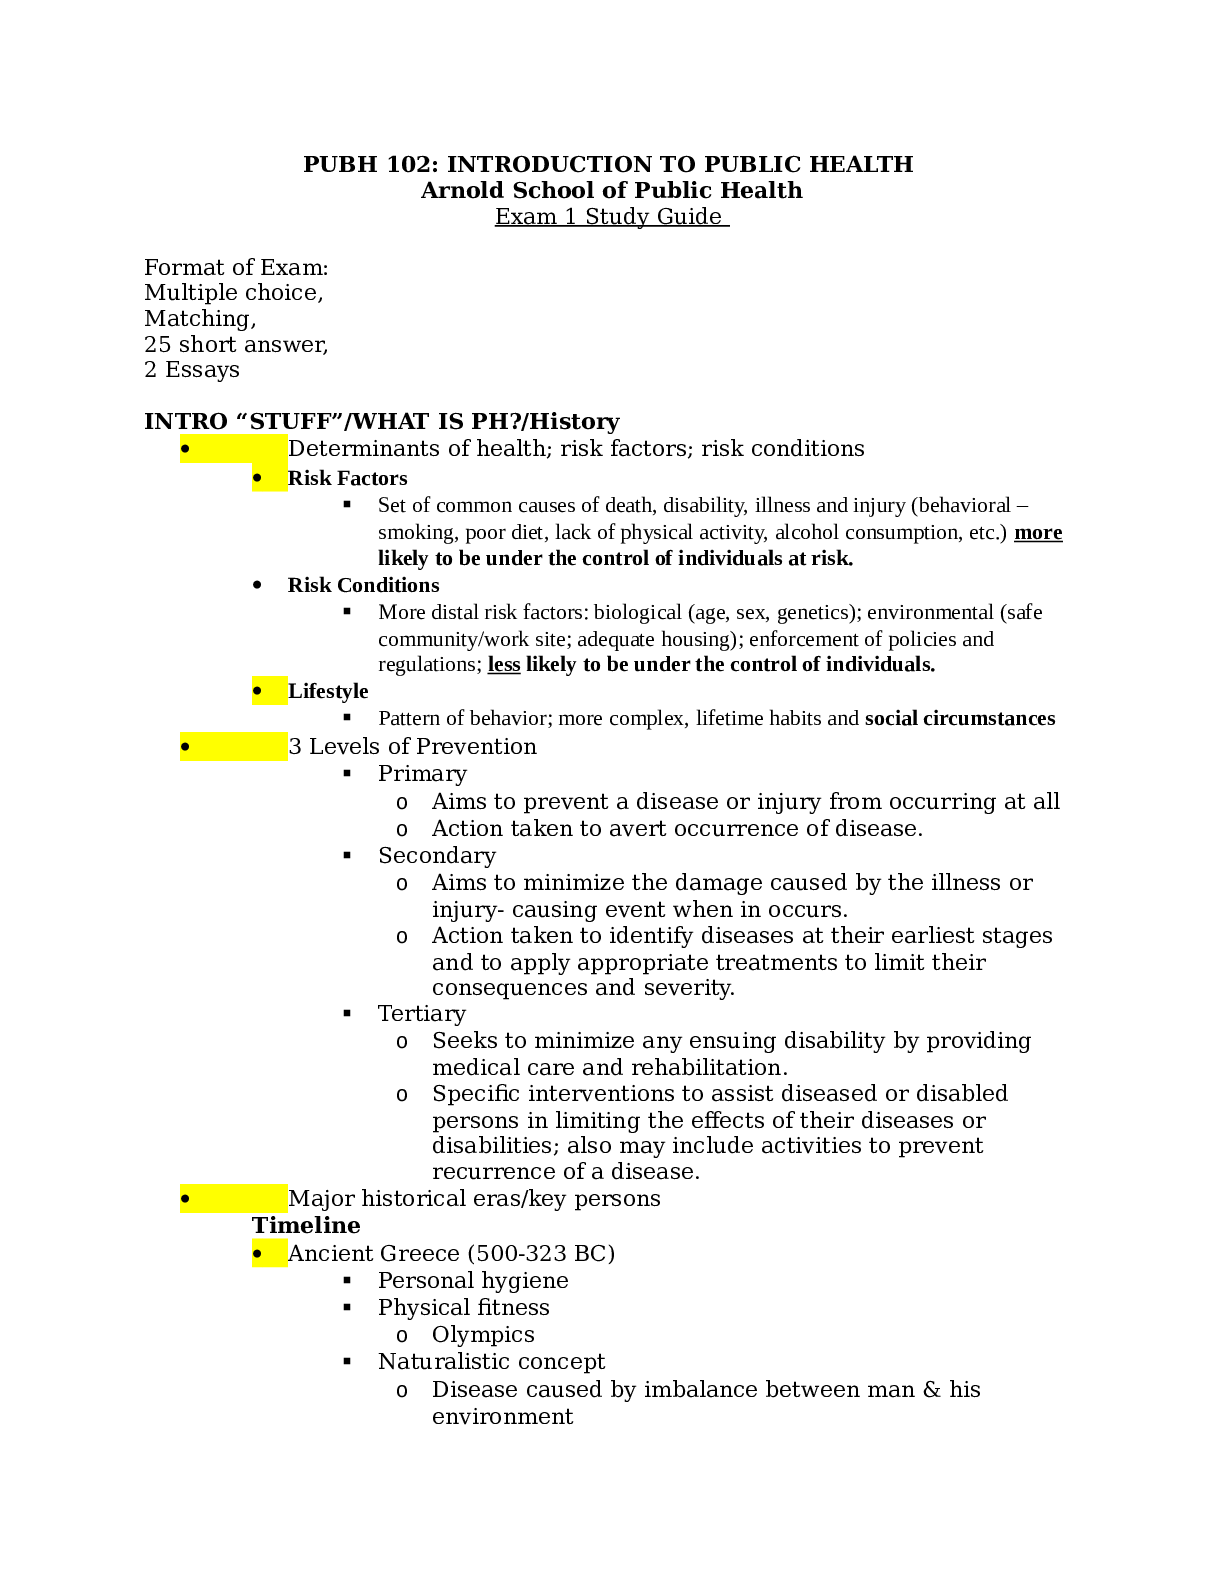
ASSEMBLY AND FACILITY OPERATIONS Year 8
AC Camera Image Sensor
Components
and Features
LCD Display Screen
Image Quality
Photo Modes
Camera Housing
$000s $ / Unit
6,116 9.90
6,116 9.90
7,951 12.87
5,505 8.91
9,885 16.00
UAV Drone Built-In Camera
Components
and Features
GPS / WiFi / Bluetooth
$000s
30,227
7,044
Battery Pack 21,132
Rotors/Performance/Controller 17,328
Body Frame Construction 6,339
$ / Unit
212.42
49.50
148.50
121.77
44.55
Editing / Sharing
Included Accessories
Extra Performance Features
9,885
12,356
8,477
16.00
20.00
13.72
Obstacle Sensors
Camera Stabilization Device
Extra Performance Features
12,961
2,536
12,552
91.08
17.82
88.21
Total Cost of Components and Features
Assembly Regular-Time Labor
66,291
18,996
107.30
30.75
Total Cost of Components and Features
Assembly Regular-Time Labor
110,119
7,652
773.85
53.77
Labor Overtime Labor
Costs PAT Training
0
1,505
0.00
2.44
Labor Overtime Labor
Costs PAT Training
0
666
0.00
4.68
Total Cost of Labor and Training 3,506 33.18 Total Cost of Labor and Training 8,318 58.45
Product R&D Expenditures 6,000 9.71 Product R&D Expenditures 12,000 84.33
Allowance for Warranty Repairs (18.6% claims) 5,745 9.30 Allowance for Warranty Repairs (20.0% claims) 8,550 60.08
Plant Operations and Maintenance 12,800 20.72 Plant Operations and Maintenance 9,760 68.59
Depreciation of Plant and Equipment 8,063 13.05 Depreciation of Plant and Equipment 5,513 38.74
Total Camera Production/Assembly Cost 119,400 193.27 Total Drone Production/Assembly Cost 154,260 1,084.05
Copyright © 2017 GLO-BUS Software, Inc. Page 2
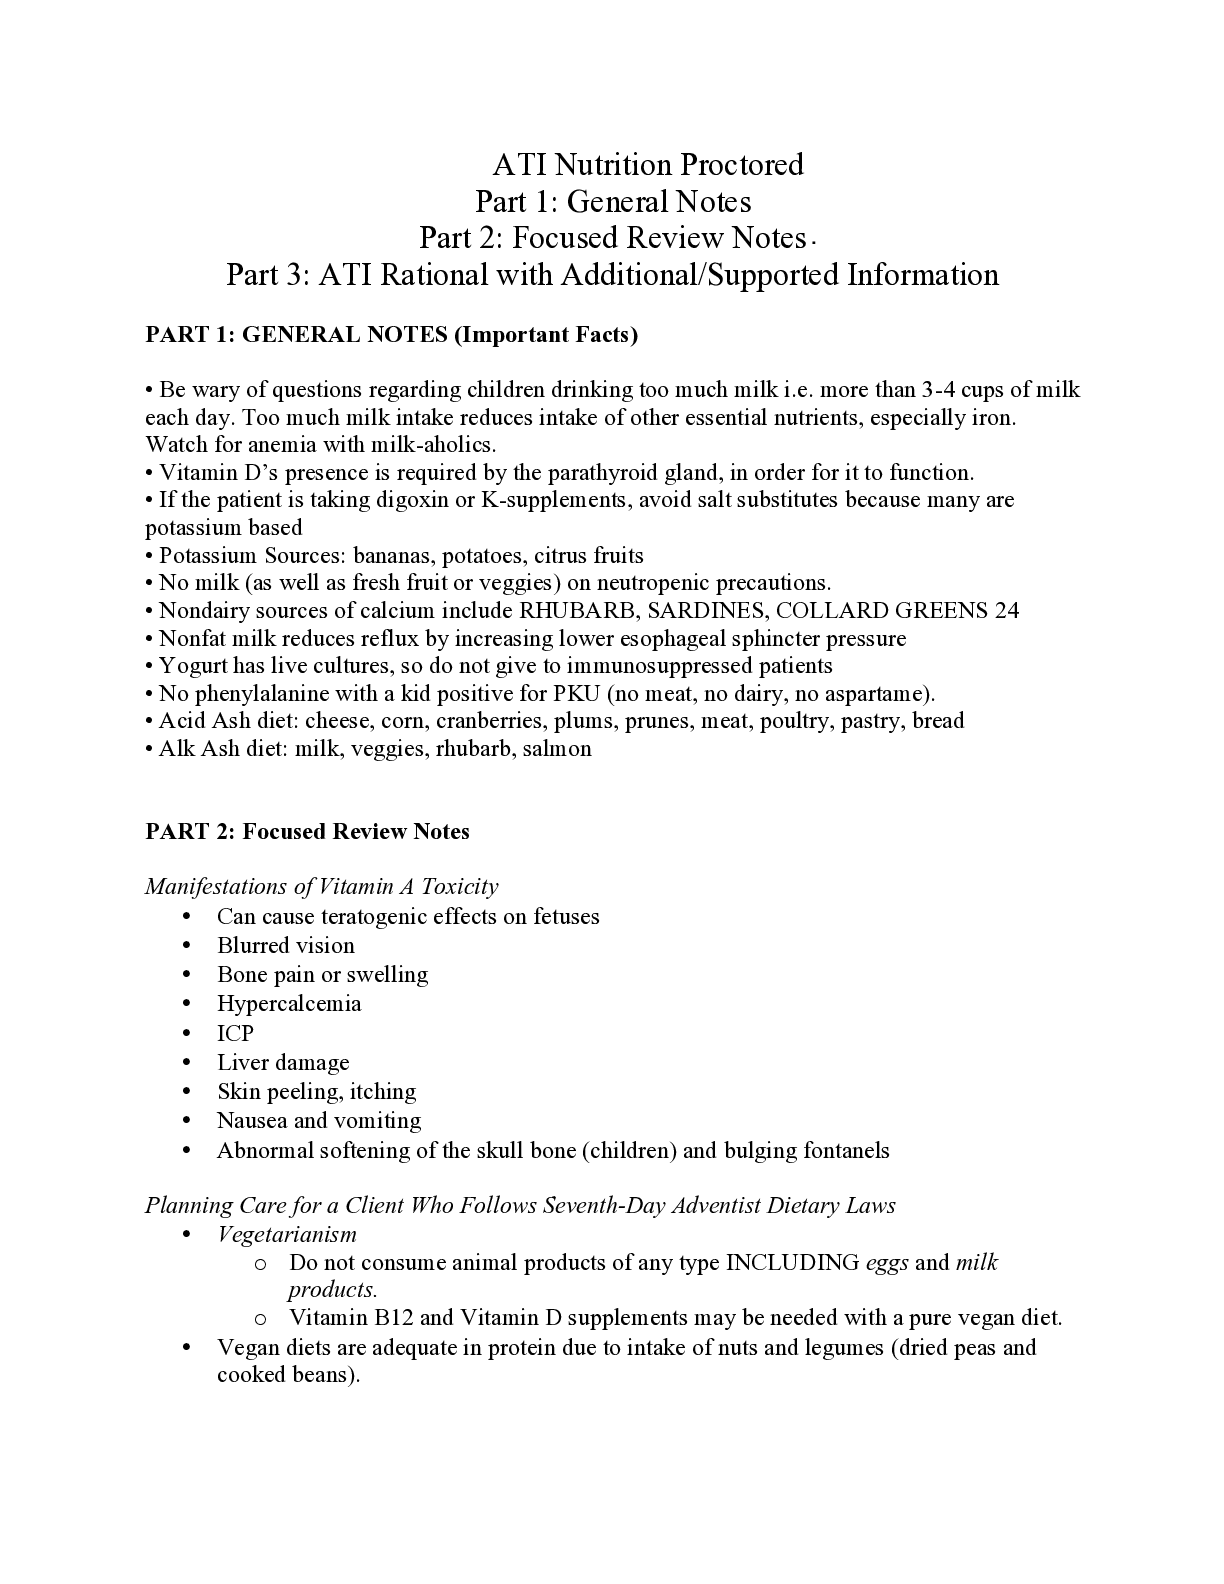
UAV Drone Production
Units Assembled (000s) Product Attributes
Regular-Time 142.3 ExtraPerformance Features 5
Overtime 0.0 Number of Models 3
Total 142.3 P/Q Rating 5.1
Product R&D Expenditures in Year 8 ($000s) $ 12,000
Cumulative Product R&D Expenditures ($000s) $ 63,000
UAV Drone Assembly Facility
Space Available for Workstations (at end of Year 7) 110 spaces
New Spaces Added (facility expansion at begin. of Y8) 0
Space Available for Drone Workstations (in Year 8) 110 spaces
Installed Workstations (at end of Year 7) 110 workstations
New workstations Added (at beginning of Y8) 0
Total Installed Workstations (available for use in Y8) 110 workstations
Investment in UAV Drone Facility ($000s)
Beginning New Year 8
Gross Year 8 Facilities
Investment Investment Investment
Plant Facility $ 97,750 $ 1,500 $ 99,250
Workstations 11,000 0 11,000
Robotics Upgrade 0 0 0
Total (Gross) Investment in UAV Drone Facilities $ 110,250
– Accumulated Depreciation (at the end of Year 7) 20,751
– Current-Year Depreciation (5% of gross investment) 5,513
Net Investment in UAV Drone Facilities $ 83,986
UAV Drone Work Force Statistics
Year 8 $ Per
Decisions Worker
Base Wage Per PAT Member +2% $ 23,347
Incentive Bonus (to reduce warranty claims) $5.00 / unit 2,349
Attendance Bonus (for perfect attendance) $1,000 / worker 1,000
Fringe Benefit Package $6,000 / worker 6,000
Total Compensation (annual pay per worker) $ 32,696
Best Practices / Productivity Improvement Training ($/PAT) $ 9,000
PAT Productivity (units assembled per PAT per year) 1,940
Number of PATs Employed (for AC camera assembly) 74
× Number of Workers Per PATs (no robotics upgrade) × 4
Total Number of Workers Employed 296
UAV Drone Production and Assembly Costs
AC Camera Production
Units Assembled (000s) Product Attributes
Regular-Time 617.8 ExtraPerformance Features 4
Overtime 0.0 Number of Models 5
Total 617.8 P/Q Rating 5.2
Product R&D Expenditures in Year 8 ($000s) $ 6,000
Cumulative Product R&D Expenditures ($000s) $ 69,000
AC Camera Assembly Facility
Space Available for Workstations (at end of Year 7) 300 spaces
New Spaces Added (facility expansion at begin. of Y8) 0
Space Available for ACC Workstations (in Year 8) 300 spaces
Installed Workstations (at end of Year 7) 300 workstations
New workstations Added (at beginning of Y8) 0
Total Installed Workstations (available for use in Y8) 300 workstations
Investment in AC Camera Facility ($000s)
Beginning New Year 8
Gross Year 8 Facilities
Investment Investment Investment
Plant Facility $ 127,750 $ 1,500 $ 129,250
Workstations 32,000 0 32,000
Robotics Upgrade 0 0 0
Total (Gross) Investment in AC Camera Facilities $ 161,250
– Accumulated Depreciation (at the end of Year 7) 53,351
– Current-Year Depreciation (5% of gross investment) 8,063
Net Investment in AC Camera Facilities $ 99,836
AC Camera Work Force Statistics
Year 8 $ Per
Decisions Worker
Base Wage Per PAT Member +2% $ 21,648
Incentive Bonus (to reduce warranty claims) $2.50 / unit 2,044
Attendance Bonus (for perfect attendance) $1,000 / worker 1,000
Fringe Benefit Package $2,000 / worker 2,000
Total Compensation (annual pay per worker) $ 26,692
Best Practices / Productivity Improvement Training ($/PAT) $ 8,500
PAT Productivity (units assembled per PAT per year) 3,506
Number of PATs Employed (for AC camera assembly) 177
× Number of Workers Per PATs (no robotics upgrade) × 4
Total Number of Workers Employed 708
AC Camera Production and Assembly Costs
Action-Capture Cameras UAV Drones
Action Digital
(Industry 1)
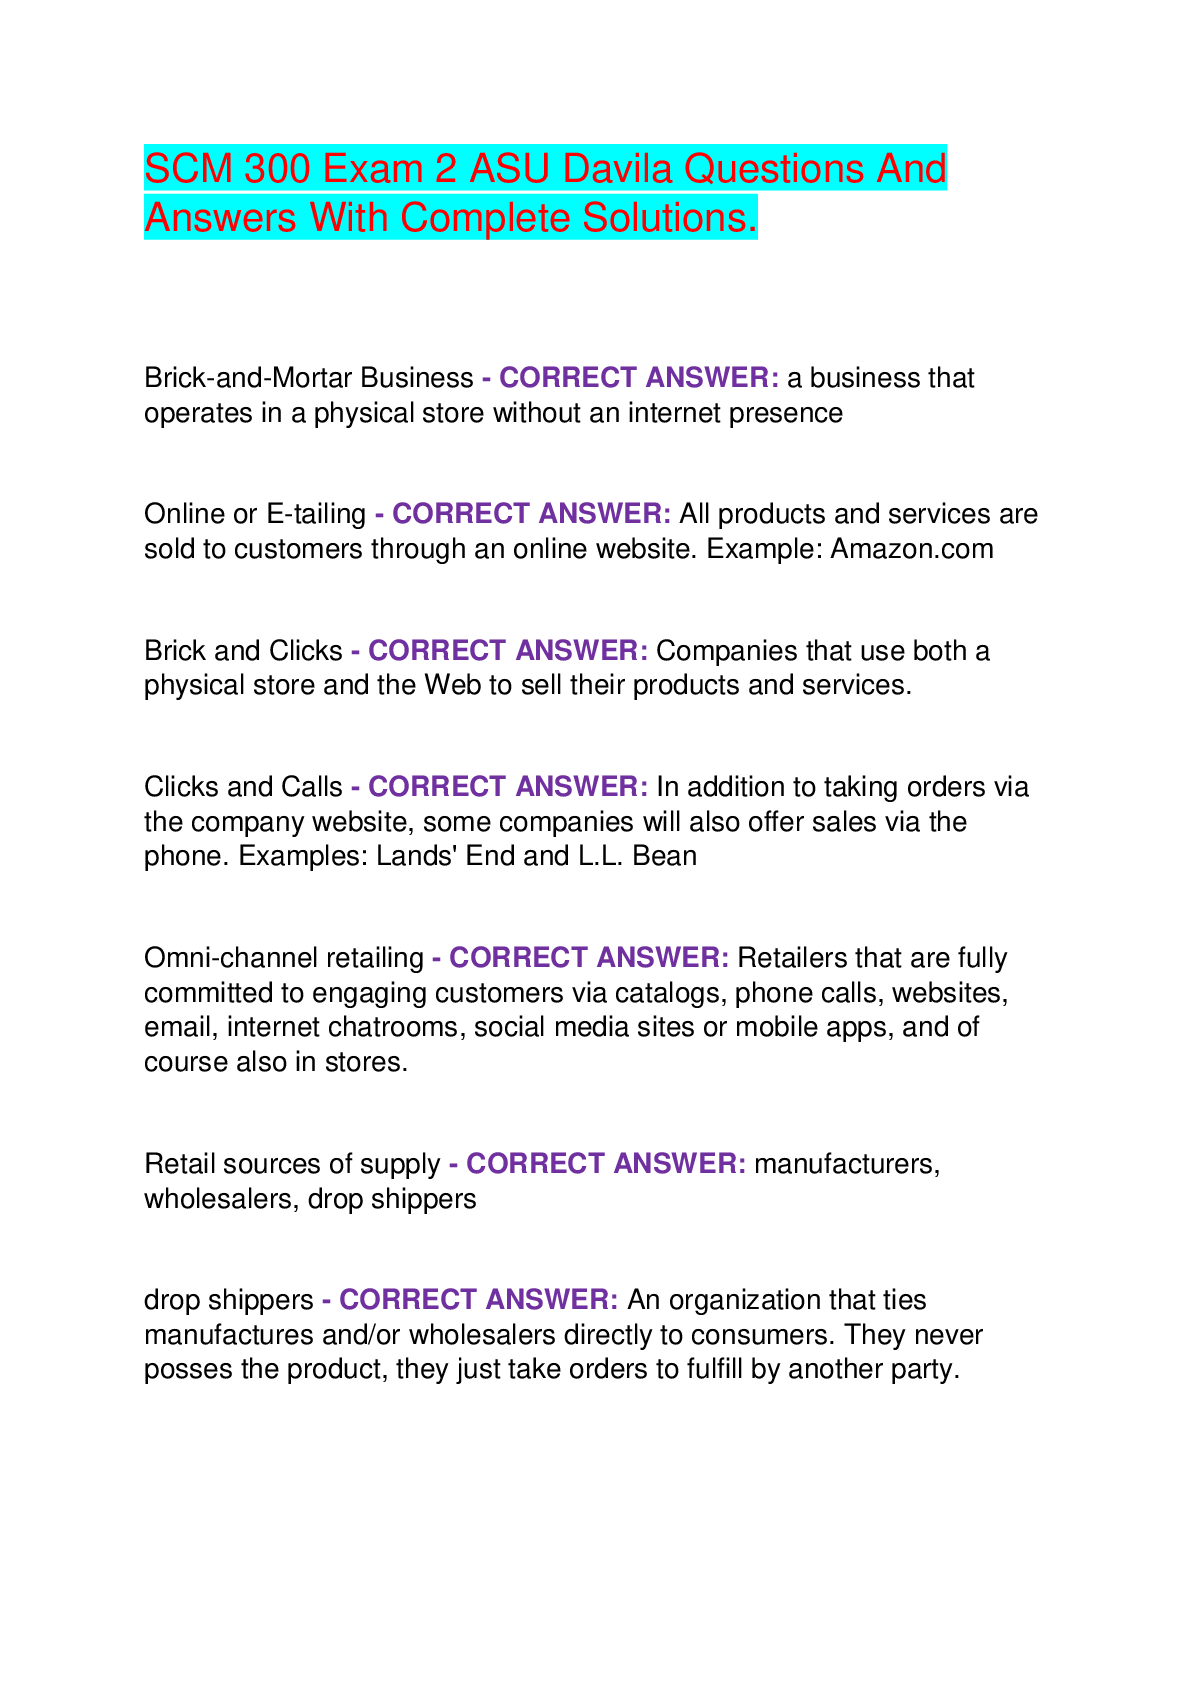
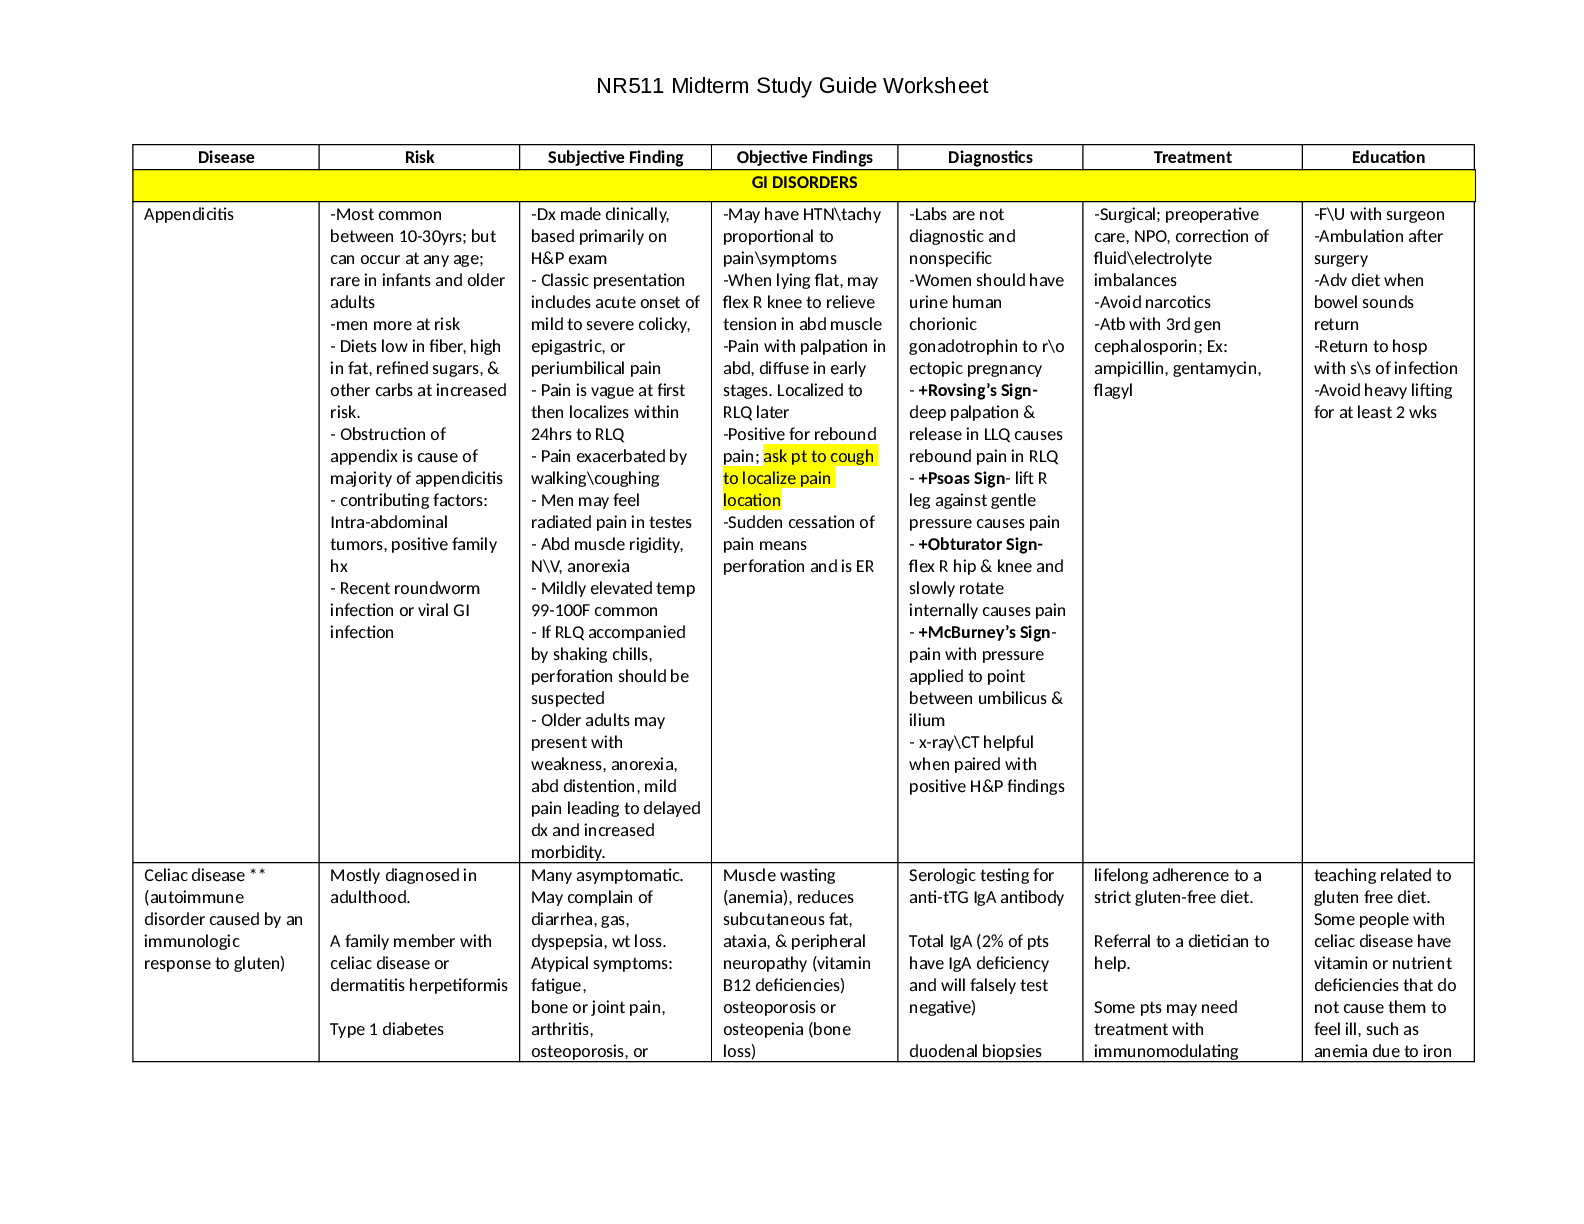
AC CAMERAS – MARKET SEGMENT PERFORMANCE Year 8
Regular AC Camera Sales North America Europe-Africa Asia-Pacific Latin America Overall
Revenue-Cost-Profit Breakdown $000s $ / Unit $000s $ / Unit $000s $ / Unit $000s $ / Unit $000s
Revenues Gross Revenues 113,805 450.00 62,100 500.00 60,095 425.00 42,203 425.01 278,203
– Promo Discounts -10,505 -41.54 -5,732 -46.15 -3,698 -26.15 -2,597 -26.15 -22,532
± Exchange Rate Adj. -1,614 -6.38 1,898 15.28 -624 -4.41 -1,186 -11.94 -1,526
Net Revenues 101,686 402.08 58,266 469.13 55,773 394.43 38,420 386.91 254,145
Production Costs (components / assembly) 48,876 193.26 24,004 193.27 27,327 193.26 19,192 193.27 119,399
Delivery Shipping 1,265 5.00 621 5.00 707 5.00 497 5.01 3,090
Costs Import Duties 0 0.00
2,484 20.00 3,606 25.50 2,532 25.50 8,622
Marketing Retailer Support 1,710 6.76 1,440 11.59 1,110 7.85 780 7.85 5,040
Costs Advertising 7,000 27.68
2,500 20.13 1,000 7.07 800 8.06 11,300
Website Expenditures 2,500 9.89 2,000 16.10 900 6.36 750 7.55 6,150
Administrative Expenses 2,760 10.91 1,355 10.91 1,543 10.91 1,084 10.92 6,742
Operating Profit 37,575 148.58 23,862 192.13 19,580 138.47 12,785 128.75 93,802
Operating Profit Margin 37.0% 41.0% 35.1% 33.3% 37%
Unit Demand and Sales Units
(000s)
Market
Share
Units
(000s)
Market
Share
Units
(000s)
Market
Share
Units
(000s)
Market
Share
Market
Share
Projected Demand (from decision entries)
Actual Demand (as determined by competition
among rival companies in Y8)
Units Gained/Lost (due to stock-outs)
272.0
252.9
0.0
29.4%
29.7%
175.3
124.2
0.0
22.5%
31.7%
161.8
141.4
0.0
19.4%
21.6%
115.1
99.3
0.0
19.3%
21.4%
23.9%
26.9%
Total Units Assembled and Shipped 252.9 29.7% 124.2 31.7% 141.4 21.6% 99.3 21.4% 26.9%
Retail Outlets Year 8 Year 9 Year 8 Year 9 Year 8 Year 9 Year 8 Year 9
Number of
Outlets
Multi-Store Chains
Online Retailers
Local Retail Shops
53
122
4,926
63
145
5,931
48
103
4,310
56
129
5,320
41
85
3,604
49
111
4,551
34
74
2,552
45
98
3,070
Number of retail
outlets willing to
carry the company's brand of AC
cameras.
Special AC Camera Contracts North America Europe-Africa Asia-Pacific Latin America Overall
Discount Offer (% off of standard price)
Value Index of Units Offered
Units Assembled / Sold (000s)
0.0% No
Offer
0
0.0 units
0.0% No
Offer
0
0.0 units
0.0% No
Offer
0
0.0 units
0.0% No
Offer
0
0.0 units
0 A
Offers
ccepted
0.0 units
Incremental Revenues-Costs-Margins $000s $ / Unit $000s $ / Unit $000s $ / Unit $000s $ / Unit $000s
Revenues Gross Revenues
± Exchange Rate Adj.
Net Revenues
Less: Cost of Components / Features
Assembly Labor Costs
Allowance for Warranty Repairs
Delivery (shipping and import duties)
Contribution Margin
0
0
0
0
0
0
0
0
0.00
0.00
0.00
0.00
0.00
0.00
0.00
0.00
0
0
0
0
0
0
0
0
0.00
0.00
0.00
0.00
0.00
0.00
0.00
0.00
0
0
0
0
0
0
0
0
0.00
0.00
0.00
0.00
0.00
0.00
0.00
0.00
0
0
0
0
0
0
0
0
0.00
0.00
0.00
0.00
0.00
0.00
0.00
0.00
0
0
0
0
0
0
0
0
All AC Camera Operations North America Europe-Africa Asia-Pacific Latin America Overall
Revenue-Cost-Profit Breakdown $000s $000s $000s $000s $000s
Net Revenues
Operating Production Costs
Costs Delivery (shipping / duties)
Marketing Costs
Administrative Costs
Operating Profit
Operating Profit Margin
101,686
48,876
1,265
11,210
2,760
37,575
37.0%
58,266
24,004
3,105
5,940
1,355
23,862
41.0%
55,773
27,327
4,313
3,010
1,543
19,580
35.1%
38,420
19,192
3,029
2,330
1,084
12,785
33.3%
254,145
119,399
11,712
22,490
6,742
93,802
36.9%
Warranty Period / Claims / Costs
Warranty Period Offered in Year 8
Anticipated Warranty Claim Rate
Allowance for Warranty Repairs ($000s)
Warranty Repair Cost ($ per unit sold)
360 days
18.6%
2,350
9.29
360 days
18.6%
1,155
9.30
360 days
18.6%
1,315
9.30
360 days
18.6%
925
9.32
18.6%
5,745
9.30
[Show More]


.png)


.png)