Economics > LECTURE SLIDES/NOTES > ECON 1002: Lecture 1: Introductory Macroeconomics (All)
ECON 1002: Lecture 1: Introductory Macroeconomics
Document Content and Description Below
Last updated: 3 years ago
Preview 1 out of 77 pages
Instant download

Buy this Document to get the Full Access Instantly
Provided by Students Who Aced it
We Verify Document Content to Gurantee Accuracy
Reviews( 0 )
Document information
Connected school, study & course
About the document
Uploaded On
Nov 28, 2019
Number of pages
77
Written in
All

Additional information
This document has been written for:
Uploaded
Nov 28, 2019
Downloads
0
Views
282
Document Keyword Tags
Recommended For You
Get more on LECTURE SLIDES/NOTES »
ECON 1002: Introductory Macroeconomics School of Economics Fac...
ECON 1002: Introductory Macroeconomics School of Economics Fac...

ECON1002 Introductory Macroeconomics: SECTION B: Essay/Short‐a...
ECON 1002 Week 6 Final Test_Latest Complete 100% Answers.

ECON 1002: Microeconomics Exam 3_Latest Spring Complete A+ So...
.png)
ECON 1002 Current Location: Quiz Week 5 GRADED A QUESTIONS A...
ECON 1002: Microeconomics Exam 2_Latest Spring 2020 Complete A...
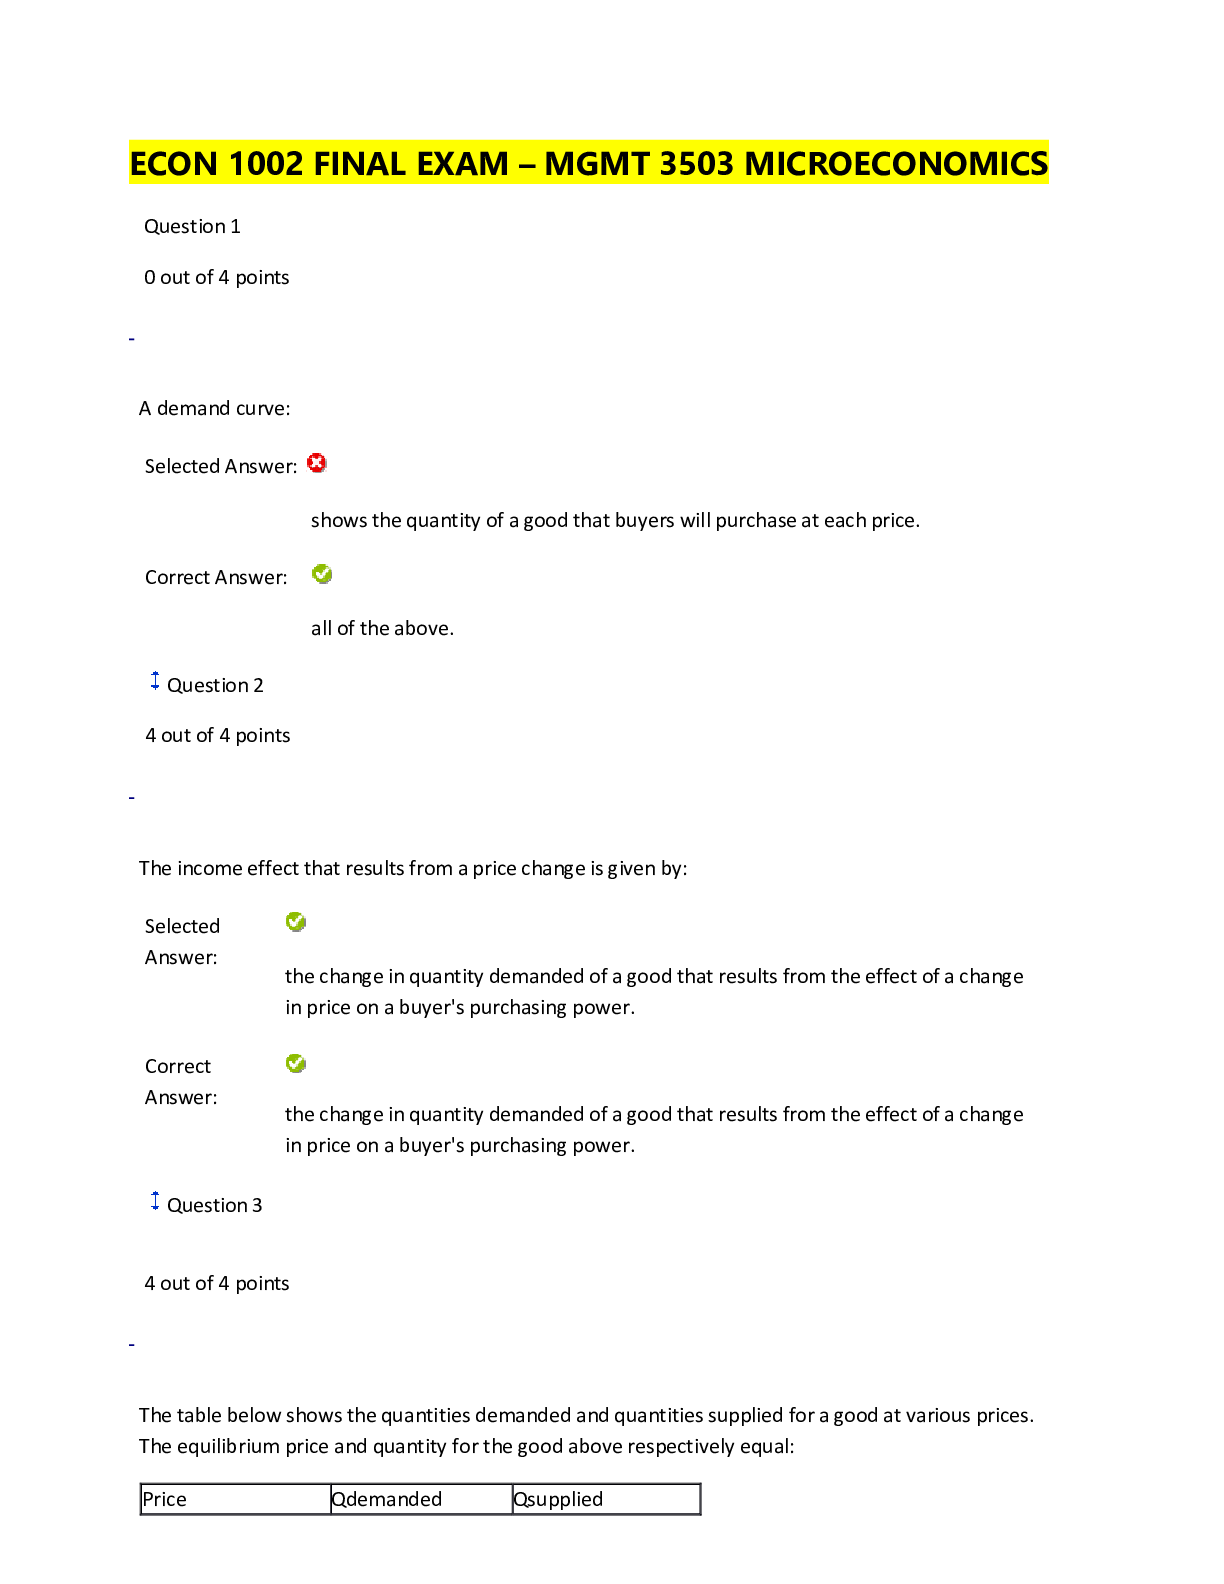
ECON 1002 FINAL EXAM – MGMT 3503 MICROECONOMICS WITH ANSWERS
ECON 1002: Microeconomics Exam 2_Latest Spring 2020 Complete A...

Introductory Econometrics A Modern Approach, 7e Jeffrey Wooldr...
Essentials of Econometrics, 5th Edition by Damodar Gujarati, D...
.png)
Microeconomics Theory and Applications, 13e Edgar Browning, Ma...


What is Scholarfriends
Scholarfriends.com Online Platform by Browsegrades Inc. 651N South Broad St, Middletown DE. United States.
We are here to help
We're available through e-mail, Twitter, and live chat.
FAQ
Questions? Leave a message!

Copyright © Scholarfriends · High quality services·