Statistics > QUESTIONS & ANSWERS > Sophia Statistics Unite 4 Milestone Questions and Answers Already Passed (All)
Sophia Statistics Unite 4 Milestone Questions and Answers Already Passed
Document Content and Description Below
Last updated: 3 years ago
Preview 1 out of 20 pages
Instant download
Buy this Document to get the Full Access Instantly
Provided by Students Who Aced it
We Verify Document Content to Gurantee Accuracy
Also available in bundle (1)
Click Below to Access Bundle(s)
Sophia Statistics Milestone 1, 2, 3, 4, 5 and Final Milestone Statistics Questions and Answers Already Passed - | Western Governors University (WGU) | All Rated A
You passed this Milestone 21 questions were answered correctly. 4 questions were answered incorrectly. 1 Sukie interviewed 125 employees at her company and discovered that 21 of them planned to ta...
By Nutmegs 4 years ago
$40
7
Reviews( 0 )
Document information
Connected school, study & course
About the document
Uploaded On
Jun 23, 2022
Number of pages
20
Written in
All

Additional information
This document has been written for:
Uploaded
Jun 23, 2022
Downloads
0
Views
278
Topic Tags
Recommended For You
Get more on QUESTIONS & ANSWERS »
Sampling Design and Analysis, 3e by Sharon Lohr (Solutions Man...
.png)
TEST BANK for Business Statistics, 4e Norean Sharpe, Richard V...
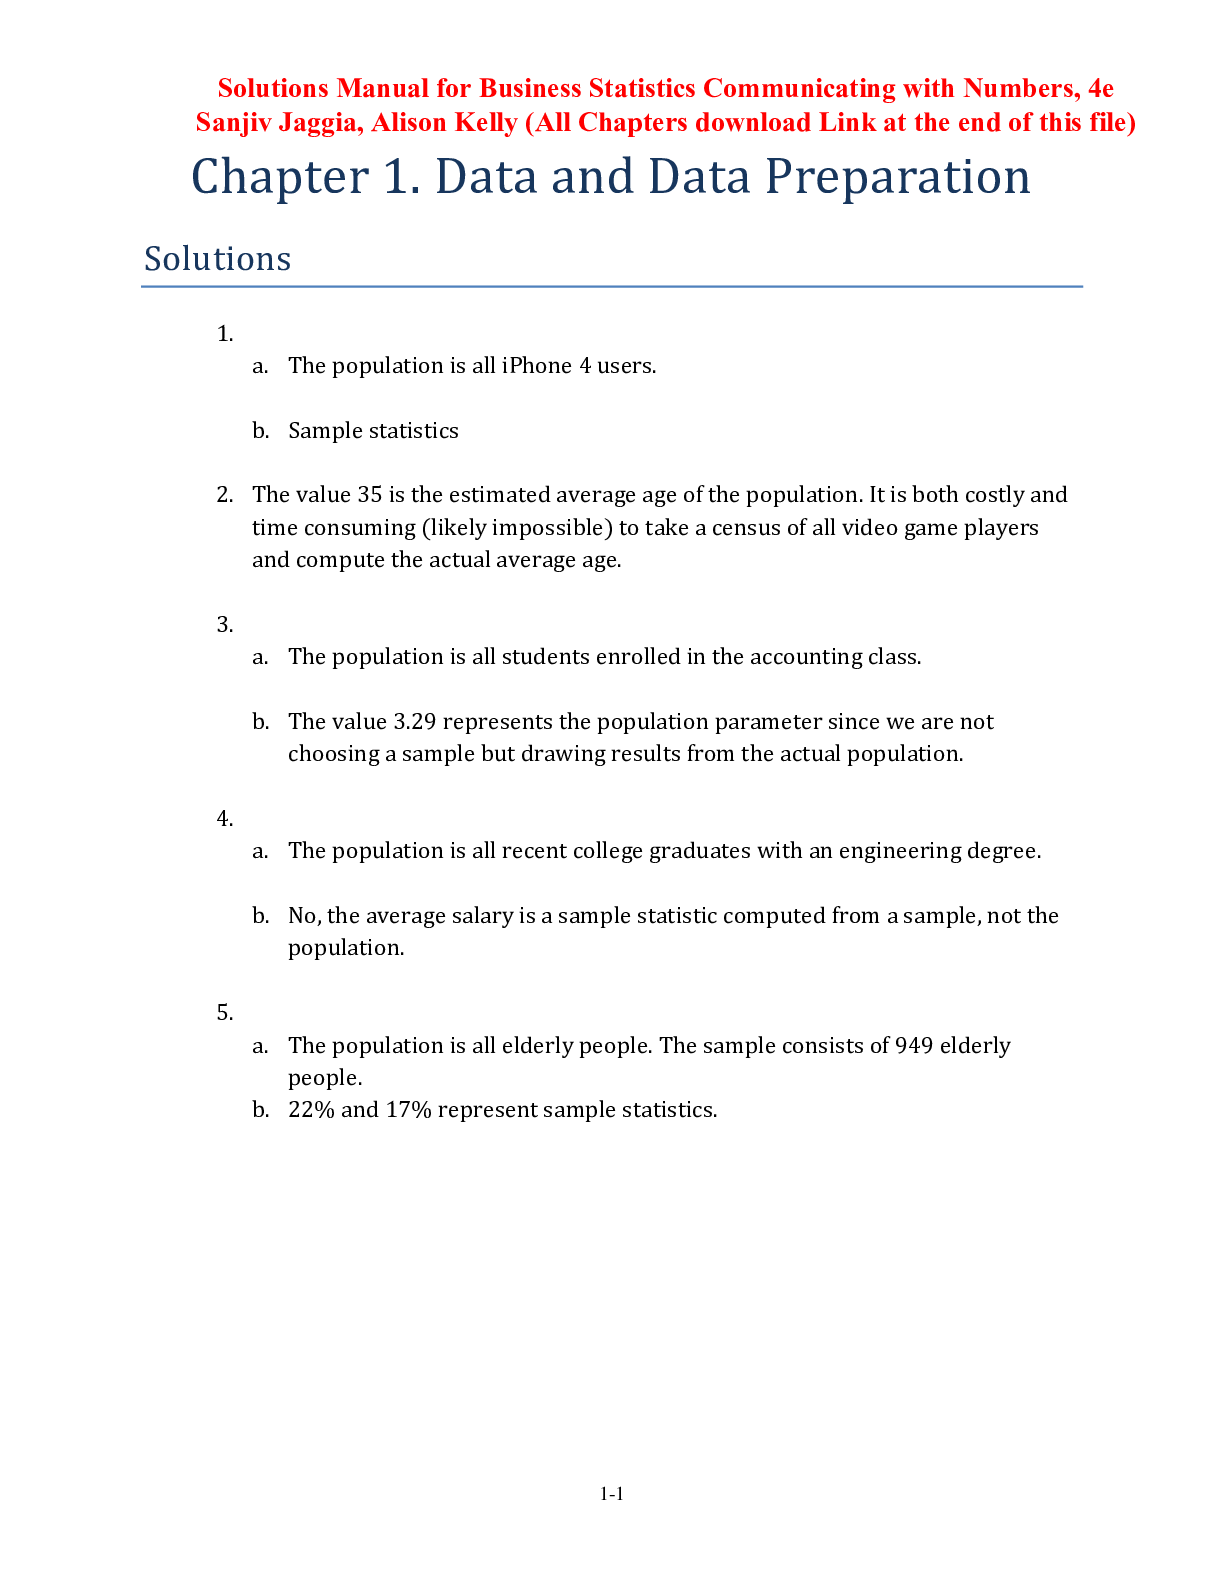
Solutions Manual for Business Statistics Communicating with Nu...
The Basic Practice of Statistics, 9th Edition Moore, Notz, Fli...

Test Bank for Advanced and Multivariate Statistical Methods Pr...
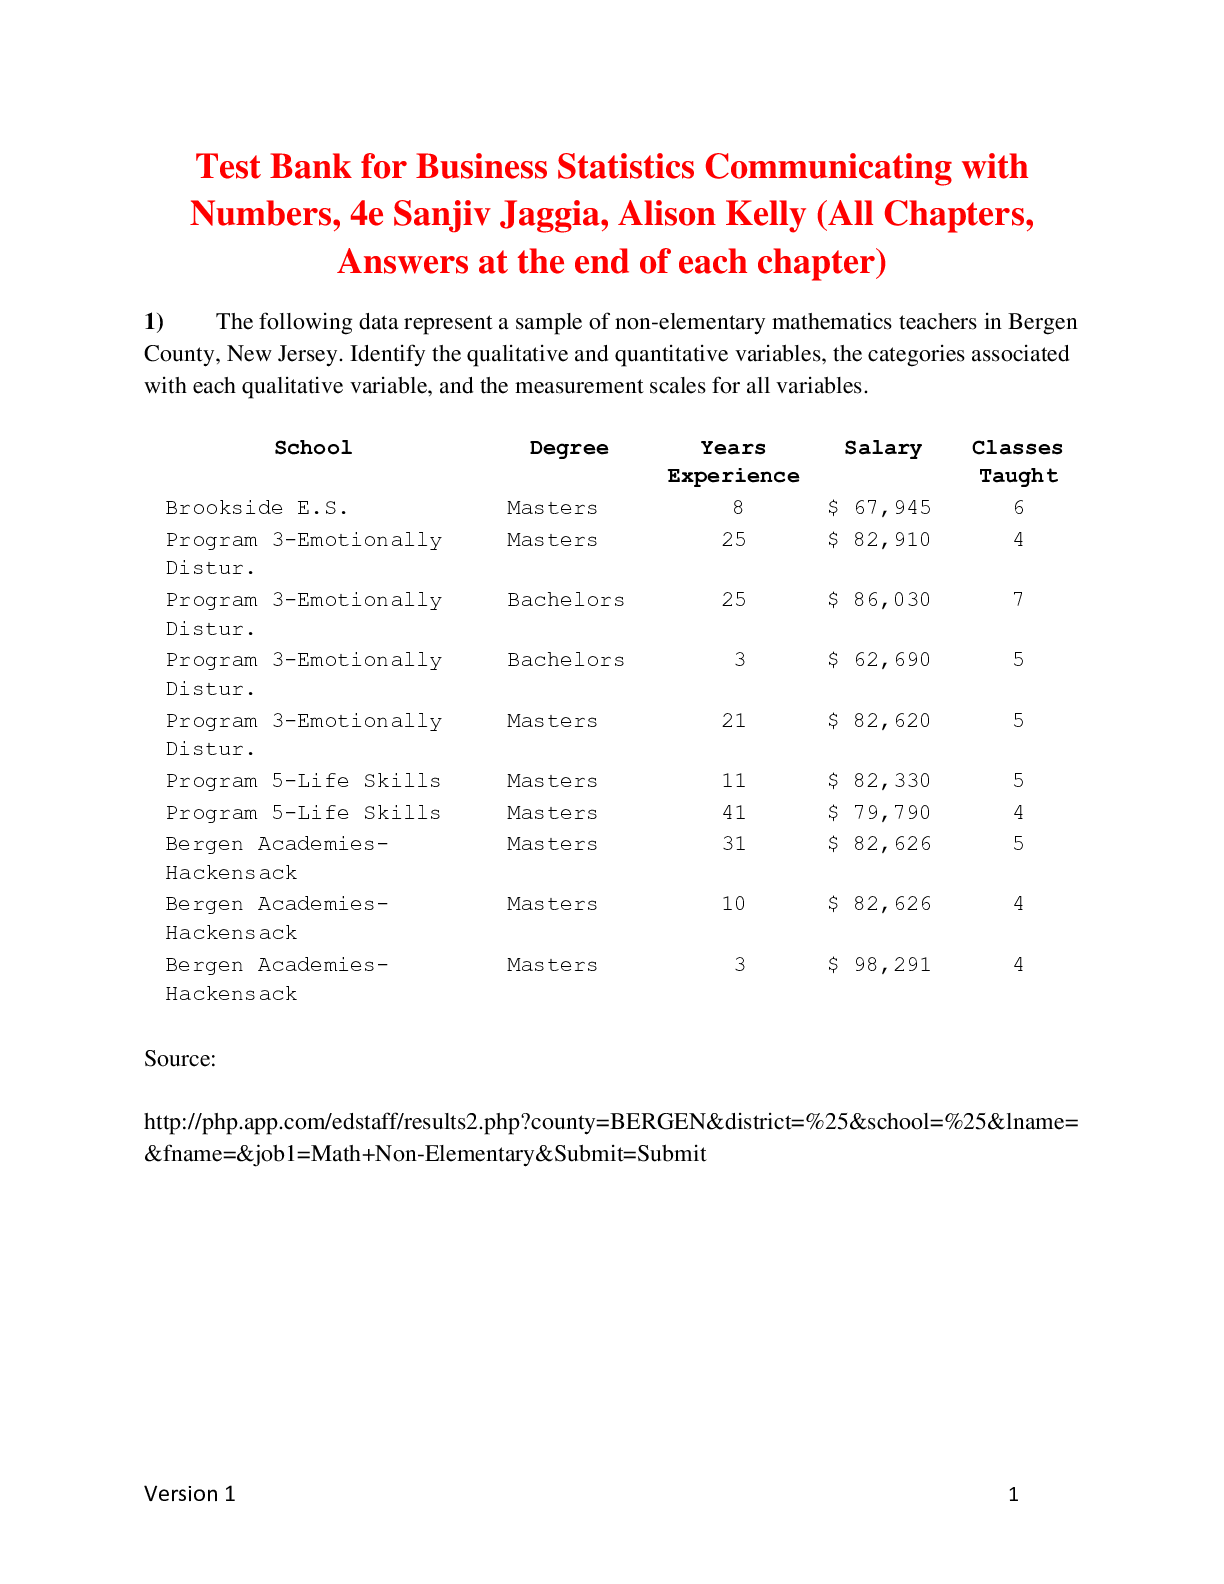
Business Statistics Communicating with Numbers, 4e Sanjiv Jagg...
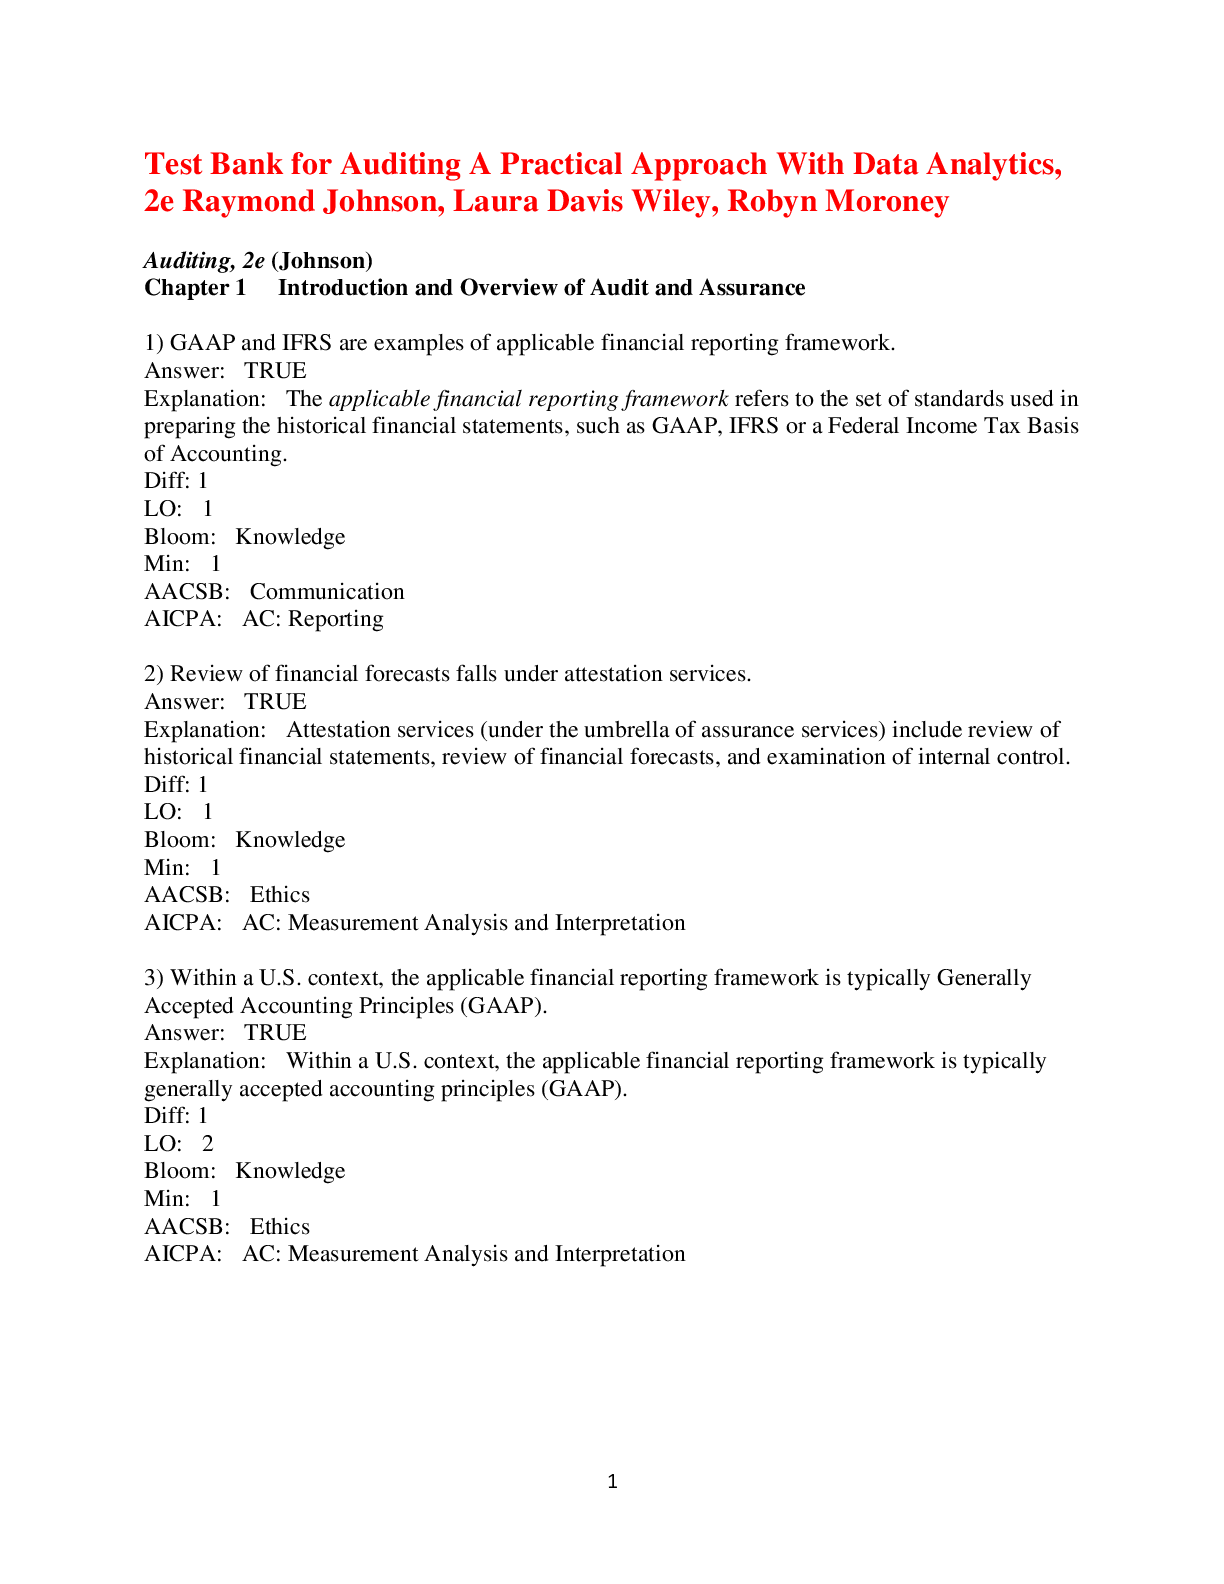
Auditing A Practical Approach with Data Analytics, 2e Raymond...
.png)
Introduction to Statistical Investigations, 2e Tintle, Chance,...

Essentials of Statistics for the Behavioral Sciences 3rd Editi...
Introduction to Statistical Investigations, 2e Tintle, Chance,...

Data Analysis and Statistics for Geography, Environmental Scie...

An Introduction to Statistical Concepts, 4e Debbie Hahs-Vaughn...

Test Bank for Essentials of Statistics for the Behavioral Scie...
Practice of Statistics in the Life Sciences, Digital Update, 4...

Making Sense of Statistics A Conceptual Overview, 7e Fred Pyrc...
An Introduction to Statistical Concepts, 4e by Debbie Hahs-Vau...

Introduction to the Practice of Statistics, 10e David Moore, G...
.png)
Business Statistics For Contemporary Decision Making, 3rd Cana...
.png)