Information Technology > QUESTIONS & ANSWERS > A4_DataAnalysis December 13, 2019 1 COGS 108 - Assignment 4: Data Analysis 2 Important Reminders (All)
A4_DataAnalysis December 13, 2019 1 COGS 108 - Assignment 4: Data Analysis 2 Important Reminders
Document Content and Description Below
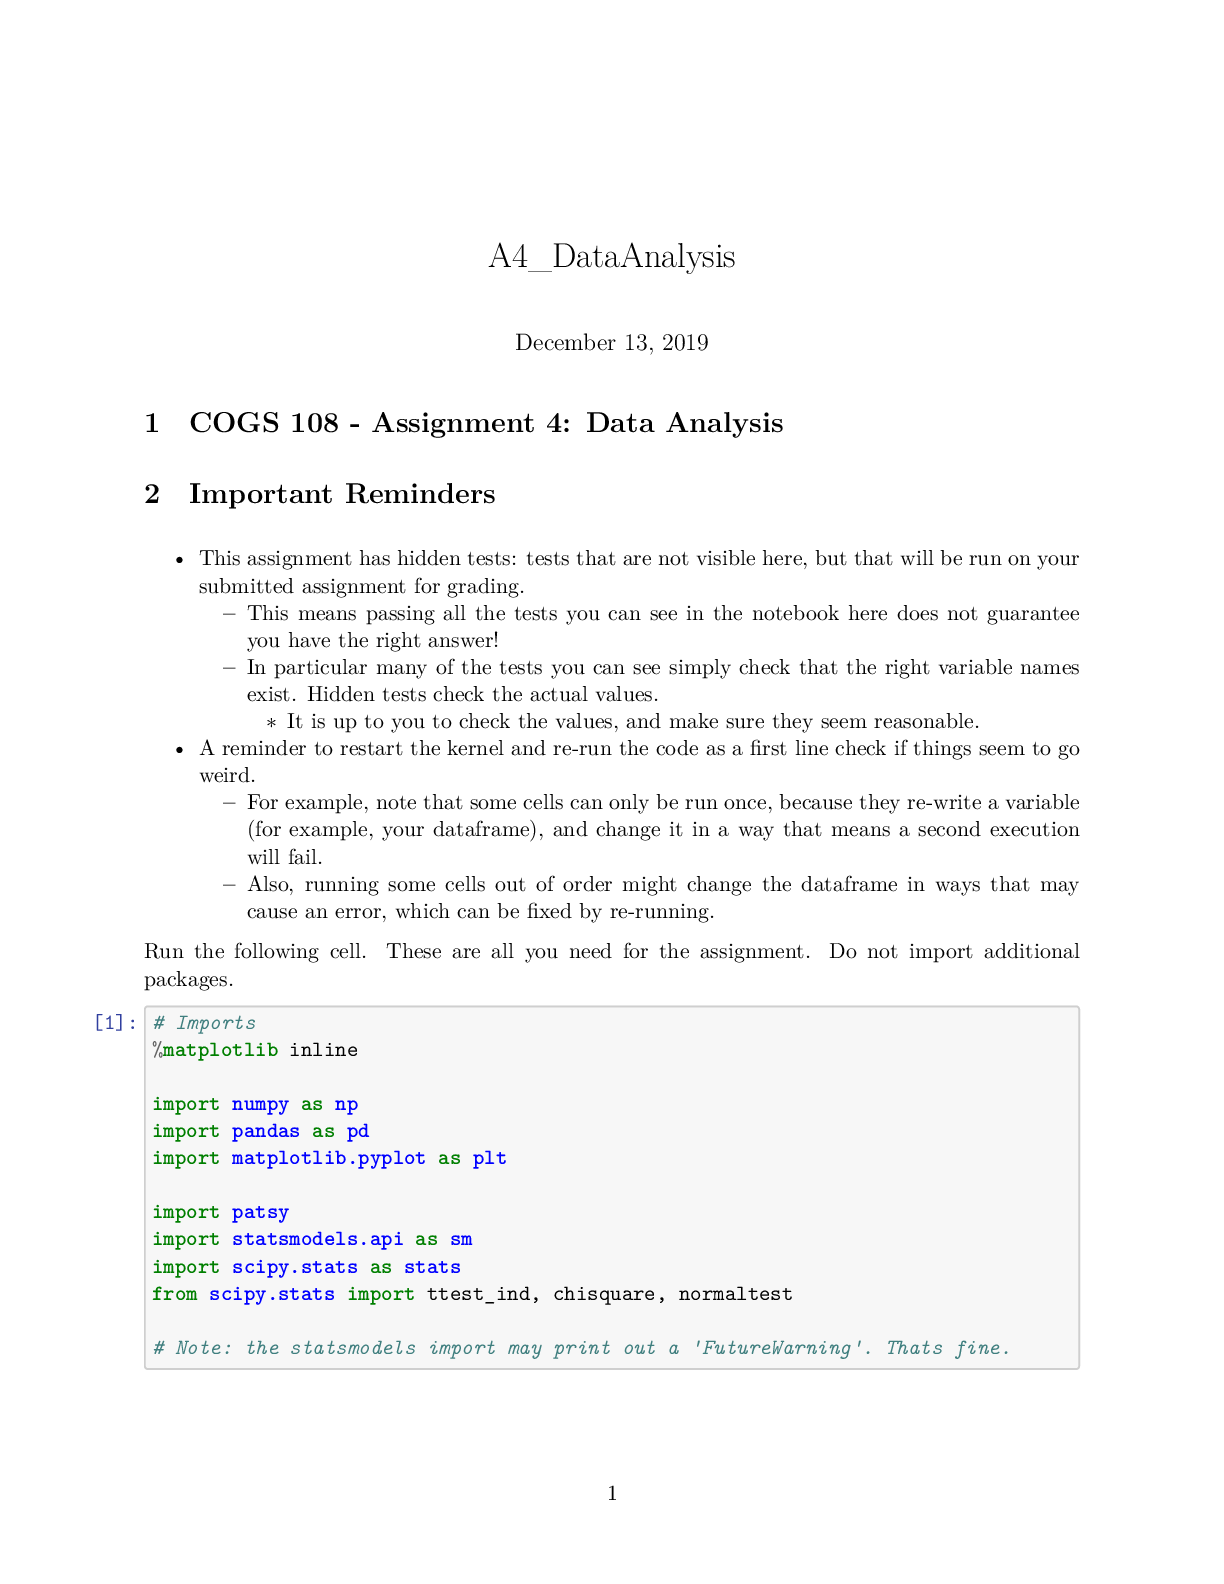
COGS 108 - Assignment 4: Data Analysis 2 Important Reminders • This assignment has hidden tests: tests that are not visible here, but that will be run on your submitted assignment for grading. � ... �� This means passing all the tests you can see in the notebook here does not guarantee you have the right answer! – In particular many of the tests you can see simply check that the right variable names exist. Hidden tests check the actual values. ∗ It is up to you to check the values, and make sure they seem reasonable. • A reminder to restart the kernel and re-run the code as a first line check if things seem to go weird. – For example, note that some cells can only be run once, because they re-write a variable (for example, your dataframe), and change it in a way that means a second execution will fail. – Also, running some cells out of order might change the dataframe in ways that may cause an error, which can be fixed by re-running. Run the following cell. These are all you need for the assignment. Do not import additional packages. [1]: # Imports %matplotlib inline import numpy as np import pandas as pd import matplotlib.pyplot as plt import patsy import statsmodels.api as sm import scipy.stats as stats from scipy.stats import ttest_ind, chisquare, normaltest # Note: the statsmodels import may print out a 'FutureWarning'. Thats fine. 12.0.1 Notes - Assignment Outline Parts 1-6 of this assignment are modelled on being a minimal example of a project notebook. - This mimics, and gets you working with, something like what you will need for your final project. Parts 7 & 8 break from the project narrative, and are OPTIONAL (UNGRADED). - They serve instead as a couple of quick one-offs to get you working with some other methods that might be useful to incorporate into your project. 2.1 Setup Data: the responses collected from a survery of the COGS 108 class. - There are 417 observations in the data, covering 10 different ‘features’. Research Question: Do students in different majors have different heights? Background: Physical height has previously shown to correlate with career choice, and career success. More recently it has been demonstrated that these correlations can actually be explained by height in high school, as opposed to height in adulthood (1). It is currently unclear whether height correlates with choice of major in university. Reference: 1) https://www.sas.upenn.edu/~apostlew/paper/pdf/short.pdf Hypothesis: We hypothesize that there will be a relation between height and chosen major. 2.2 Part 1: Load & Clean the Data Fixing messy data makes up a large amount of the work of being a Data Scientist. The real world produces messy measurements and it is your job to find ways to standardize your data such that you can make useful analyses out of it. In this section, you will learn, and practice, how to successfully deal with unclean data. 2.2.1 1a) Load the data Import datafile COGS108_IntroQuestionnaireData.csv into a DataFrame called df. [2]: # YOUR CODE HERE df = pd.read_csv("COGS108_IntroQuestionnaireData.csv") [3]: assert isinstance(df, pd.DataFrame) [4]: # Check out the data df.head(5) [4]: Timestamp What year (in school) are you? What is your major? \ 0 1/9/2018 14:49:40 4 Cognitive Science 1 1/9/2018 14:49:45 3 Cognitive Science 22 1/9/2018 14:49:45 Third Computer Science 3 1/9/2018 14:49:45 2 Cogs HCI 4 1/9/2018 14:49:47 3 Computer Science How old are you? What is your gender? What is your height? \ 0 21 Male 5'8" 1 20 Male 5'8 2 21 Male 178cm 3 20 Male 5’8 4 20 Male 5'8" What is your weight? What is your eye color? Were you born in California? \ 0 147 Brown Yes 1 150 Brown Yes 2 74kg Black Yes 3 133 Brown Yes 4 160 Brown Yes What is your favorite flavor of ice cream? 0 Vanilla 1 Cookies and Cream 2 Matcha 3 Cookies and Cream 4 Cookies n' Cream Those column names are a bit excessive, so first let’s rename them - code provided below to do so. [5]: # Renaming the columns of the dataframe df.columns = ["timestamp", "year", "major", "age", "gender", "height", "weight", "eye_color", "born_in_CA", "favorite_icecream"] Pandas has a very useful function for detecting missing data. This function is called isnull(). If you have a dataframe called df, then calling df.isnull() will return another dataframe of the same size as df where every cell is either True of False. Each True or False is the answer to the question ‘is the data in this cell null?’. So, False, means the cell is not null (and therefore, does have data). True means the cell is null (does not have data). This function is very useful because it allows us to find missing data very quickly in our dataframe. As an example, consider the code below. [6]: # Check the first few rows of the 'isnull' dataframe df.isnull().head(5) [6]: timestamp year major age gender height weight eye_color \ 0 False False False False False False False False 1 False False False False False False False False 2 False False False False False False False False [Show More]
Last updated: 3 years ago
Preview 1 out of 45 pages
Buy this document to get the full access instantly
Instant Download Access after purchase
Buy NowInstant download
We Accept:

Reviews( 0 )
$7.00
Can't find what you want? Try our AI powered Search
Document information
Connected school, study & course
About the document
Uploaded On
Jul 21, 2022
Number of pages
45
Written in
All
Additional information
This document has been written for:
Uploaded
Jul 21, 2022
Downloads
0
Views
82

