Information Technology > STUDY GUIDE > 3 SYSTEMS DEVELOPMENT and DOCUMENTATION TECHNIQUES - Boston University Academy ACCT 706 (All)
3 SYSTEMS DEVELOPMENT and DOCUMENTATION TECHNIQUES - Boston University Academy ACCT 706
Document Content and Description Below
Last updated: 3 years ago
Preview 1 out of 13 pages
Instant download
Buy this document to get the full access instantly
Instant Download Access after purchase
Reviews( 0 )
Document information
Connected school, study & course
About the document
Uploaded On
Nov 15, 2022
Number of pages
13
Written in
All

Additional information
This document has been written for:
Uploaded
Nov 15, 2022
Downloads
0
Views
96
Document Keyword Tags
Recommended For You
Get more on STUDY GUIDE »

Information Technology for Managers, 2e George Reynolds (Test...


Information Technology Project Management 5th Edition Jack Mar...

Information Technology for Management Digital Strategies for I...

Information Technology for Management Digital Strategies for I...

Information Technology Auditing, 4e James A. Hall (Test Bank)

Information Technology for Management Advancing Sustainable Pr...

Information Technology Auditing, 4e James A. Hall (Solution Ma...
Information Technology Project Management 8th Edition Kathy Sc...
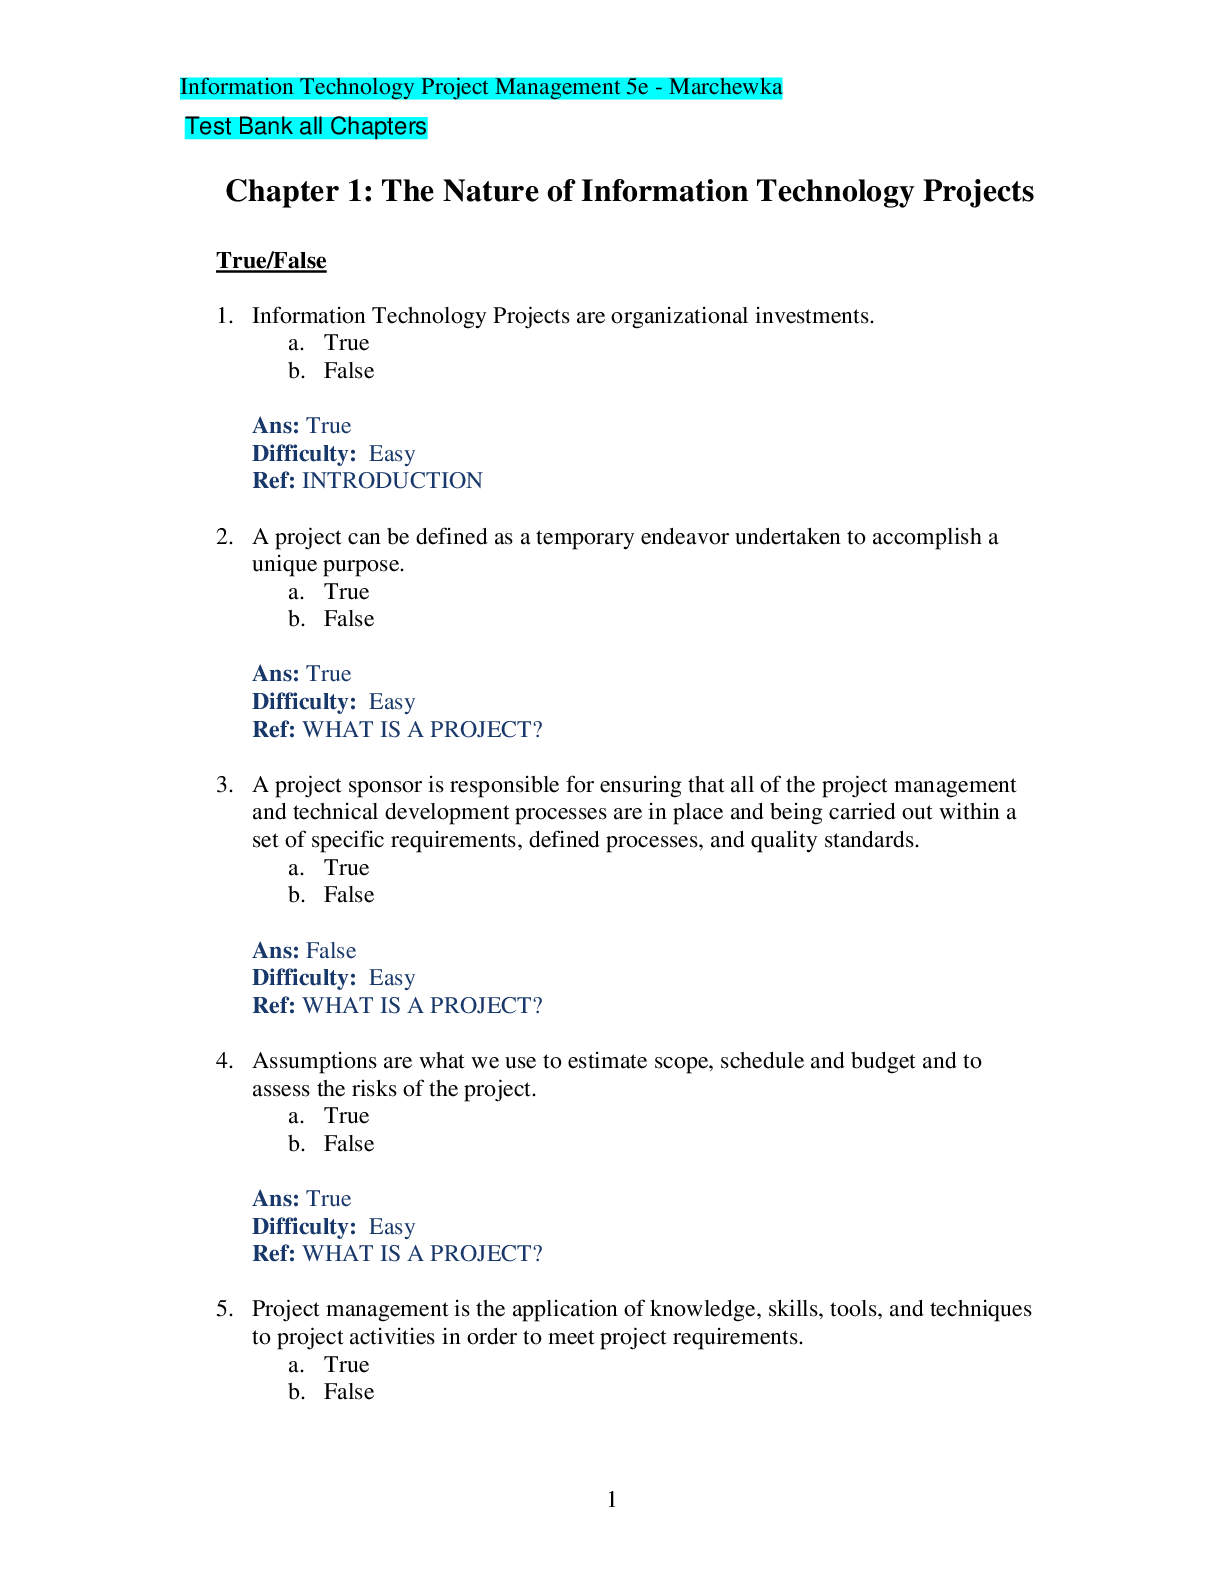
Test Bank for Information Technology Project Management 5th Ed...

Information Technology for the Health Professions, 4e Lillian...

Information Technology for Management Advancing Sustainable Pr...

Information Technology Auditing 3e James A. Hall (Test Bank)

Information Technology Project Management 8e Kathy Schwalbe (S...

Information Technology Auditing 3e James A. Hall (Solution Man...
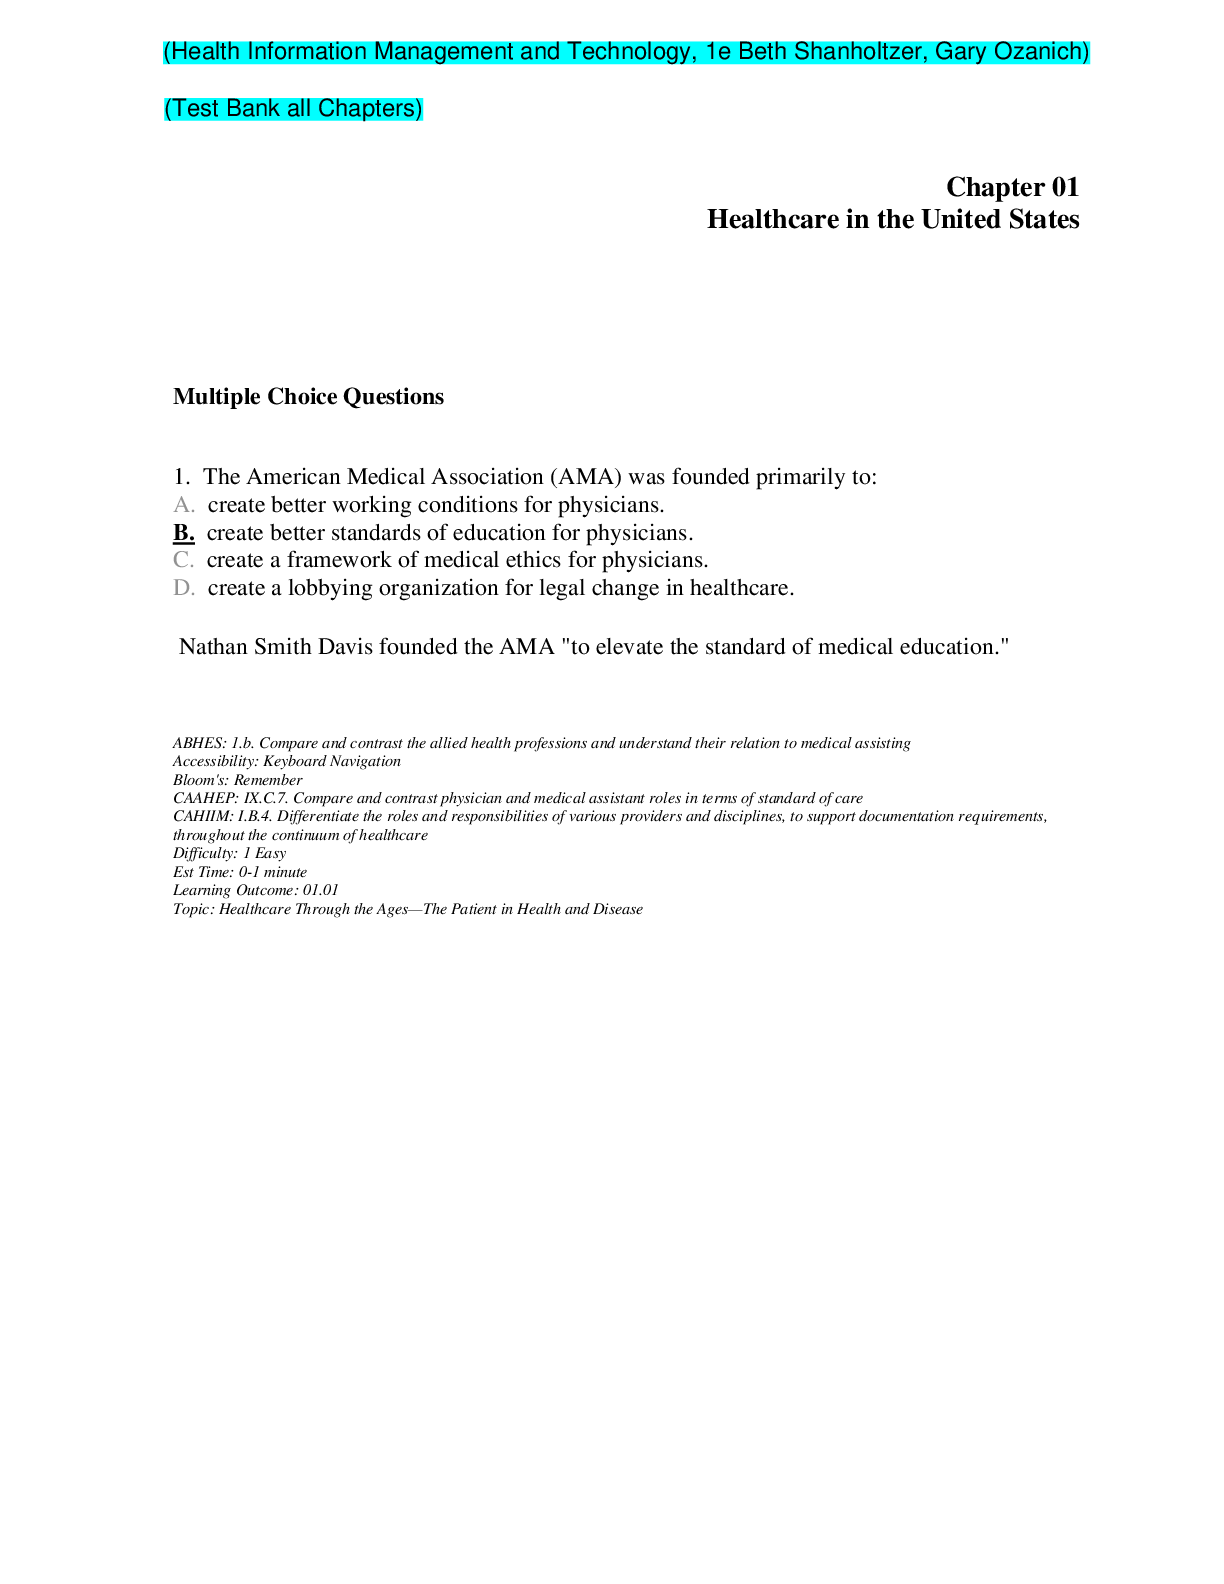
Health Information Management and Technology, 1e Beth Shanholt...
.png)
Introduction to Information Systems, 7e Kelly Rainer, Brad Pri...
.png)
Information Technology for Management Advancing Sustainable, P...
.png)
.png)


.png)

.png)