*NURSING > DISCUSSION POST > MATH 225N Week 2 Discussion, Graphing and Describing Data in Everyday Life (All)
MATH 225N Week 2 Discussion, Graphing and Describing Data in Everyday Life
Document Content and Description Below
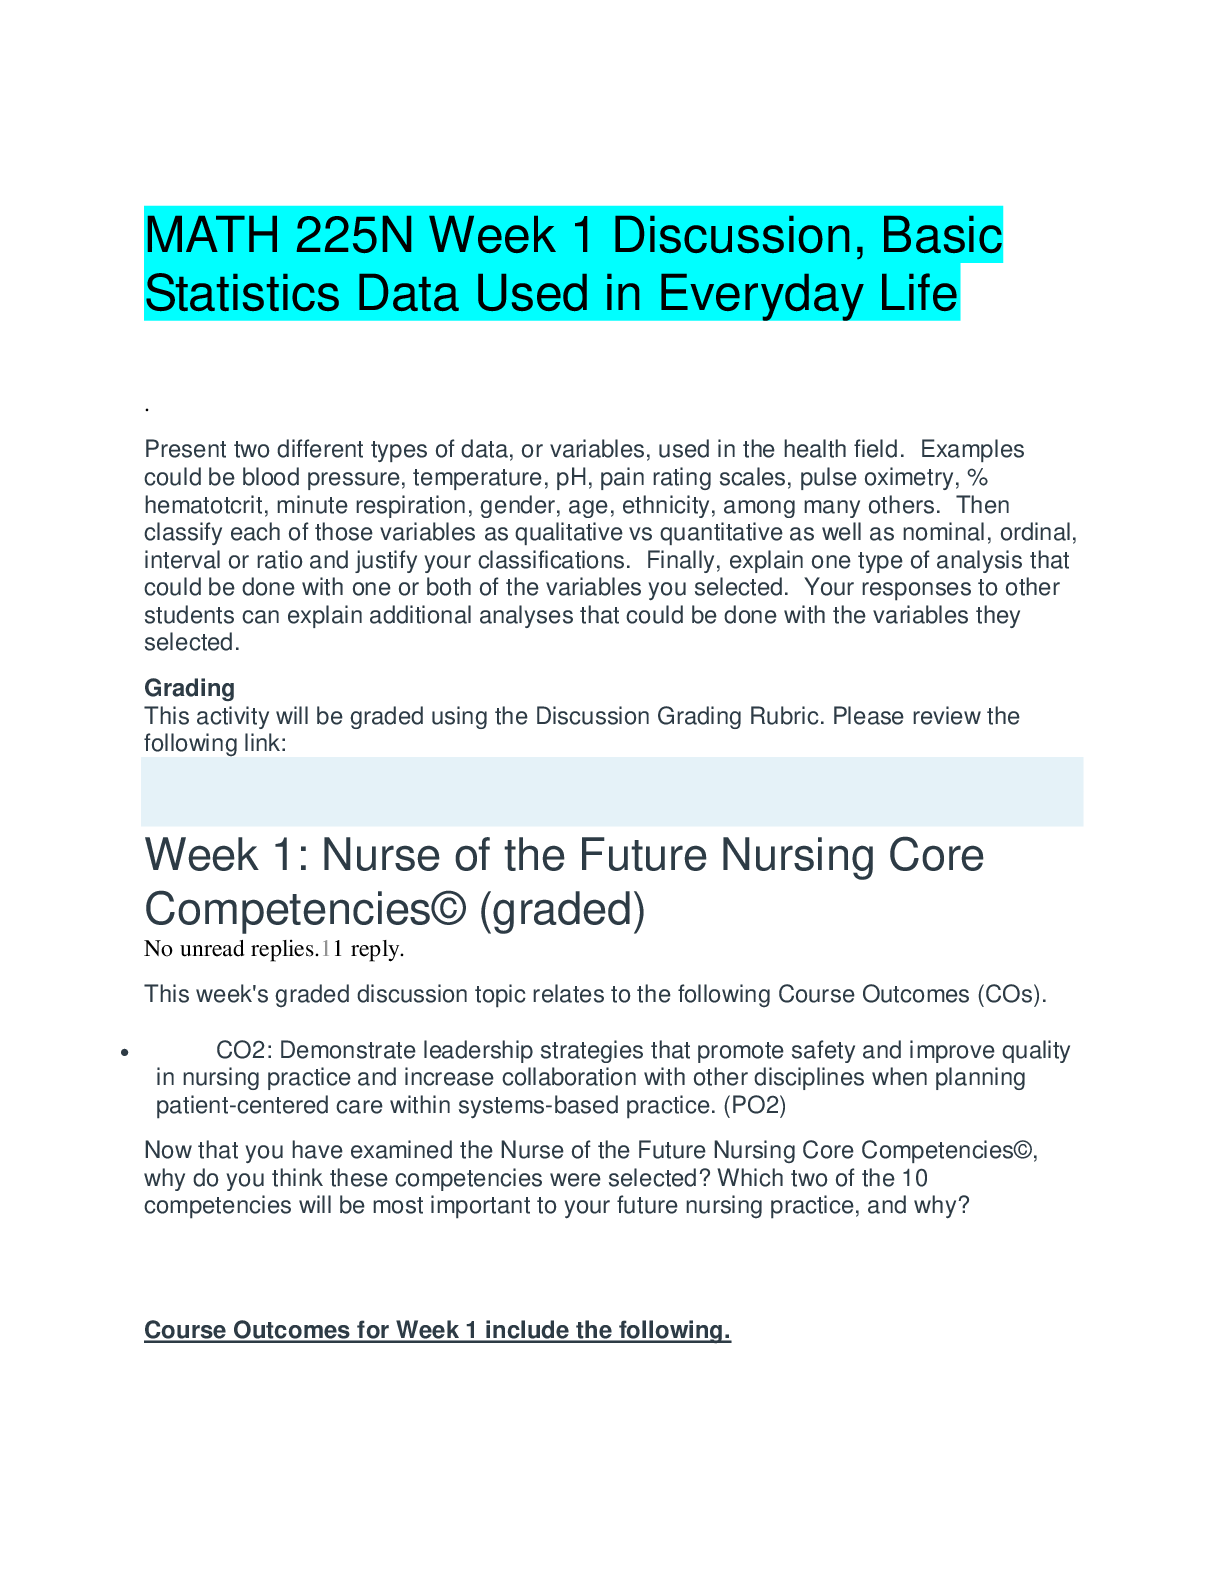
MATH 225N Week 2 Discussion, Graphing and Describing Data in Everyday Life Suppose that you have two sets of data to work with. The first set is a list of all the injuries that were seen in a clinic ... in a month's time. The second set contains data on the number of minutes that each patient spent in the waiting room of a doctor's office. You can make assumptions about other information or variables that are included in each data set. For each data set, propose your idea of how best to represent the key information. To organize your data would you choose to use a frequency table, a cumulative frequency table, or a relative frequency table? Why? What type of graph would you use to display the organized data from each frequency distribution? What would be shown on each of the axes for each graph? [Show More]
Last updated: 3 years ago
Preview 1 out of 3 pages

Buy this document to get the full access instantly
Instant Download Access after purchase
Buy NowInstant download
We Accept:

Also available in bundle (1)
Click Below to Access Bundle(s)

MATH 225N Week 1-8 Discussions and Answers
MATH 225N Week 1-8 Discussions and Answers
By YourTutor 4 years ago
$0.5
7
Reviews( 0 )
$6.00
Can't find what you want? Try our AI powered Search
Document information
Connected school, study & course
About the document
Uploaded On
Feb 15, 2021
Number of pages
3
Written in
All
Additional information
This document has been written for:
Uploaded
Feb 15, 2021
Downloads
0
Views
168


