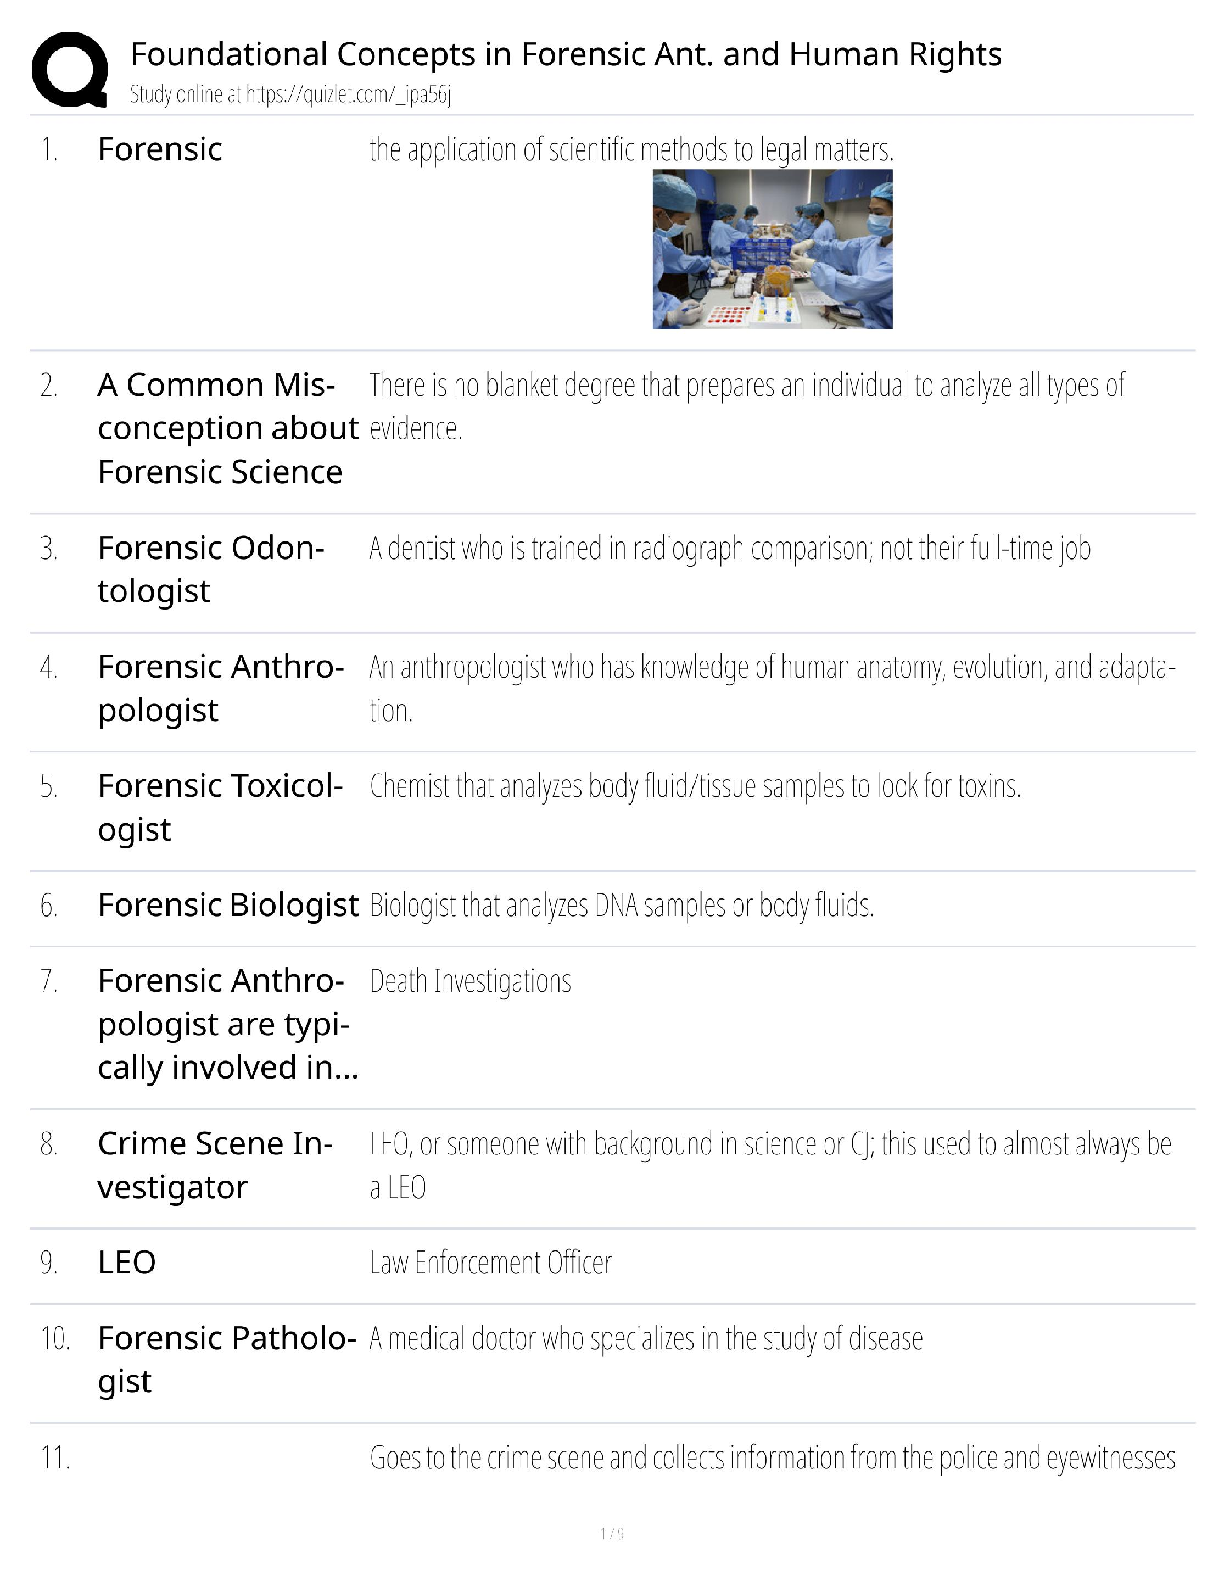
Forensic Science  >  A-Level Question Paper  >  THE MOST COMPREHENSIVE AND PRECISE TEAS 7 STUDY RESOURCES (All)

THE MOST COMPREHENSIVE AND PRECISE TEAS 7 STUDY RESOURCES

Document Content and Description Below

INAL Cumulative REVIEW (CHAPTERS 1-6) Two market resources in our country - demand/supply 1. state the law of demand (consumer side-behavioral) As the price of a good goes up, the demand goes down ... Or the price of a good goes down, the demand goes up. 2. define the law of supply (business side) As the cost of a good goes up, the supply goes up Or as the cost goes down, so does the supply. 3. what is considered a “normal” good by economists Normal good is – income of consumer goes up, demand goes up. Demand curve shifts to right. Results in higher prices and quantity goes up. 4. what is the difference between quantity demanded and demand curve? The quantity demanded is the quantity demanded at any given price whereas the demand curve is an illustration of the quantity demanded at any given price offered in the market. Any points on the demand curve is the quantity demanded. Demand curve is the whole graph. Shift to right or left. Change in price or change in income. 5. what is the reason why the quantity demanded of a good increases, when its price falls? 1. substitution effect – (tea and coffee are substitutes) 2. income effect (low income – no coffee if prices rise) Because as the price falls, people tend to buy more of a product. 6. define surplus and shortage Surplus and shortage are a market phenomenon. Shortage – prices go up. Surplus – prices go down and open up quantity Surplus and shortages are market phenomenon that occur in a market. Surpluses occur when the supply is higher than the demand whereas shortages occur when the demand is larger than the supply. 7. discuss factorsthat shift the demand curve Change in preference in consumer taste or income change. Shift left or right. Input prices, natural conditions, changesin technology, government taxes, regulations, and subsidies. 8. discuss factorsthat shift the supply curve 1. cost of inputs used for production ( labor, materials, # of suppliers) 2. Changes in taste, population, income, prices of a substitute product or complement product, expectations about future prices and market conditions. [Show More]

Last updated: 1 year ago

Preview 1 out of 19 pages

Buy Now

Instant download

We Accept:

Payment methods accepted on Scholarfriends (We Accept)
Preview image of THE MOST COMPREHENSIVE AND PRECISE TEAS 7 STUDY RESOURCES document

Buy this document to get the full access instantly

Instant Download Access after purchase

Buy Now

Instant download

We Accept:

Payment methods accepted on Scholarfriends (We Accept)

Reviews( 0 )

$15.00

Buy Now

We Accept:

Payment methods accepted on Scholarfriends (We Accept)

Instant download

Can't find what you want? Try our AI powered Search

28
0

Document information


Connected school, study & course


About the document


Uploaded On

Mar 24, 2024

Number of pages

19

Written in

All

Seller


Profile illustration for Joseph Waihenya
Joseph Waihenya

Member since 2 years

4 Documents Sold

Reviews Received
0
0
0
0
1
Additional information

This document has been written for:

Uploaded

Mar 24, 2024

Downloads

 0

Views

 28

More From Joseph Waihenya

View all Joseph Waihenya's documents »

$15.00
What is Scholarfriends

Scholarfriends.com Online Platform by Browsegrades Inc. 651N South Broad St, Middletown DE. United States.

We are here to help

We're available through e-mail, Twitter, Facebook, and live chat.
 FAQ
 Questions? Leave a message!

Follow us on
 Twitter

Copyright © Scholarfriends · High quality services·